By Jianmei Guo, Staff Engineer
Data centers have become the standard infrastructure for supporting large-scale Internet services. As they grow in size, each upgrade to the software (e.g. JVM) or hardware (e.g. CPU) becomes costlier and riskier. Reliable performance analysis to assess the utility of a given upgrade facilitates cost reduction and construction optimization at data centers, while erroneous analysis can produce misleading data, bad decisions, and ultimately huge losses.
This article is based on a speech by Guo Jianmei, a staff engineer at Alibaba, who delivered the original at a Java developer meetup. It introduces the challenges of performance monitoring and analysis at Alibaba's data centers.
Alibaba's signature data-crunching event is the 11.11 Global Shopping Festival, a platform-wide sale to mark the occasion of China's Singles' Day each year.
The figure below uses data at 2017. To give an idea of the scale of the event, the graph in the upper-left corner shows the sales figures: about US$ 25.3 billion, which is more than the combined sum of sales from Thanksgiving, Black Friday, through Cyber Monday in the US in the same year.
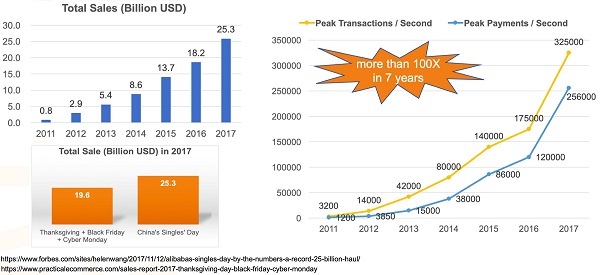
Technical professionals focus more on the graph on the right. In 2017, Alibaba's cloud platform enabled peak volumes of 325 thousand transactions and 256 thousand payments per second.
What does such high peak performance mean for Alibaba? It means cost! The reason we concern ourselves with performance is that we aim at cost reduction while continuously improving performance through constant technological innovation.
Behind the peak performance numbers above lies a large-scale software and hardware infrastructure that supports it.
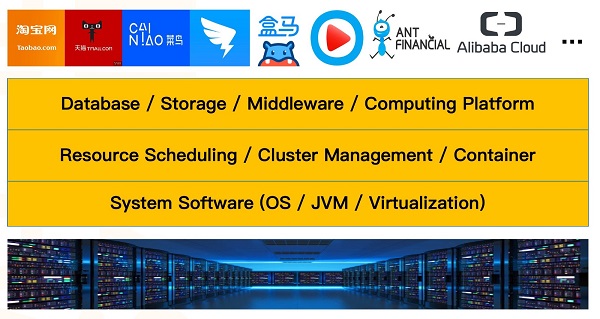
As shown in the above figure, Alibaba's infrastructure includes a variety of applications at the top layer, including e-commerce apps Taobao and Tmall, logistics network Cainiao, business messaging app DingTalk, payment platform Alipay, Alibaba Cloud, and so on. This diversity of business scenarios is a distinguished feature of the Alibaba economy.
At the bottom layer is a large-scale data center connected to millions of machines.
The middle layers are what we at Alibaba refer to as the Enabling Platform. The ones closest to the upper-layer applications are the database, storage, middleware, and computing platform. In between are resource scheduling, cluster management, and containers. At the bottom layers are system software, including the operating system, JVM and virtualization.
Benchmark tests are useful because we need a simple, reproducible way to measure performance. However, benchmark testing has its limitations, because each test is subject to its own defined operating environment along with its hardware and software configurations. These settings may have a significant impact on performance. Moreover, there is the further issue of whether the hardware and software configurations actually meet the business requirements and, by extension, produce representative results.
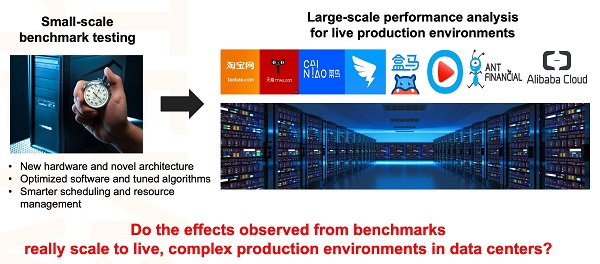
Can the effects observed in benchmark tests scale to live, complex production environments?
There are tens of thousands of business applications in Alibaba's data centers, and millions of servers are distributed across the world. So, when we consider upgrading software or hardware in a datacenter, a key question is whether the effects observed in small-scale benchmark testing really scale up to live, complex production environments in the data center.
For example, we might observe different performance influences of a JVM feature on different Java applications and different performance results of the same application on difference hardware. Cases like this are far from uncommon. Since it is infeasible for us to run tests for every application and every piece of hardware, we need a systematic approach to estimating the overall performance impact of a new feature on various applications and hardware.
It is critical to assess the overall performance impact of a software or hardware upgrade in data centers. Take our 11.11 Global Shopping Festival as example. We monitor the business indicators on peak volumes in sales and transactions very closely. But what if the business indicators double? Does that mean we have to double the number of all machines? To answer that question, we require a means of evaluation that assesses technological capability, while also demonstrating the impact of technology on business. Although we have proposed a lot of technological innovations and identified many opportunities for performance optimizations, we need to demonstrate the business value as well.
To address the problems mentioned above, we developed the System Performance Estimation, Evaluation and Decision (SPEED) platform.
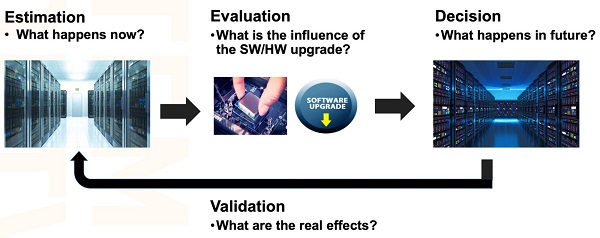
First of all, SPEED estimates what is happening presently in data centers. It collects data through global monitoring and analyzes the data to detect potential optimization opportunities.
Next, SPEED carries out an online evaluation of the software or hardware upgrade in production environments. For example, before introducing a new hardware product, the hardware vendor usually conducts their own performance tests that demonstrate performance gains. However, the performance gains are specific to the vendor's test scenarios. What we need to know is how suitable the hardware is for our specific use cases.
This is not the easiest question to answer. For obvious reasons, users cannot simply let hardware vendors test performance in their business environments. Instead, users need to do a canary release of the new hardware by themselves. Of course, the larger the scale of the canary release, the more accurate the evaluation is; however, it can't be too large in the very beginning because the production environment is directly related to the business. To minimize the risk, users typically settle for canary releases of between a handful of machines to several dozen, then gradually scale up to the hundreds, then thousands.
An important contribution of SPEED, therefore, is that it produces a reasonable estimate even for small-scale canary releases, which saves costs and reduces risks in the long run. As the scale of the canary release increases, SPEED continues to improve the quality of performance analysis, further assisting users in making critical decisions.
The aim of decision making is not only to decide whether to implement a given hardware or software upgrade, but also to develop a comprehensive understanding of the nature of the full software and hardware stack's performance. By understanding what kind of hardware and software architecture is more suitable for the target application scenario, we are able to consider the directions of software and hardware customization.
One of the most commonly-used performance metrics in data centers is CPU utilization. But consider this: If the average CPU utilization per machine in a data center is 50%, assuming that application demand is no longer growing, and pieces of software will not interfere with each other, can we halve the number of existing machines in the data center? Probably not.
As there are numerous distinct workloads and a large quantity of hardware, a major challenge for comprehensive performance analysis in data centers is to figure out a holistic performance metric to summarize the performance of different workloads and hardware. To the best of our knowledge, there is currently no uniform standard. In SPEED, we proposed a metric called Resource Usage Effectiveness (RUE), to measure the resource utilization per unit of work done:

Here, Resource Usage refers to the resource utilization of CPU, memory, storage and network and Work Done refers to queries for e-commerce applications or tasks for big data processing.
The idea of RUE provides a way to evaluate performance comprehensively from multiple perspectives. For example, if the business side informs us that the response time of an application on a machine has increased, we on the technical side also observe that the system load and CPU utilization have indeed increased. In a case like this, a natural response is to worry that a failure has occurred, most likely due to a newly launched feature. A better response, however, would be to look at the throughput indicator in queries per second (QPS) as well. If QPS has also increased, this might point to the fact that more resources are being used to complete more work after the release of the new feature, and contrary to the initial fear, the new feature may have resulted in a performance improvement.
This is why performance needs to be measured comprehensively from multiple perspectives. Otherwise, unreasonable conclusions may be drawn, causing us to miss out on real opportunities for performance optimization.
Performance analysis requires collection of data, but how do we know the data collected is correct?
Consider an example of hyperthreading, an Intel technology. Notebooks these days are generally dual-core, that is, they have two hardware cores. If hyperthreading is enabled, a dual-core machine becomes one with four hardware threads (a.k.a. logical CPUs).
In the below figure, the graph at the top shows a machine with two hardware cores and hyperthreading disabled. The CPU resources on both cores are used up; therefore, task manager reports that the average CPU utilization of the machine is 100%.
The graph in the lower-left corner shows a machine that also has two hardware cores, but for which hyperthreading is enabled. One of the hardware threads on each physical core is used up, so the average CPU utilization of the machine is 50%. Meanwhile, the graph in the lower-right corner, also showing a machine with two hardware cores, has hyperthreading enabled, and two hardware threads on a single core are used up. This means the average CPU utilization of the machine is also 50%.
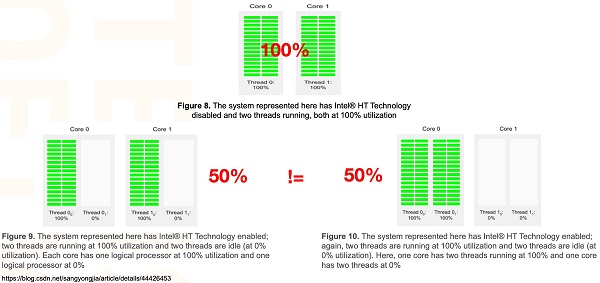
Herein lies the problem. In reality, the CPU usage shown in the lower-left graph is completely different from that of the lower-right graph, but if we collect only the average CPU utilization for the whole machine, the data indicates that they are exactly the same.
Thus, when making performance data analysis, we cannot afford to just consider data processing and algorithms. We must also consider how the data is collected; otherwise, the results can be misleading.
Hardware heterogeneity poses a major challenge for performance analysis in data centers, but it also indicates the directions for performance optimization.
For example, in the below figure, the Broadwell architecture on the left represents the mainstream architecture of Intel server CPUs over the last few years.
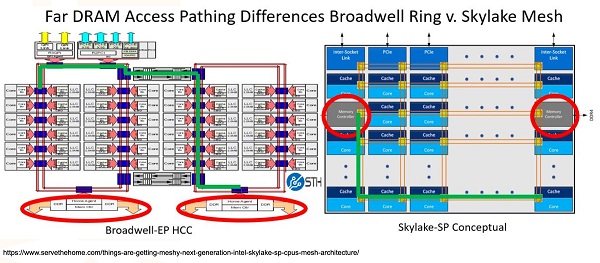
There are significant differences between the two architectures. For example, under Broadwell, memory is accessed through the dual ring mode that has been used for many years, while under Skylake, the memory access method has been changed to the mesh mode. Moreover, L2 Cache has been expanded fourfold under Skylake.
These differences each have pros and cons. We need to measure their impact on overall performance and consider whether to upgrade the data center's servers to Skylake, taking cost into account.
Understanding hardware differences is important, as these differences influence all applications running on the hardware. The hardware used significantly impacts the directions of customization and optimization.
The software architecture of modern Internet services is very complex, with Alibaba's e-commerce architecture being a prime example. Such complex software architecture also poses major challenges for performance analysis in data centers.
To give a simple example, the right side of the figure below shows a coupon application, the upper-left corner shows an application for the venue of a major promotion, and the lower-left corner shows the shopping cart application. These are typical business scenarios in e-commerce.

From the perspective of Java development, each business scenario is an application. E-commerce customers can select coupons from the promotion venue or from the shopping cart, depending on their preferences. From the perspective of software architecture, the venue and the shopping cart are the two main applications, and each is a portal for the coupon application. Different portals have different calling paths for the coupon application, each with a different impact on performance.
Therefore, in analyzing the overall performance of the coupon application, we need to consider the various intricate application associations and calling paths across the whole e-commerce architecture. Such diverse business scenarios and complex calling paths are difficult to fully reproduce in benchmark testing, which is why we need to do performance evaluation in live production environments.
The below figure shows the well-known Simpson's paradox in real data analysis.
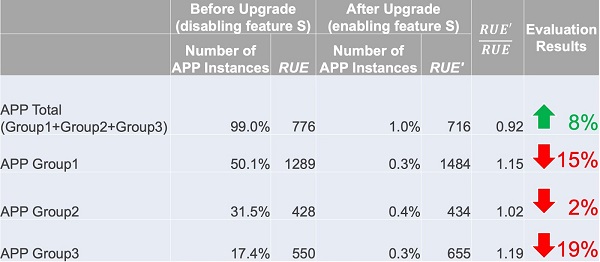
To continue with the preceding example, let's assume the app shown in the figure is the coupon application. A new feature S is launched during the promotion, and the machines used for the canary release occupy 1% of the total machines. According to the RUE metric, feature S improves performance by 8%. But here the coupon application has three different groups, and the groups relate to the applications with different portals as we discussed above, then from each group's perspective, the feature reduces the performance of the application.
With the same set of data and the same evaluation metrics, the results obtained through the overall aggregation analysis are precisely the opposite of the results obtained through the separate analysis of each part. This is Simpson's paradox.
We should be conscious that sometimes we need to look at the overall evaluation results, and sometimes we should look at the results for each constituent element. In this example, the right approach is to look at each group, and conclude that feature S actually degrades performance and requires further modification and optimization.
Simpson's Paradox is a good reminder of why it is essential to be mindful of the various potential pitfalls in performance analysis. Decision-making that is based on poorly conceived metrics or non-representative data, or that fails to take hardware and software architecture into account, can be extremely costly to businesses.
A Brief Analysis of Consensus Protocol: From Logical Clock to Raft

2,593 posts | 793 followers
FollowApsaraDB - June 29, 2020
Alibaba Clouder - November 15, 2019
Alibaba Cloud Native - June 6, 2024
Alibaba Cloud Native Community - July 26, 2022
Alibaba Developer - October 13, 2020
ApsaraDB - October 24, 2024

2,593 posts | 793 followers
Follow ECS(Elastic Compute Service)
Elastic and secure virtual cloud servers to cater all your cloud hosting needs.
Learn More OSS(Object Storage Service)
An encrypted and secure cloud storage service which stores, processes and accesses massive amounts of data from anywhere in the world
Learn MoreLearn More
More Posts by Alibaba Clouder