By Yanhua
As we all know, MySQL primary and secondary databases (two nodes) generally realize high data availability through asynchronous replication and semi-synchronous replication (Semi-Sync). However, in abnormal scenarios such as data center network failure and host hang, data inconsistency (RPO!=0 for short) will occur with high probability after HA switchover in the primary and secondary architectures. Therefore, if business data is of certain importance, it is recommended to choose a multi-replica architecture with RPO=0 rather than a database product with MySQL primary and secondary architectures (two nodes).
MySQL community evolves multi-replica technology with RPO=0:
• MySQL is officially open source that launches the MySQL Group Replication (MGR) high-availability solution based on group replication, which internally uses XCOM to encapsulate the Paxos protocol to ensure data consistency.
• Alibaba Cloud PolarDB-X is based on the business polishing and verification of Alibaba e-commerce Double 11 and active geo-redundancy. In October 2021, the kernel engine of PolarDB-X went source, fully compatible with the MySQL open source ecosystem. PolarDB-X is positioned as an integrated centralized-distributed database, whose Data Node (DN) uses a self-developed X-Paxos protocol and is highly compatible with MySQL 5.7/8.0, providing financial-grade high availability and being equipped with features of the highly scalable transaction engine, flexible O&M disaster recovery, and low-cost data storage. For more information, please refer to PolarDB-X Open Source | Three Replicas of MySQL Based on Paxos.
PolarDB-X integrated centralized-distributed concept: Data nodes are isolated as the centralized (Standard Edition) form, which is fully compatible with standalone databases. When the business grows to require distributed expansion, the architecture is upgraded to a distributed form in situ, and the distributed components are seamlessly connected to the original data nodes. You can enjoy the availability and scalability brought by the distributed architecture without data migration or application-side transformation. For the architecture description, please refer to Integrated Centralized-distributed Architecture.
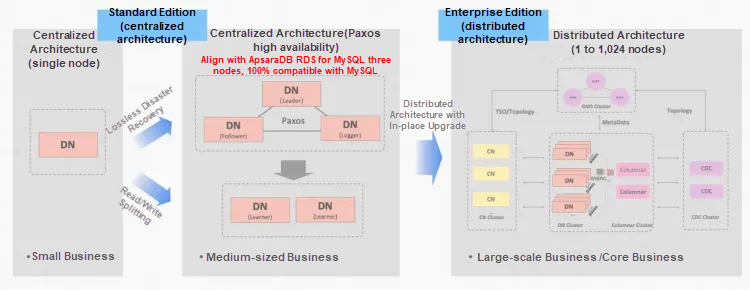
MySQL MGR and PolarDB-X Standard Edition DN both use the Paxos protocol at the bottom layer. What are their specific performance and differences in actual use? This article elaborates on architecture comparison, key differences, and comparison tests.
MGR/DN abbreviation description: MGR represents the technical form of MySQL MGR, and DN represents the technical form of PolarDB-X single DN centralized architecture (Standard Edition).
The detailed comparative analysis is relatively long, so you can look at the summary and conclusion first. If you are interested, you can follow the summary to find clues in subsequent articles.
MySQL MGR is not recommended for general businesses and companies, because it requires professional technical knowledge and O&M teams to use it well. This article also reproduces three "potential pitfalls" of MySQL MGR that have been circulating in the industry for a long time:
• Potential pitfall 1: The XCOM protocol of MySQL MGR uses full memory mode, which, by default, does not meet the data consistency guarantee of RPO=0 (there is a test case to reproduce the data loss later in this article). You need to configure a parameter to ensure it. Currently, MGR cannot achieve both performance and RPO.
• Potential pitfall 2: MySQL MGR performs poorly under network latency. The article tests and compares four network scenarios (including three data centers in the same region and three centers across two regions). Under the configuration of performance parameters, the cross-region performance is only 1/5 of that in the same region. If the data guarantee of RPO=0 is enabled, the performance will be even worse. Therefore, MySQL MGR is more suitable for use in the same data center scenario, but not for cross-data center disaster recovery.
• Potential pitfall 3: In the MySQL MGR multi-replica architecture, the failure of the secondary node will cause the traffic of the primary node Leader to drop to 0, which is not reasonable. This article focuses on enabling MGR single Leader mode (benchmarked against the previous primary and secondary replica architecture of MySQL) to simulate the two actions of downtime and recovery of the secondary replica. The operation and maintenance of the secondary node will also cause the traffic of the primary node (Leader) to drop to 0 (lasting for about 10 seconds), resulting in poor overall operation and maintenance performance. Therefore, MySQL MGR has high requirements for host O&M and needs professional DBA teams.
Compared with MySQL MGR, PolarDB-X Paxos does not have the same pitfalls as MGR in data consistency, cross-data center disaster recovery, and node O&M. However, Paxos also has some minor disadvantages and advantages in disaster recovery:
• Disadvantages: In the simple scenario of the same data center, the read-only performance under low concurrency and the pure write performance under high concurrency are about 5% lower than those of MySQL MGR. At the same time, the network transmission of multiple replicas still needs to be optimized in performance.
• Advantages: It is fully compatible with MySQL 5.7/8.0 features. At the same time, it makes many streamlined optimizations on the secondary database replication and failover paths of multiple replicas. The high availability switchover RTO is less than or equal to 8 seconds. The four common disaster recovery scenarios in the industry all perform well and can replace semi-sync and MGR.
MGR/DN abbreviation description:
• MGR: the technical form of MySQL MGR. The subsequent content refers to it as MGR.
• DN: the technical form of Alibaba Cloud PolarDB-X centralized architecture (Standard Edition), in which the distributed data node is isolated as the centralized (Standard Edition) form, which is fully compatible with standalone databases. The subsequent content refers to it as DN.
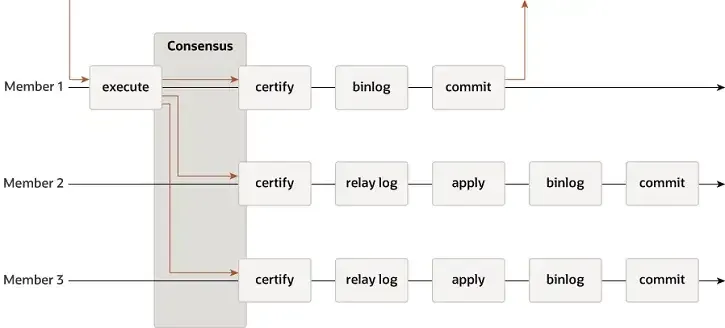
MGR supports single-leader and multi-leader modes and completely reuses MySQL replication systems, including Event, Binlog & Relaylog, Apply, Binlog Apply Recovery, and GTID. Its key difference from DN is that the entry point agreed upon by the MGR transaction log majority is before the primary database transaction is committed.
• Leader:
• Follower:
The reason why MGR adopts the preceding process is that MGR uses the multi-leader mode by default and each node can process write requests. Therefore, the Follower node in a single Paxos Group needs to convert the received log into RelayLog first, then commit it combined with the write transaction received by itself as the Leader, and produce the binlog file in the two-phase group commit process to commit the final transaction.
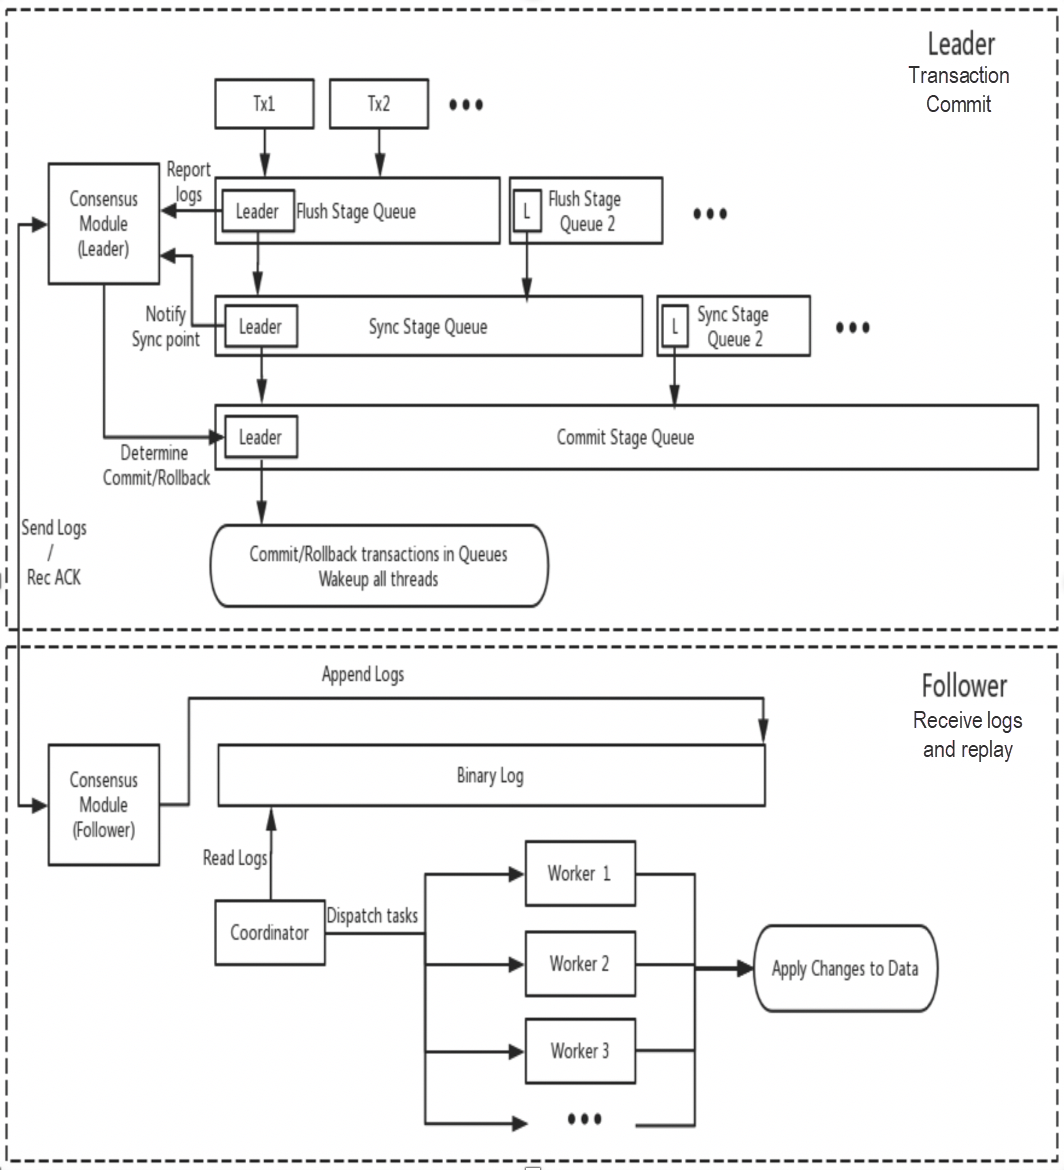
DN reuses the basic data structure and function-level code of MySQL, but closely combines log replication, management and replay, and crash recovery with the X-Paxos protocol to form its own set of majority replication and state machine mechanisms. Its key difference from MGR is that the entry point agreed upon by the DN transaction log majority is in the primary database transaction commit process.
• Leader:
• Follower:
The reason for this design is that DN currently only supports single-leader mode, so the log at the X-Paxos protocol layer is the binlog itself, and the Follower also omits the Relay Log. The data content of its persistent log is equivalent to that of Leader and other logs.
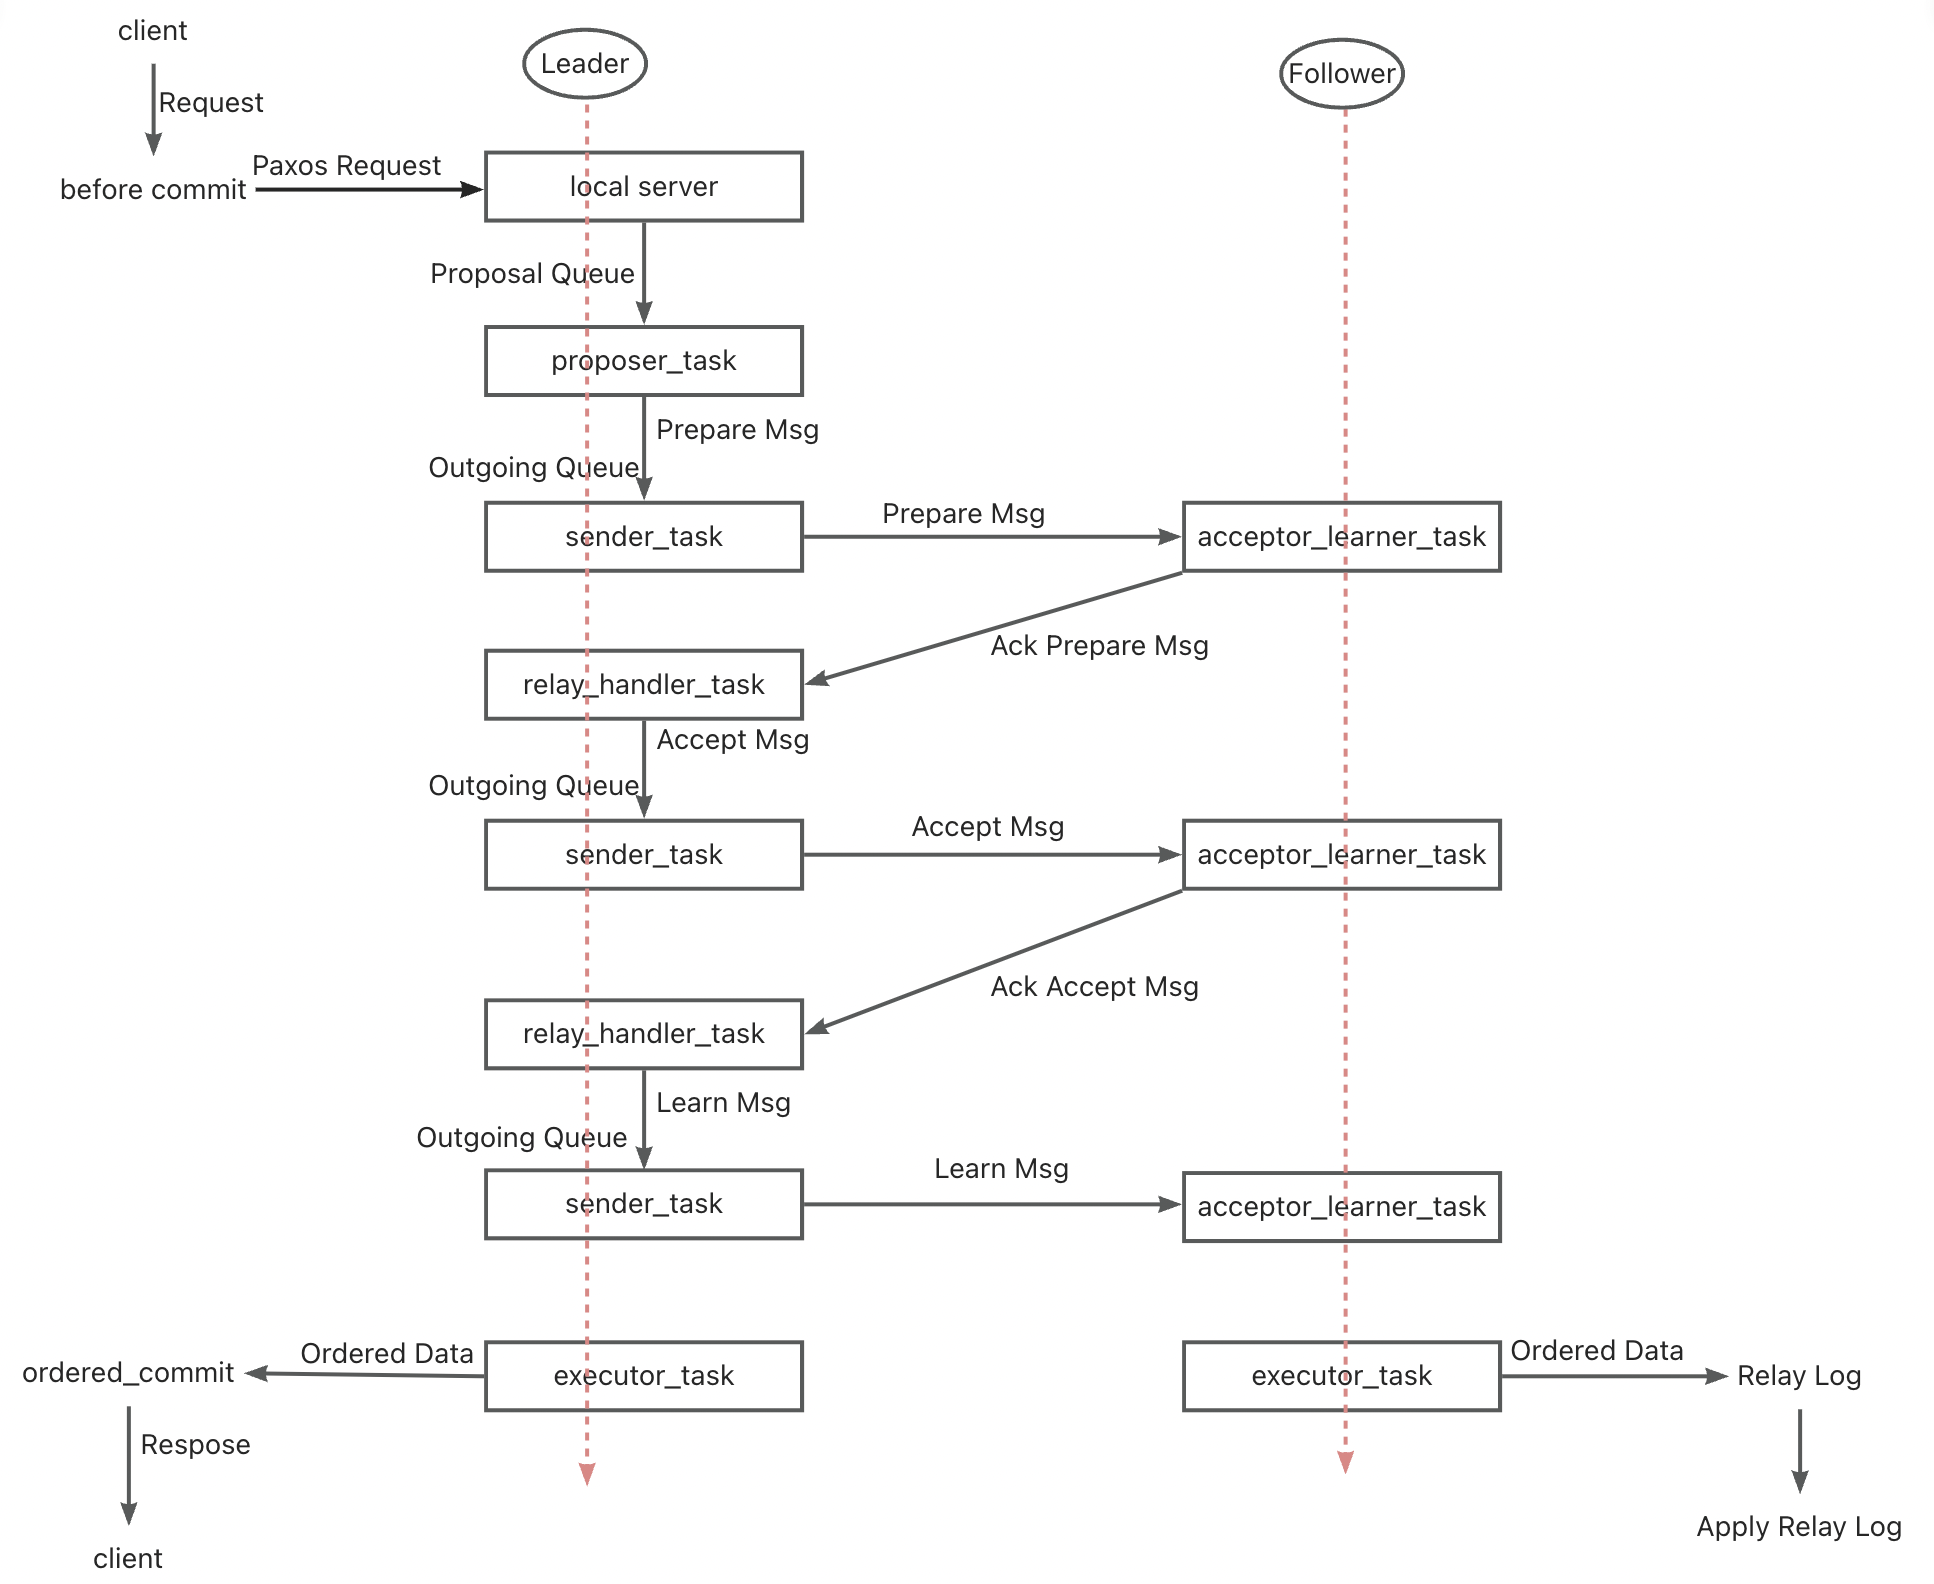
• The Paxos protocol of MGR, which belongs to the Multi-Paxos theory, is implemented based on the Mencius protocol. The difference is that Mencius makes improvements in reducing the load of the primary node and improving the throughput.
• The Paxos protocol of MGR is implemented by the XCOM components and supports multi-leader and single-leader mode deployment. In single-leader mode, binlogs on the Leader are atomically broadcast to Follower nodes. Each batch of messages (one transaction) is broadcast in a standard Multi-Paxos process.
• To meet the majority of a transaction, XCOM needs to go through at least three packet interactions of Accept+AckAccept+Learn, that is, at least 1.5 RTT overheads. XCOM goes through at most five packet interactions of Prepare+AckPrepare+Accept+AckAccept+Learn, that is, at most 2.5 RTT overheads.
• Since the Paxos protocol is completed in the XCOM module with high cohesion, the MySQL replication system is not aware of it. Therefore, the Leader must wait for the Paxos process to be completed before committing the transaction locally, including the persistence of the binlog and group commit.
• After the Follower completes the majority commit, the Events are persisted to the Relay Log asynchronously, and then the SQL Thread application and group commit generate the binlog.
• The logs synchronized by Paxos are unsorted binlogs before entering the group commit process. Therefore, the sequence of Binlog Events on the Leader node may not be the same as that of Events on the Relay Log on the Follower node.
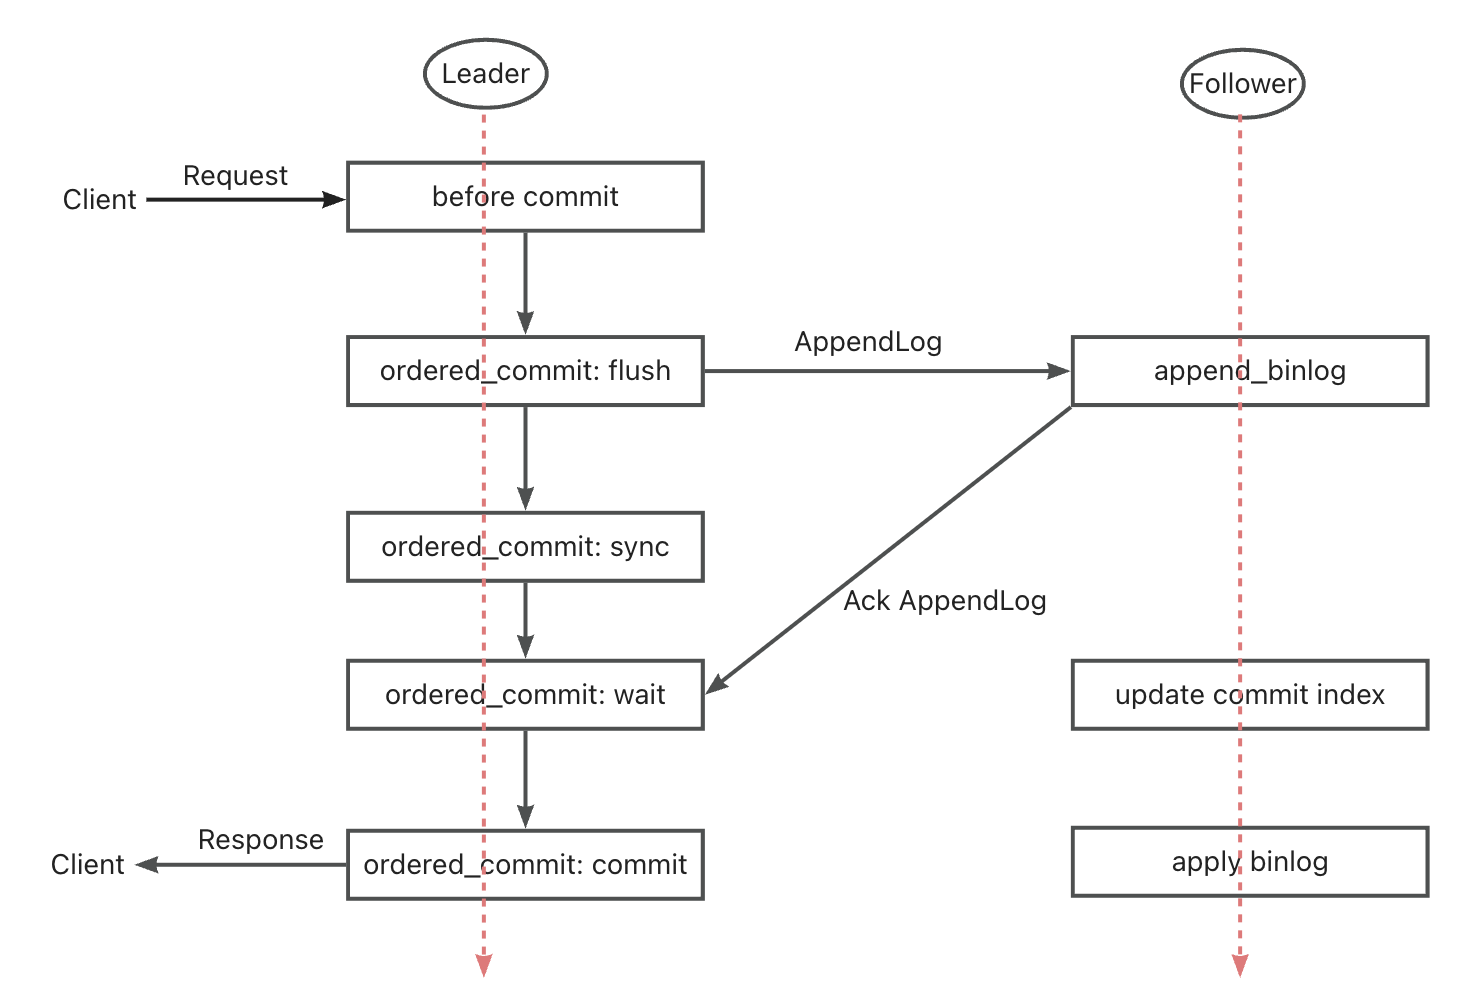
• The Paxos protocol of DN, also belonging to the Multi-Paoxs theory, is implemented based on the Raft protocol. The difference is that the Raft protocol has a stronger Leadership guarantee and stability guarantee.
• The Paxos protocol of DN is implemented by the X-Paoxs components. The default mode is a single-leader mode. In single-leader mode, binlogs on the Leader are atomically broadcast to Follower nodes. Each batch of messages is broadcast in a standard Raft process.
• To meet the majority of a transaction, X-Paoxs only needs to go through two packet interactions of Append+AckAppend, with only one RTT overhead.
• After the Leader sends logs to the Follower, it commits the transaction as long as the majority is met, without waiting for the Commit Index broadcast in the second phase.
• Follower needs to persist all transaction logs on the premise of completing the majority commit, which is significantly different from XCOM of MGR. MGR only needs to receive them in XCOM memory.
• The Commit Index is included in subsequent messages and heartbeat messages. After the Commit Index is pushed up, the Follower will apply the Event.
• The binlogs of the Leader and the Follower are in the same order. Raft logs have no holes, and use the Batching/Pipeline mechanism to increase the log replication throughput.
• Compared with MGR, the Leader always has only one round-trip latency when a transaction is committed, which is very critical for latency-sensitive distributed applications.
Theoretically, both Paxos and Raft can ensure data consistency and ensure that the logs that have reached a majority are not lost after Crash Recovery, but they still differ in specific implementations.
XCOM fully encapsulates the Paxos protocol with all its protocol data first cached in memory. By default, transactions reaching the majority do not require log persistence. In the case of majority downtime or Leader failure, there will be a serious problem of RPO != 0. Assume an extreme scenario:
Under the default parameters of the community, transactions reaching the majority do not require log persistence and do not guarantee RPO=0, which can be considered as a trade-off for performance in XCOM implementation. To ensure an absolute RPO=0, you need to set the parameter group_replication_consistency that controls read-write consistency to AFTER. However, if this is the case, in addition to 1.5 RTT network overheads, you also need a log I/O overhead for transactions to reach the majority, which will result in poor performance.
PolarDB-X DN uses X-Paxos to implement a distributed protocol and is deeply bound to the MySQL Group Commit process. When a transaction is committed, it is mandatory for the majority to confirm the data is persisted to disk before the transaction can be truly committed. Here, the majority of data persistence refers to the binlog of the primary database being stored on the disk. The I/O thread of the secondary database receives the log of the primary database and stores it on the disk for persistence in its own binlog. Therefore, even if all nodes fail in extreme scenarios, data will not be lost and RPO=0 can be guaranteed.
The RTO time is closely related to the time overhead of cold restart of the system, which is reflected in the specific basic functions, namely, fault detection mechanism -> crash recovery mechanism -> leader election mechanism -> log leveling.
• Each node periodically sends heartbeat packets to other nodes to check whether other nodes are healthy. The heartbeat period is fixed at 1s and cannot be adjusted.
• If the current node finds that other nodes do not respond after exceeding group_replication_member_expel_timeout (5s by default), they are regarded as failed and kicked out of the cluster.
• For exceptions such as network interruptions or unexpected restarts, after the network is recovered, a single faulty node attempts to automatically join the cluster and then level the log.
• The Leader node periodically sends heartbeat packets to other nodes to check whether other nodes are healthy. The heartbeat period is 1/5 of the election timeout. The election timeout is controlled by the parameter consensus_election_timeout with the default value of 5s. Therefore, the heartbeat period of the Leader node is 1s by default.
• If the Leader finds that other nodes are disconnected, it will continue to periodically send heartbeat packets to all other nodes to ensure that other nodes can be connected in time after crash recovery. However, the Leader node no longer sends transaction logs to the disconnected nodes.
• Although non-Leader nodes do not send heartbeat packets, if a non-Leader node finds that it does not receive the heartbeat of the Leader node for more than the consensus_election_timeout time, it triggers a re-election.
• For exceptions such as network interruptions or unexpected restarts, the faulty node will automatically join the cluster after the network is recovered.
• Therefore, in terms of fault detection, DN provides more O&M configuration interfaces, which can more accurately identify faults in cross-region deployment scenarios.
o The Paxos protocol implemented by XCOM is in the memory state, and the majority of nodes do not require persistence. The protocol state is subject to the memory state of the surviving majority nodes. If all nodes are suspended, the protocol cannot be recovered. After the cluster is restarted, manual intervention is required to recover the protocol.
o If only a single node crashes and needs to be recovered, but the Follower node lags behind the Leader node by a large number of transaction logs, the XCOM cached transaction logs on the Leader have been cleared, and only the Global Recovery or Clone process can be used.
o The XCOM cache size is controlled by group_replication_message_cache_size, by default 1GB.
o Global Recovery means that when a node rejoins the cluster, it recovers data by obtaining the required missing transaction logs (Binary Log) from other nodes. This process relies on at least one node in the cluster retaining all the required transaction logs.
o Clone, depending on Clone Plugin, is used for recovery when the data volume is large or many logs are missing. It does this by copying a snapshot of the entire database to the crashed node, followed by a final synchronization with the latest transaction logs.
o The Global Recovery and Clone processes are usually automated, but in some special cases, such as network issues or the XCOM cache of the other two nodes being cleared, manual intervention is required to solve the problem.
o The X-Paxos protocol uses the binlog for persistence. During crash recovery, committed transactions are completely recovered first. For pending transactions, you need to wait until the XPaxos protocol layer reaches a consensus on the primary/secondary relationship before committing or rolling back the transaction. The entire process is fully automated. Even if all nodes are suspended, the cluster can be automatically recovered by restarting.
o In the scenario where the Follower node lags behind the Leader node by many transaction logs, as long as the binlog files on the Leader node are not deleted, the Follower node will catch up with the Leader node.
o Therefore, in terms of crash recovery, DN does not require any manual intervention.
In the single-leader mode, the basic principles followed by the leader election in strong Leader modes such as XCOM of MGR and DN X-Paxos are the same, that is, the logs that the cluster has reached consensus on cannot be rolled back. However, when it comes to non-consensus logs, there are differences.
• The leader election is more in the sense of which node will serve as the Leader node. This Leader does not necessarily have the latest consensus logs when it is elected, so it needs to synchronize the latest logs from other nodes in the cluster and provide read and write services after leveling the logs.
• The advantage of this is that the choice of Leader itself is a strategic product, such as weight and order. MGR controls the weight of each node through group_replication_member_weight.
• The disadvantage is that the newly elected Leader may have a high replication latency and needs to continue to level the log, or have a high application latency and needs to continue to level the log application before providing read and write services. This results in a longer RTO time.
• Leader election is a protocol-based process. The node that owns the logs of all the majorities in the cluster can be elected as the Leader. Therefore, this node may be a Follower or a Logger before.
• However, the Logger cannot provide read and write services. After it synchronizes logs to other nodes, it voluntarily gives up the Leader role.
• To ensure that the designated node becomes the Leader, DN uses the optimistic weight policy and the forced weight policy to limit the order of becoming the leader, and uses a strategic majority mechanism to ensure that the new leader can provide read and write services immediately without latency.
• Therefore, in terms of leader selection, DN not only supports the same strategic selection as MGR but also supports the forced weight policy.
Log leveling means that there is a log replication latency between the primary and secondary databases, and the secondary database needs to level the logs. For nodes that need to be restarted and recovered, recovery usually starts with the secondary database, which has a relatively high log replication latency with the primary database and needs to level the logs of the primary database. For nodes that are physically far away from the Leader, the majority achievement is usually irrelevant to them. They keep leveling the logs due to log replication latency. These situations require specific implementation to ensure the timely resolution of log replication latency.
• The transaction logs are all in the XCOM cache, whose size is only 1G by default, so when copying the request logs of a Follower node that is far behind, the cache has likely been cleaned up already.
• At this point, this lagging Follower will be automatically kicked out of the cluster, and then automatically join the cluster after leveling the log using the preceding Global Recovery or Clone process mentioned in crash recovery. If there is a network problem or the XCOM cache of the other two nodes is cleared, manual intervention is required to solve the problem.
• The reason why the lagging Follower must be kicked out of the cluster first is that the faulty node in multi-write mode greatly affects the performance, and the Leader's cache has no effect on it. It is better to join after asynchronous leveling.
• The reason why we do not directly read the local binlog file of Leader is that the XCOM protocol mentioned earlier is in full memory state, and there is no protocol information about XCOM in Binlog and Relay Log.
• Since the data is in the binlog file, as long as the binlog is not cleaned up, it can be sent on demand without the possibility of being kicked out of the cluster.
• To reduce the I/O jitter caused by the primary database reading the old transaction logs from the binlog file, DN preferentially reads the most recently cached transaction logs from the FIFO Cache, which is controlled by the parameter consensus_log_cache_size with the default size of 64M.
• If the old transaction logs in the FIFO Cache have been eliminated by the updated transaction logs, DN will try to read the previously cached transaction logs from the Prefetch Cache, which is controlled by the parameter consensus_prefetch_cache_size with the default size of 64M.
• If the required old transaction logs are not available in the Prefetch Cache, DN attempts to initiate an asynchronous I/O task to read several consecutive logs before and after the specified transaction log from the binlog file in batches, place them in the Prefetch Cache, waiting for DN to retry reading again.
• Therefore, in terms of leveling logs, DN does not need manual intervention at all.
The replay latency of the secondary database is the latency between the moment when the same transaction is committed in the primary database and the moment when it is applied in the secondary database. What is tested here is the performance of the secondary database applying the log. It affects the time it takes for the secondary database to complete its own data application and provide read and write services after it becomes the new primary database when an exception occurs.
• The MGR secondary database receives the RelayLog file from the primary database. During application, the RelayLog file needs to be read again and goes through a complete two-phase group commit process to produce the corresponding data and binlog file.
• The transaction application efficiency here is the same as the transaction commit efficiency on the primary database. The default double-one configuration (innodb_flush_log_at_trx_commit and sync_binlog) causes a relatively high overhead for the secondary database applying the same source.
• The DN secondary database receives the binlog file from the primary database. During application, the binlog file needs to be read again and only goes through a one-phase group commit process to produce the corresponding data.
• Since DN supports complete Crash Recover, the secondary database application does not need to enable innodb_flush_log_at_trx_commit=1, so it is not affected by the double-one configuration.
• Therefore, in terms of the replay latency of the secondary database, the replay efficiency of the DN secondary database will be much greater than that of the MGR.
Large-scale transactions affect not only the commit of ordinary transactions but also the stability of the entire distributed protocol in a distributed system. In severe cases, a large-scale transaction may cause the entire cluster to be unavailable for a long time.
• MGR does not optimize its support for large-scale transactions. It only joins the parameter group_replication_transaction_size_limit to control the upper limit of large-scale transactions. The default value is 143M and the maximum value is 2GB.
• When the transaction logs exceed the limit of large-scale transactions, an error is directly reported and the transaction cannot be committed.
• To address the instability of distributed systems caused by large-scale transactions, DN adopts the solution of large-scale transaction splitting and large-scale object splitting to eradicate it. DN splits the transaction logs of large-scale transactions into small pieces by logical splitting and physical splitting. Each small piece of transaction logs is guaranteed to be committed by using complete Paxos.
• Based on the large-scale transaction splitting solution, DN does not limit the size of large-scale transactions for free usage, which can also guarantee RPO=0.
For more information, please refer to Core Technology of PolarDB-X Storage Engine | Optimization of Large-Scale Transactions.
• Therefore, in the processing of large-scale transaction issues, DN can be unaffected by large-scale transactions.
• MGR supports single-leader and multi-leader deployment modes. In multi-leader mode, each node is readable and writable; in single-leader mode, the primary database is readable and writable, and the secondary database is read-only.
• MGR high-availability deployment requires at least three nodes, that is, at least three copies of data and logs. The Logger mode of log replicas is not supported.
• MGR does not support the expansion of read-only nodes, but the combination of MGR and primary/secondary replication mode to achieve similar topology extension.
• DN supports single-leader mode deployment. In single-leader mode, the primary database is readable and writable, while the secondary database is read-only.
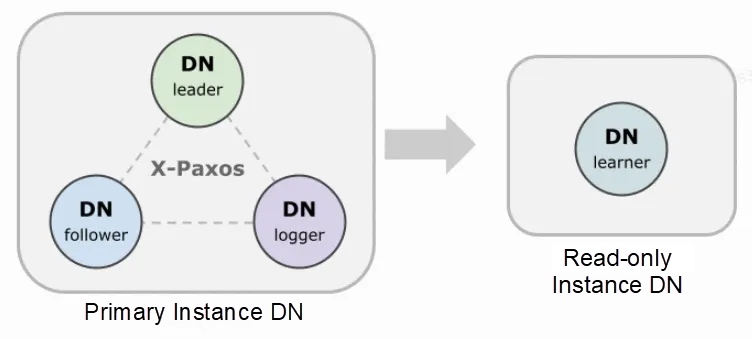
• DN high-availability deployment requires at least three nodes, and the Logger mode of log replicas is supported. That is, Leader and Follower are full-featured replicas, while Logger only has logs but no data and is not eligible for election. In this way, three-node high-availability deployment only requires the storage overhead of two copies of data and three copies of logs, which is a low-cost deployment.
• DN supports the deployment of read-only nodes and the Learner mode of read-only replicas. Compared with full-featured replicas, DN only has no voting rights. It achieves downstream subscription consumption of the primary database through Learner replicas.
| Major Items | Sub-item | MGR | DN |
|---|---|---|---|
| Protocol Efficiency | Transaction Commit Duration | 1.5~2.5 RTT | 1 RTT |
| Majority persistence | XCOM memory saving | Binlog persistence | |
| Reliability | RPO=0 | Not guaranteed by default | Fully guaranteed |
| Fault Detection | All nodes check each other with a high network load and an unadjustable heartbeat period. | The primary node periodically checks other nodes with an adjustable heartbeat period. | |
| Majority Crash Recovery | Manual intervention | Automatic recovery | |
| Minority Crash Recovery | Most of them use automatic recovery with manual intervention in special cases. | Automatic recovery | |
| Leader Election | Free to specify the election order | Free to specify the election order | |
| Log Leveling | Lagging logs cannot exceed 1GB of XCOM cache. | Binlog files are not deleted. | |
| The Replay Latency of the Secondary Database | Two-phase and double-one, very slow | One-phase and double-zero, faster | |
| Large-Scale Transactions | The default limit cannot exceed 143MB | No size limit | |
| Deployment Mode | High-availability Cost | Full-featured three replicas with storage overhead of three copies of data | Logger log replicas with storage overhead of two copies of data |
| Read-only Node | Achieved with primary-secondary replication | Achieved with the Leaner read-only replica |
MGR was introduced in MySQL 5.7.17, but more MGR-related features are only available in MySQL 8.0, and it will be more stable and reliable as a whole in MySQL 8.0.22 and later versions. Therefore, we choose the latest version 8.0.32 of both sides for comparative testing.
Considering the differences in the test environment, test methods, compilation methods, deployment modes, and runtime parameters when comparing PolarDB-X DN and MySQL MGR, which may lead to inaccurate comparison test data, this article adopts the following methods in each detail:
| Preparations | PolarDB-X DN / MySQL MGR[1] |
|---|---|
| Hardware Environment | Use the same physical machine with 96C 754GB memory and SSD |
| Operating System | Linux 4.9.168-019.ali3000.alios7.x86_64 |
| Kernel Version | Use community-based kernel baselines for version 8.0.32 |
| Compilation | Compile with the same RelWithDebInfo |
| Runtime Parameters | Use the same parameters as the 32C128G specification sold on the PolarDB-X official website |
| Deployment Mode | Single-leader mode |
Note:
• MGR enables flow control by default, while PolarDB-X DN does not. Therefore, the group_replication_flow_control_mode of MGR is configured to be disabled separately, achieving the best performance.
• MGR has an obvious so read bottleneck during point queries, so the replication_optimize_for_static_plugin_config of MGR is configured to be enabled separately, achieving the best read-only performance.
Performance Testing is the first thing that everyone pays attention to when selecting a database. Here, we use the official sysbench tool to build 16 tables, each with 10 million data, to perform performance testing in OLTP scenarios, and compare the performance of the two in different concurrent OLTP scenarios. Considering the different deployment situations, we simulate the following four deployment scenarios respectively:
Note:
• MGR_0 indicates the data for MGR RPO = 0.
• MGR_1 indicates the data for MGR RPO <> 0.
• DN indicates the data for DN RPO = 0.
|
1 |
4 |
16 |
64 |
256 |
||
|
oltp_read_only |
MGR_1 |
688.42 |
2731.68 |
6920.54 |
11492.88 |
14561.71 |
|
MGR_0 |
699.27 |
2778.06 |
7989.45 |
11590.28 |
15038.34 |
|
|
DN |
656.69 |
2612.58 |
7657.03 |
11328.72 |
14771.12 |
|
|
MGR_0 vs MGR_1 |
1.58% |
1.70% |
15.45% |
0.85% |
3.27% |
|
|
DN vs MGR_1 |
-4.61% |
-4.36% |
10.64% |
-1.43% |
1.44% |
|
|
DN vs MGR_0 |
-6.09% |
-5.96% |
-4.16% |
-2.26% |
-1.78% |
|
|
oltp_read_write |
MGR_1 |
317.85 |
1322.89 |
3464.07 |
5052.58 |
6736.55 |
|
MGR_0 |
117.91 |
425.25 |
721.45 |
217.11 |
228.24 |
|
|
DN |
360.27 |
1485.99 |
3741.36 |
5460.47 |
7536.16 |
|
|
MGR_0 vs MGR_1 |
-62.90% |
-67.85% |
-79.17% |
-95.70% |
-96.61% |
|
|
DN vs MGR_1 |
13.35% |
12.33% |
8.00% |
8.07% |
11.87% |
|
|
DN vs MGR_0 |
205.55% |
249.44% |
418.59% |
2415.07% |
3201.86% |
|
|
oltp_write_only |
MGR_1 |
761.87 |
2924.1 |
7211.97 |
10374.15 |
16092.02 |
|
MGR_0 |
309.83 |
465.44 |
748.68 |
245.75 |
318.48 |
|
|
DN |
1121.07 |
3787.64 |
7627.26 |
11684.37 |
15137.23 |
|
|
MGR_0 vs MGR_1 |
-59.33% |
-84.08% |
-89.62% |
-97.63% |
-98.02% |
|
|
DN vs MGR_1 |
47.15% |
29.53% |
5.76% |
12.63% |
-5.93% |
|
|
DN vs MGR_0 |
261.83% |
713.78% |
918.76% |
4654.58% |
4652.96% |
It can be seen from the test results that:
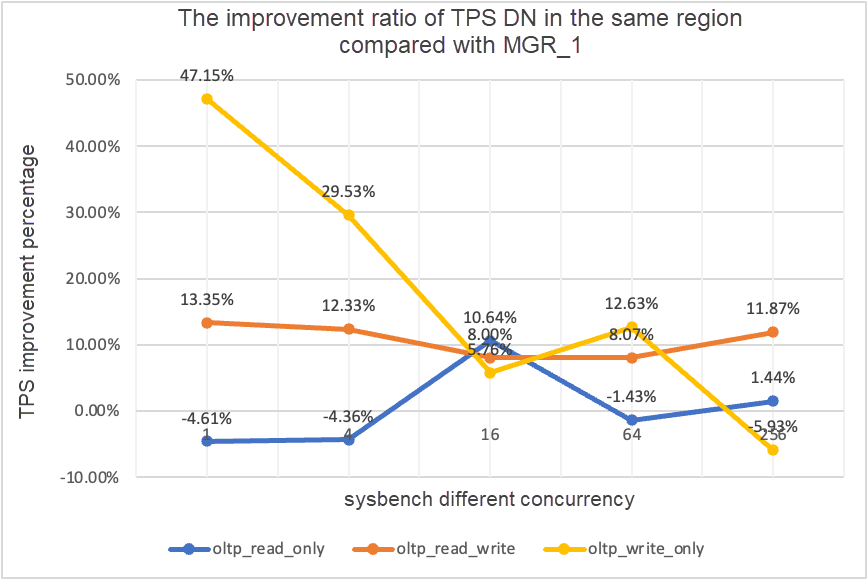
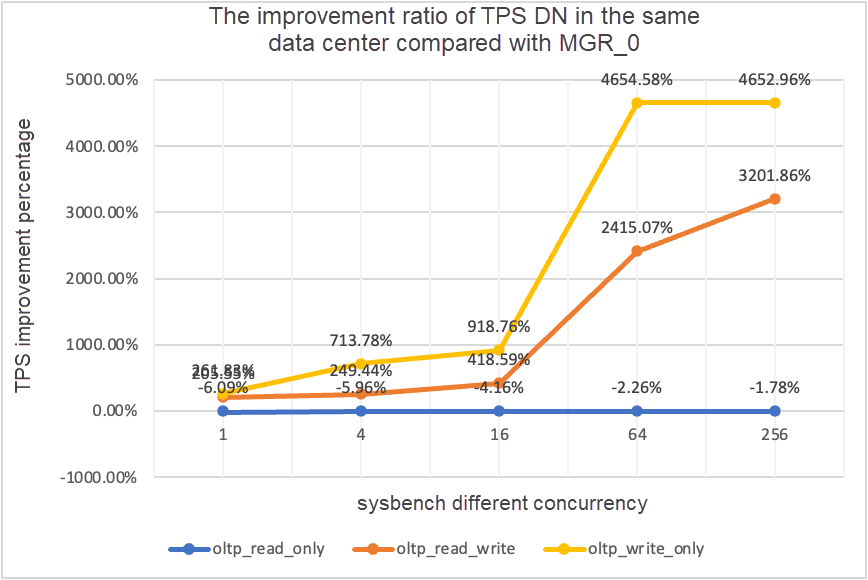
• In the read-only scenario, whether comparing MGR_1 (RPO<>0) or MGR_0 (RPO=0), the difference between DN and MGR is stable between -5% and 10%, which can be considered to be basically the same. Whether RPO is equal to 0 does not affect read-only transactions.
• In read/write and write-only scenarios, the performance of DN (RPO=0) is improved by 5% to 47% compared with that of MGR_1 (RPO<>0) with a significant performance advantage at low concurrency and an insignificant advantage at high concurrency. This is because the protocol efficiency of DN is higher at low concurrency, while the performance hot spots of DN and MGR at high concurrency are all on flushing.
• On the premise of the same RPO=0, the performance of DN is improved by 2 to 46 times compared with that of MGR_0 in read/write and write-only transaction scenarios, and the performance advantage of DN is enhanced with the increase of concurrency. It is no wonder that MGR discards RPO=0 by default for performance.
|
TPS Comparison |
1 |
4 |
16 |
64 |
256 |
|
|
oltp_read_only |
MGR_1 |
695.69 |
2697.91 |
7223.43 |
11699.29 |
14542.4 |
|
MGR_0 |
691.17 |
2708.6 |
7849.98 |
11636.94 |
14670.99 |
|
|
DN |
645.11 |
2611.15 |
7628.39 |
11294.36 |
14647.22 |
|
|
MGR_0 vs MGR_1 |
-0.65% |
0.40% |
8.67% |
-0.53% |
0.88% |
|
|
DN vs MGR_1 |
-7.27% |
-3.22% |
5.61% |
-3.46% |
0.72% |
|
|
DN vs MGR_0 |
-6.66% |
-3.60% |
-2.82% |
-2.94% |
-0.16% |
|
|
oltp_read_write |
MGR_1 |
171.37 |
677.77 |
2230 |
3872.87 |
6096.62 |
|
MGR_0 |
117.11 |
469.17 |
765.64 |
813.85 |
812.46 |
|
|
DN |
257.35 |
1126.07 |
3296.49 |
5135.18 |
7010.37 |
|
|
MGR_0 vs MGR_1 |
-31.66% |
-30.78% |
-65.67% |
-78.99% |
-86.67% |
|
|
DN vs MGR_1 |
50.17% |
66.14% |
47.82% |
32.59% |
14.99% |
|
|
DN vs MGR_0 |
119.75% |
140.01% |
330.55% |
530.97% |
762.86% |
|
|
oltp_write_only |
MGR_1 |
248.37 |
951.88 |
2791.07 |
5989.57 |
11666.16 |
|
MGR_0 |
162.92 |
603.72 |
791.27 |
828.16 |
866.65 |
|
|
DN |
553.69 |
2173.18 |
5836.64 |
10588.9 |
13241.74 |
|
|
MGR_0 vs MGR_1 |
-34.40% |
-36.58% |
-71.65% |
-86.17% |
-92.57% |
|
|
DN vs MGR_1 |
122.93% |
128.30% |
109.12% |
76.79% |
13.51% |
|
|
DN vs MGR_0 |
239.85% |
259.96% |
637.63% |
1178.61% |
1427.92% |
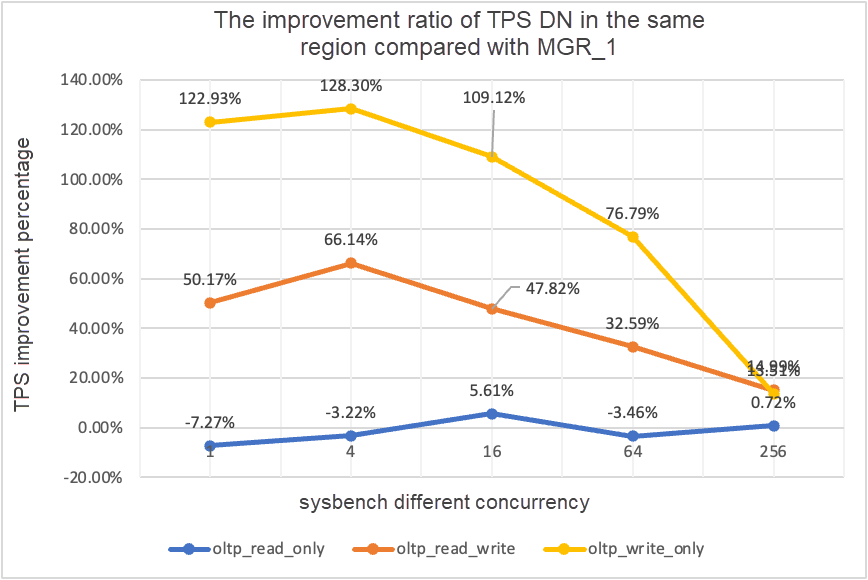
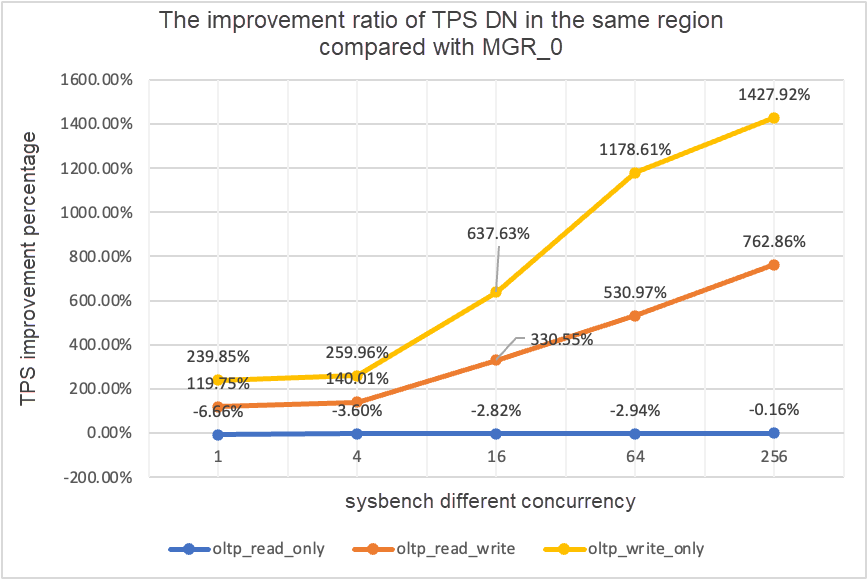
It can be seen from the test results that:
• In the read-only scenario, whether comparing MGR_1 (RPO<>0) or MGR_0 (RPO=0), the difference between DN and MGR is stable between -7% to 5%, which can be considered to be basically the same. Whether RPO is equal to 0 does not affect read-only transactions.
• In read/write and write-only scenarios, the performance of DN (RPO=0) is improved by 30% to 120% compared with that of MGR_1 (RPO<>0), with a significant performance advantage at low concurrency and an insignificant advantage at high concurrency. This is because the protocol efficiency of DN is higher at low concurrency, while the performance hot spots of DN and MGR at high concurrency are all on flushing.
• On the premise of the same RPO=0, the performance of DN is improved by 1 to 14 times compared with that of MGR_0 in read/write and write-only transaction scenarios, and the performance advantage of DN is enhanced with the increase of concurrency. It is no wonder that MGR discards RPO=0 by default for performance.
|
TPS Comparison |
1 |
4 |
16 |
64 |
256 |
|
|
oltp_read_only |
MGR_1 |
687.76 |
2703.5 |
7030.37 |
11580.36 |
14674.7 |
|
MGR_0 |
687.17 |
2744.41 |
7908.44 |
11535.35 |
14656 |
|
|
DN |
657.06 |
2610.58 |
7591.21 |
11174.94 |
14545.45 |
|
|
MGR_0 vs MGR_1 |
-0.09% |
1.51% |
12.49% |
-0.39% |
-0.13% |
|
|
DN vs MGR_1 |
-4.46% |
-3.44% |
7.98% |
-3.50% |
-0.88% |
|
|
DN vs MGR_0 |
-4.38% |
-4.88% |
-4.01% |
-3.12% |
-0.75% |
|
|
oltp_read_write |
MGR_1 |
29.13 |
118.64 |
572.25 |
997.92 |
2253.19 |
|
MGR_0 |
26.94 |
90.8 |
313.64 |
419.17 |
426.7 |
|
|
DN |
254.87 |
1146.57 |
3339.83 |
5307.85 |
7171.95 |
|
|
MGR_0 vs MGR_1 |
-7.52% |
-23.47% |
-45.19% |
-58.00% |
-81.06% |
|
|
DN vs MGR_1 |
774.94% |
866.43% |
483.63% |
431.89% |
218.30% |
|
|
DN vs MGR_0 |
846.07% |
1162.74% |
964.86% |
1166.28% |
1580.79% |
|
|
oltp_write_only |
MGR_1 |
30.81 |
145.54 |
576.61 |
1387.64 |
3705.51 |
|
MGR_0 |
28.68 |
108.86 |
387.48 |
470.5 |
476.4 |
|
|
DN |
550.11 |
2171.64 |
5866.41 |
10381.72 |
14478.38 |
|
|
MGR_0 vs MGR_1 |
-6.91% |
-25.20% |
-32.80% |
-66.09% |
-87.14% |
|
|
DN vs MGR_1 |
1685.49% |
1392.13% |
917.40% |
648.16% |
290.73% |
|
|
DN vs MGR_0 |
1818.10% |
1894.89% |
1413.99% |
2106.53% |
2939.12% |
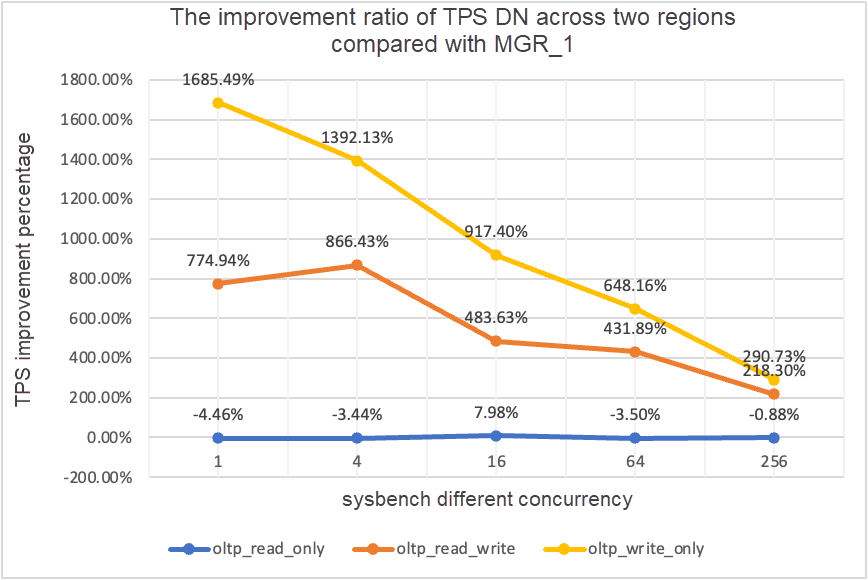
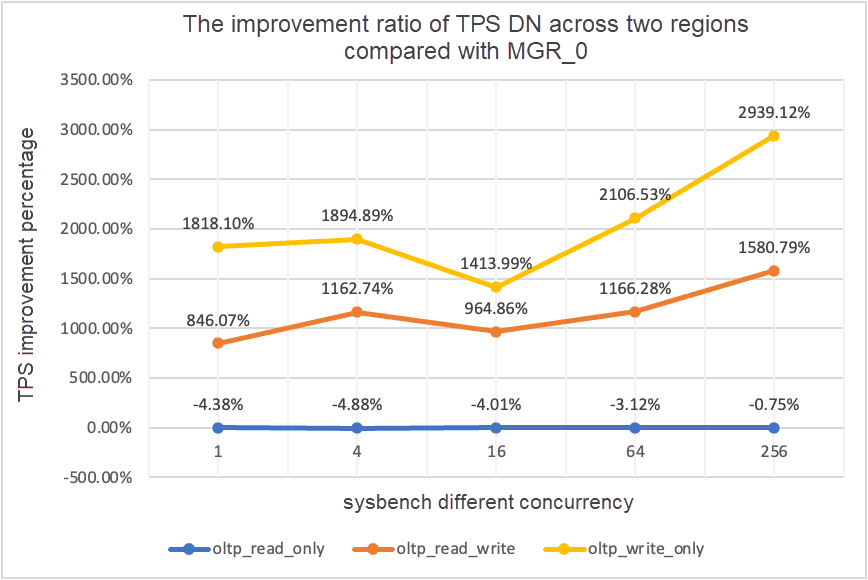
It can be seen from the test results that:
• In the read-only scenario, whether comparing MGR_1 (RPO<>0) or MGR_0 (RPO=0), the difference between DN and MGR is stable between -4% to 7%, which can be considered to be basically the same. Whether RPO is equal to 0 does not affect read-only transactions.
• In read/write and write-only scenarios, the performance of DN (RPO=0) is improved by 2 to 16 times compared with that of MGR_1 (RPO<>0), with a significant performance advantage at low concurrency and an insignificant advantage at high concurrency. This is because the protocol efficiency of DN is higher at low concurrency, while the performance hot spots of DN and MGR at high concurrency are all on flushing.
• On the premise of the same RPO=0, the performance of DN is improved by 8 to 29 times compared with that of MGR_0 in read/write and write-only transaction scenarios, and the performance advantage of DN is enhanced with the increase of concurrency. It is no wonder that MGR discards RPO=0 by default for performance.
|
TPS Comparison |
1 |
4 |
16 |
64 |
256 |
|
|
oltp_read_only |
MGR_1 |
688.49 |
2747.69 |
7853.91 |
11722.71 |
15292.73 |
|
MGR_0 |
687.66 |
2756.3 |
8005.11 |
11567.89 |
15055.69 |
|
|
DN |
656.06 |
2600.35 |
7657.85 |
11227.56 |
14562.86 |
|
|
MGR_0 vs MGR_1 |
-0.12% |
0.31% |
1.93% |
-1.32% |
-1.55% |
|
|
DN vs MGR_1 |
-4.71% |
-5.36% |
-2.50% |
-4.22% |
-4.77% |
|
|
DN vs MGR_0 |
-4.60% |
-5.66% |
-4.34% |
-2.94% |
-3.27% |
|
|
oltp_read_write |
MGR_1 |
26.01 |
113.98 |
334.95 |
693.34 |
2030.6 |
|
MGR_0 |
23.93 |
110.17 |
475.68 |
497.92 |
511.99 |
|
|
DN |
122.06 |
525.88 |
1885.7 |
3314.9 |
5889.79 |
|
|
MGR_0 vs MGR_1 |
-8.00% |
-3.34% |
42.02% |
-28.19% |
-74.79% |
|
|
DN vs MGR_1 |
369.28% |
361.38% |
462.98% |
378.11% |
190.05% |
|
|
DN vs MGR_0 |
410.07% |
377.34% |
296.42% |
565.75% |
1050.37% |
|
|
oltp_write_only |
MGR_1 |
27.5 |
141.64 |
344.05 |
982.47 |
2889.85 |
|
MGR_0 |
25.52 |
155.43 |
393.35 |
470.92 |
504.68 |
|
|
DN |
171.74 |
535.83 |
1774.58 |
4328.44 |
9429.24 |
|
|
MGR_0 vs MGR_1 |
-7.20% |
9.74% |
14.33% |
-52.07% |
-82.54% |
|
|
DN vs MGR_1 |
524.51% |
278.30% |
415.79% |
340.57% |
226.29% |
|
|
DN vs MGR_0 |
572.96% |
244.74% |
351.15% |
819.15% |
1768.36% |
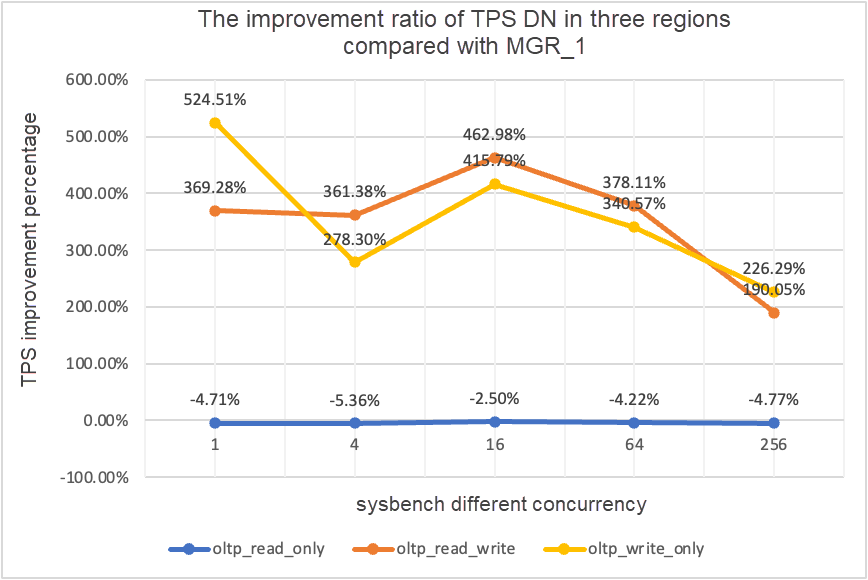
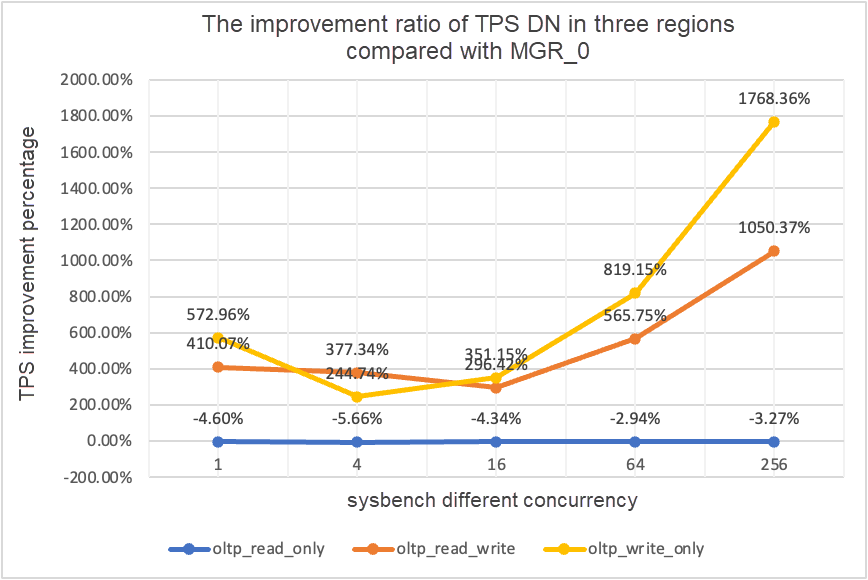
It can be seen from the test results that:
• In the read-only scenario, whether comparing MGR_1 (RPO<>0) or MGR_0 (RPO=0), the difference between DN and MGR is stable between -5% and 0%, which can be considered to be basically the same. Whether RPO is equal to 0 does not affect read-only transactions.
• In read/write and write-only scenarios, the performance of DN (RPO=0) is improved by 2 to 5 times compared with that of MGR_1 (RPO<>0), with a significant performance advantage at low concurrency and an insignificant advantage at high concurrency. This is because the protocol efficiency of DN is higher at low concurrency, while the performance hot spots of DN and MGR at high concurrency are all on flushing.
• On the premise of the same RPO=0, the performance of DN is improved by 2 to 17 times compared with that of MGR_0 in read/write and write-only transaction scenarios, and the performance advantage of DN is enhanced with the increase of concurrency. It is no wonder that MGR discards RPO=0 by default for performance.
To clearly compare the performance changes under different deployment modes, we select the TPS data of MGR and DN under different deployment modes in the oltp_write_only scenario with 256 concurrent transactions in the above test, and take the center test data as the baseline to calculate the proportion of TPS data under different deployment modes compared with the baseline, so as to perceive the performance changes during cross-region deployment.
| MGR_1 (256 Concurrent Transactions) | DN (256 Concurrent Transactions) | Performance Advantages of DN over MGR | |
|---|---|---|---|
| Same Data Center | 16092.02 | 15137.23 | -5.93% |
| Three Data Centers in the Same Region | 11666.16 (72.50%) | 13241.74 (87.48%) | +13.50% |
| Three Data Centers across Two Regions | 3705.51 (23.03%) | 14478.38 (95.64%) | +290.72% |
| Three Data Centers in Three Regions | 2889.85 (17.96%) | 9429.24 (62.29%) | +226.28% |
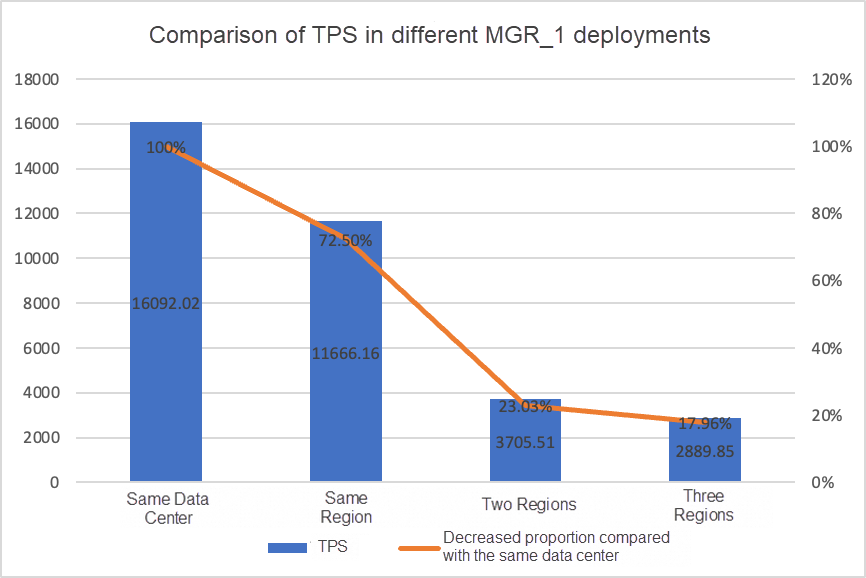
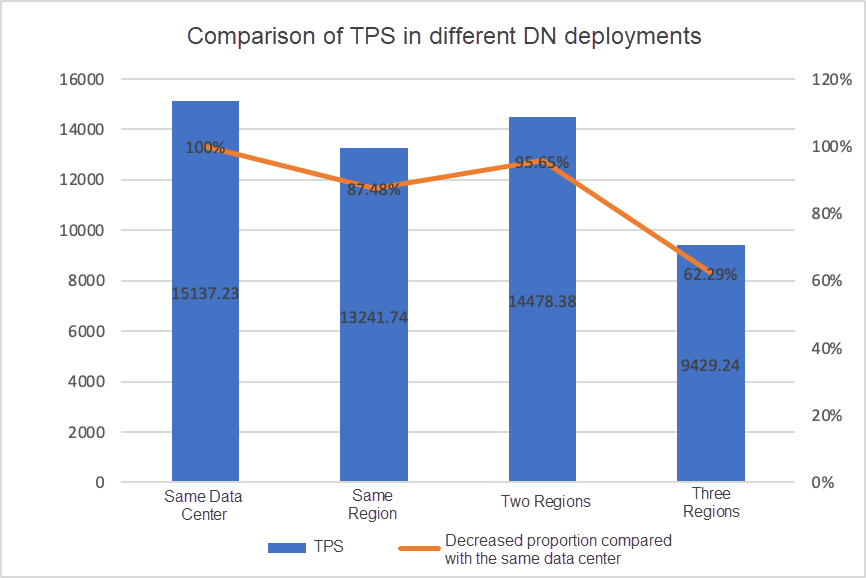
It can be seen from the test results that:
• With the expansion of the deployment mode, the TPS of MGR_1 (RPO<>0) decreases significantly. Compared with the deployment in the same data center, the performance of deployment across data centers in the same region has decreased by 27.5%, and the performance of cross-region (three data centers across two regions and three centers in three regions) deployment has decreased by 77% to 82%, which is due to the increase of RT in cross-region deployment.
• However, DN (RTO=0) is relatively stable. Compared with the deployment in the same data center, the performance of deployment across centers in the same region and three centers across two regions decreases by 4% to 12%. The performance of three centers in three regions decreases by 37% when deployed under high network latency, which is also due to the increase of RT in cross-region deployment. However, thanks to the Batch & Pipeline mechanism of DN, the impact of cross-region deployment can be solved by improving concurrency. For example, the performance throughput under the architecture of three centers in three regions can basically align with that under the architecture of the same region and three centers across two regions under 512 or more concurrent transactions.
• This shows that cross-region deployment has a great impact on MGR_1 (RPO<>0).
In actual use, we pay attention to not only the performance data but also the performance jitter. After all, if the jitter is like a roller coaster, the actual user experience is also very poor. We monitor and display TPS real-time output data. Considering that the sysbench tool itself does not support outputting the monitoring data of performance jitter, we use the mathematical coefficient of variation as a comparison metric:
• Coefficient of Variation (CV): The coefficient of variation is the standard deviation divided by the mean, which is often used to compare fluctuations across data sets, especially when the means vary significantly. The larger the CV, the greater the fluctuation of the data relative to the mean.
Taking the oltp_read_write scenario under 256 concurrent transactions as an example, we statistically analyze the TPS jitter of MGR_1 (RPO<>0) and DN (RPO=0) under the four deployment modes mentioned earlier.
The actual jitter chart and the actual jitter metric data for each scenario are as follows:
| CV | Same Data Center | Three Data Centers in the Same Region | Three Data Centers across Two Regions | Three Data Centers in Three Regions |
|---|---|---|---|---|
| MGR_1 | 10.04% | 8.96% | 6.02% | 8.63% |
| DN | 3.68% | 3.78% | 2.55% | 4.05% |
| MGR_1/DN | 272.83% | 237.04% | 236.08% | 213.09% |
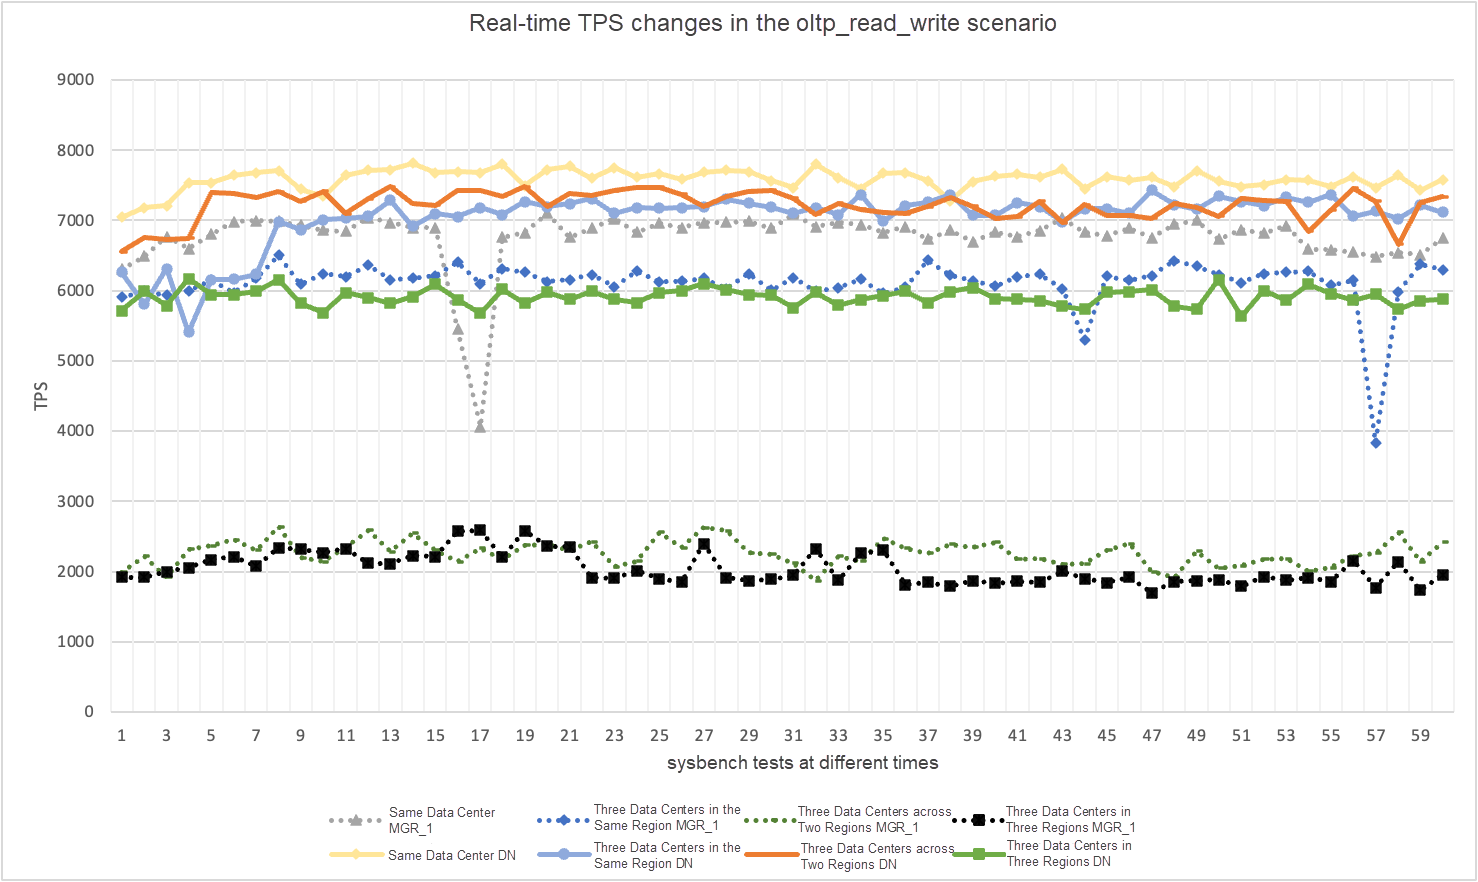
It can be seen from the test results that:
• TPS of MGR is unstable in the oltp_read_write scenario, and it plummets for no reason during runtime, which is found in tests in multiple deployment scenarios. In comparison, DN is very stable.
• In calculating the coefficient of variation, the CV of MGR is large at 6% to 10% and even reaches a maximum value of 10% when the latency in the same data center is the smallest, while the CV of DN is relatively stable with 2% to 4%. The performance stability of DN is basically twice that of MGR.
• This shows that the performance jitter of MGR_1 (RPO<>0) is relatively large.
The core feature of distributed databases is high availability. The failure of any node in the cluster does not affect the overall availability. For the typical deployment mode of three nodes, one primary and two secondary nodes, deployed in the same data center, we try to test the availability of the following scenarios:
• Interrupt the primary database and then restart it. Observe the RTO time for the cluster to recover availability during the process.
• Interrupt any secondary database and then restart it. Observe the availability of the primary database during the process.
In the case of no load, kill leader to monitor the status changes of each node in the cluster and whether it is writable.
| Procedure | MGR | DN |
|---|---|---|
| Start normally | 0 | 0 |
| kill leader | 0 | 0 |
| The time when an abnormal node is found | 5 seconds | 5 seconds |
| The time to reduce from 3 nodes to 2 nodes | 23 seconds | 8 seconds |
| Procedure | MGR | DN |
|---|---|---|
| Start normally | 0 | 0 |
| kill leader, automatically start | 0 | 0 |
| The time when an abnormal node is found | 5 seconds | 5 seconds |
| The time to reduce from 3 nodes to 2 nodes | 23 seconds | 8 seconds |
| The time to recover from 2 nodes to 3 nodes | 37 seconds | 15 seconds |
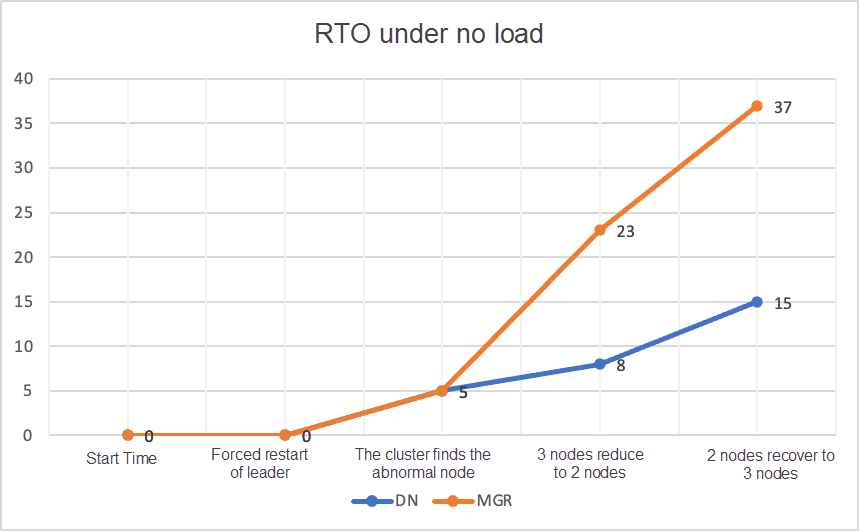
It can be seen from the test results that under the condition of no load:
• The RTO of DN is 8 to 15 seconds, which takes 8 seconds to reduce to 2 nodes and 15 seconds to recover to 3 nodes.
• The RTO of MGR is 23 to 37 seconds, which takes 23 seconds to reduce to 2 nodes and 37 seconds to recover to 3 nodes.
• For RTO performance, DN is better than MGR overall.
Use sysbench to perform stress testing of 16 concurrent threads in the oltp_read_write scenario. At the 10th second in the figure, manually kill a secondary node and observe the real-time TPS data output by sysbench.
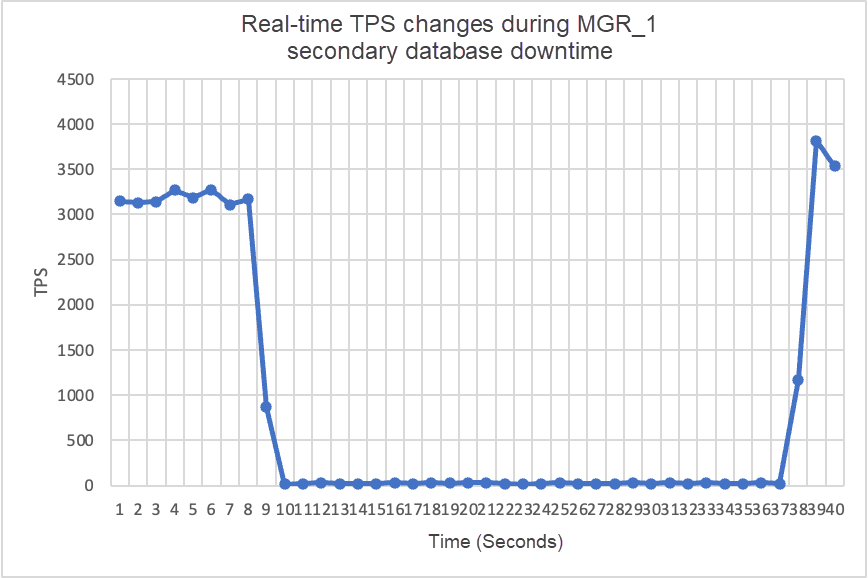
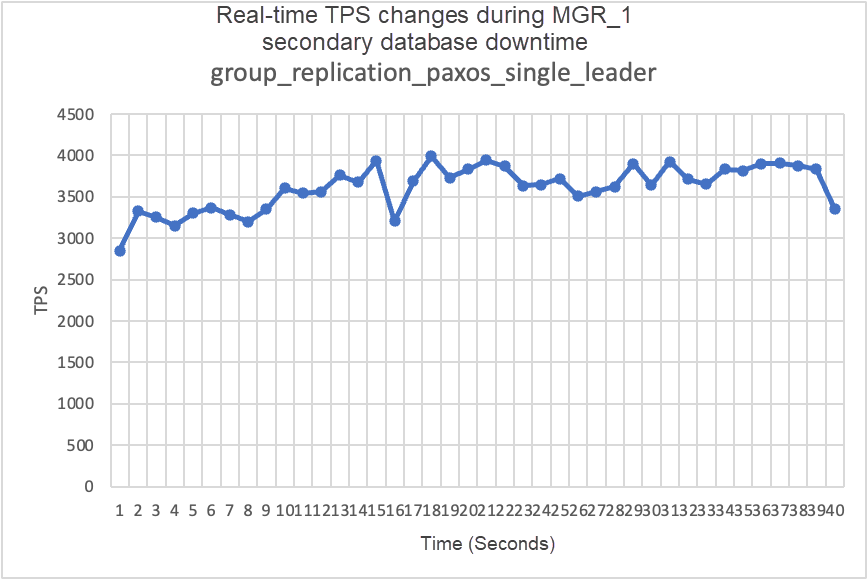
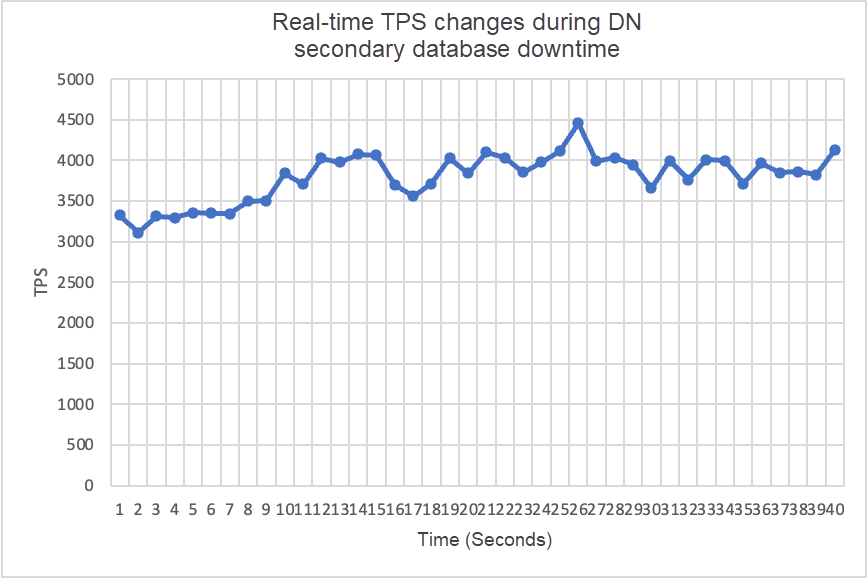
It can be seen from the test results chart that:
• After the secondary database is interrupted, the TPS of the MGR primary database decreases significantly, and it takes about 20 seconds to return to the normal level. According to the log analysis, there are two processes of detecting that the faulty node becomes unreachable and kicking the faulty node out of the MGR cluster. This test confirms a long-standing flaw in the MGR community: even if only one of the three nodes is unavailable, the entire cluster will experience severe jitter and become unavailable for a period of time.
• In response to the problem that the entire instance is unavailable when MGR has a single node failure in single-leader mode, the community introduced the MGR paxos single leader function in version 8.0.27 to solve it, but it is disabled by default. Here, we continue to verify after enabling group_replication_paxos_single_leader. After the secondary database is interrupted this time, the performance of the primary database remains stable and is even slightly improved. The reason may be related to the reduction of network load.
• For DN, after the secondary database is interrupted, the TPS of the primary database increases by about 20% immediately and then remains stable with the cluster remaining available. The reason why the performance here is opposite to that of MGR is that after interrupting one secondary database, the primary database only sends logs to the remaining secondary database each time, improving the efficiency of the network packet forwarding process.
Continuing the test, we restart the secondary database and observe the TPS data changes of the primary database:
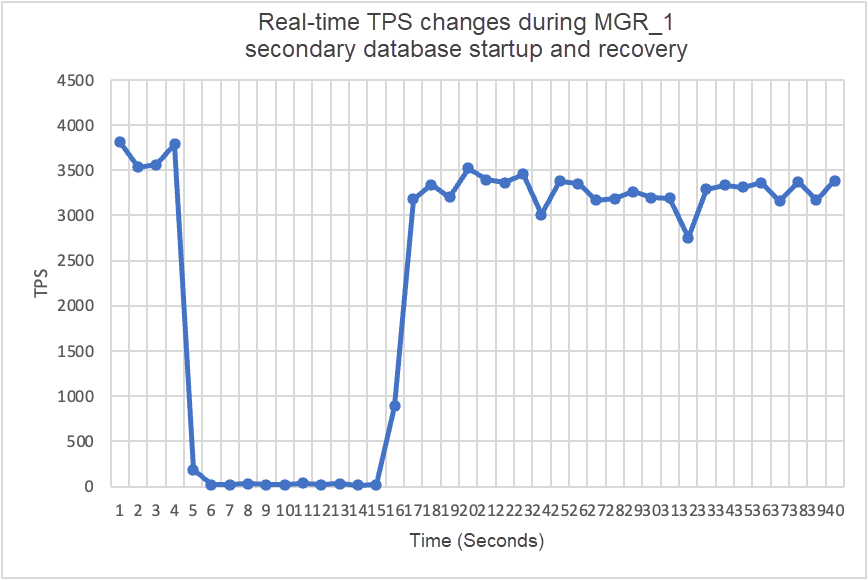
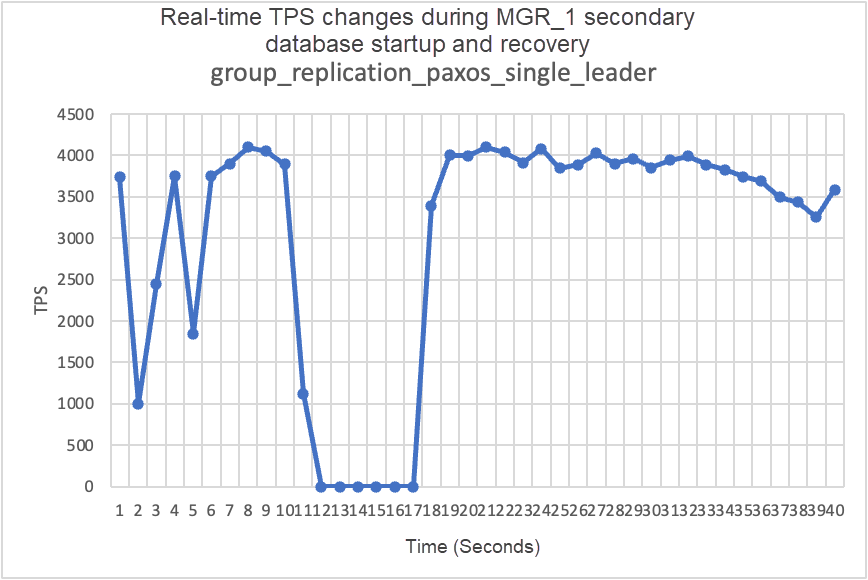
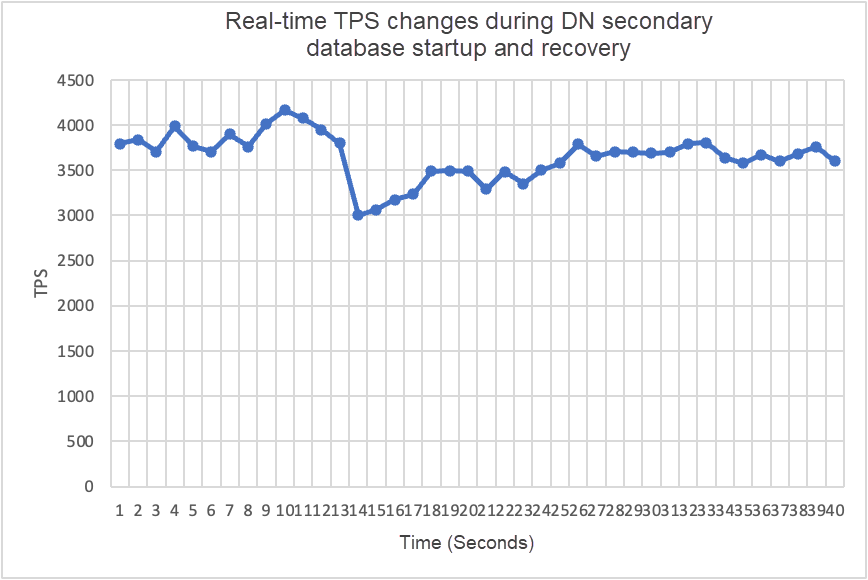
It can be seen from the test results chart that:
• MGR recovers from 2 nodes to 3 nodes at 5s, but the primary database is also unavailable for about 12 seconds. Although the secondary node eventually joins the cluster, the MEMBER_STATE remains RECOVERING, indicating that data is being read at this moment.
• The scenario where group_replication_paxos_single_leader is enabled is also verified for the restart of the secondary database. As a result, MGR recovers from 2 nodes to 3 nodes at 10s, but there is still an unavailable time lasting about 7 seconds. It seems that this parameter cannot completely solve the problem that the entire instance is unavailable when MGR has a single node failure in single-leader mode.
• For DN, the secondary database recovers from 2 nodes to 3 nodes at 10s with the primary database remaining available all the time. At this point, the TPS may fluctuate for a short period of time. This is because the log replication latency of the restarted secondary database lags behind a lot, and the lagging logs need to be pulled from the primary database, which has a slight impact on the primary database. After leveling the logs, the overall performance is stable.
To construct the scenario of MGR majority unavailable and RPO<>0, we use the MTR Case method provided by the community to conduct fault injection testing on MGR. The designed Case is as follows:
--echo
--echo ############################################################
--echo # 1. Deploy a 3 members group in single primary mode.
--source include/have_debug.inc
--source include/have_group_replication_plugin.inc
--let $group_replication_group_name= aaaaaaaa-aaaa-aaaa-aaaa-aaaaaaaaaaaa
--let $rpl_group_replication_single_primary_mode=1
--let $rpl_skip_group_replication_start= 1
--let $rpl_server_count= 3
--source include/group_replication.inc

--let $rpl_connection_name= server1
--source include/rpl_connection.inc
--let $server1_uuid= `SELECT @@server_uuid`
--source include/start_and_bootstrap_group_replication.inc

--let $rpl_connection_name= server2
--source include/rpl_connection.inc
--source include/start_group_replication.inc

--let $rpl_connection_name= server3
--source include/rpl_connection.inc
--source include/start_group_replication.inc

--echo
--echo ############################################################
--echo # 2. Init data
--let $rpl_connection_name = server1
--source include/rpl_connection.inc
CREATE TABLE t1 (c1 INT PRIMARY KEY);
INSERT INTO t1 VALUES(1);

--source include/rpl_sync.inc
SELECT * FROM t1;

--let $rpl_connection_name = server2
--source include/rpl_connection.inc
SELECT * FROM t1;

--let $rpl_connection_name = server3
--source include/rpl_connection.inc
SELECT * FROM t1;

--echo
--echo ############################################################
--echo # 3. Mock crash majority members

--echo # server 2 wait before write relay log
--let $rpl_connection_name = server2
--source include/rpl_connection.inc
SET GLOBAL debug = '+d,wait_in_the_middle_of_trx';

--echo # server 3 wait before write relay log
--let $rpl_connection_name = server3
--source include/rpl_connection.inc
SET GLOBAL debug = '+d,wait_in_the_middle_of_trx';


--echo # server 1 commit new transaction
--let $rpl_connection_name = server1
--source include/rpl_connection.inc
INSERT INTO t1 VALUES(2);
# server 1 commit t1(c1=2) record
SELECT * FROM t1;
select CHANNEL_NAME,MEMBER_HOST,MEMBER_PORT,MEMBER_STATE,MEMBER_ROLE,MEMBER_VERSION,MEMBER_COMMUNICATION_STACK from performance_schema.replication_group_members order by MEMBER_PORT;
--echo # server 1 crash
--source include/kill_mysqld.inc

--echo # sleep enough time for electing new leader
sleep 60;

--echo
--echo # server 3 check
--let $rpl_connection_name = server3
--source include/rpl_connection.inc
SELECT * FROM t1;
select CHANNEL_NAME,MEMBER_HOST,MEMBER_PORT,MEMBER_STATE,MEMBER_ROLE,MEMBER_VERSION,MEMBER_COMMUNICATION_STACK from performance_schema.replication_group_members order by MEMBER_PORT;
--echo # server 3 crash and restart
--source include/kill_and_restart_mysqld.inc

--echo # sleep enough time for electing new leader
sleep 60;

--echo
--echo # server 2 check
--let $rpl_connection_name = server2
--source include/rpl_connection.inc
SELECT * FROM t1;
select CHANNEL_NAME,MEMBER_HOST,MEMBER_PORT,MEMBER_STATE,MEMBER_ROLE,MEMBER_VERSION,MEMBER_COMMUNICATION_STACK from performance_schema.replication_group_members order by MEMBER_PORT;
--echo # server 2 crash and restart
--source include/kill_and_restart_mysqld.inc

--echo # sleep enough time for electing new leader
sleep 60;

--echo
--echo ############################################################
--echo # 4. Check alive members, lost t1(c1=2) record

--echo # server 3 check
--let $rpl_connection_name= server3
--source include/rpl_connection.inc
select CHANNEL_NAME,MEMBER_HOST,MEMBER_PORT,MEMBER_STATE,MEMBER_ROLE,MEMBER_VERSION,MEMBER_COMMUNICATION_STACK from performance_schema.replication_group_members order by MEMBER_PORT;
--echo # server 3 lost t1(c1=2) record
SELECT * FROM t1;

--echo
--echo # server 2 check
--let $rpl_connection_name = server2
--source include/rpl_connection.inc
select CHANNEL_NAME,MEMBER_HOST,MEMBER_PORT,MEMBER_STATE,MEMBER_ROLE,MEMBER_VERSION,MEMBER_COMMUNICATION_STACK from performance_schema.replication_group_members order by MEMBER_PORT;
--echo # server 2 lost t1(c1=2) record
SELECT * FROM t1;
!include ../my.cnf
[mysqld.1]
loose-group_replication_member_weight=100
[mysqld.2]
loose-group_replication_member_weight=90
[mysqld.3]
loose-group_replication_member_weight=80
[ENV]
SERVER_MYPORT_3= @mysqld.3.port
SERVER_MYSOCK_3= @mysqld.3.socketThe running results of the Case operation are as follows:
############################################################
# 1. Deploy a 3 members group in single primary mode.
include/group_replication.inc [rpl_server_count=3]
Warnings:
Note    ####    Sending passwords in plain text without SSL/TLS is extremely insecure.
Note    ####    Storing MySQL user name or password information in the master info repository is not secure and is therefore not recommended. Please consider using the USER and PASSWORD connection options for START SLAVE; see the 'START SLAVE Syntax' in the MySQL Manual for more information.
[connection server1]
[connection server1]
include/start_and_bootstrap_group_replication.inc
[connection server2]
include/start_group_replication.inc
[connection server3]
include/start_group_replication.inc

############################################################
# 2. Init data
[connection server1]
CREATE TABLE t1 (c1 INT PRIMARY KEY);
INSERT INTO t1 VALUES(1);
include/rpl_sync.inc
SELECT * FROM t1;
c1
1
[connection server2]
SELECT * FROM t1;
c1
1
[connection server3]
SELECT * FROM t1;
c1
1

############################################################
# 3. Mock crash majority members
# server 2 wait before write relay log
[connection server2]
SET GLOBAL debug = '+d,wait_in_the_middle_of_trx';
# server 3 wait before write relay log
[connection server3]
SET GLOBAL debug = '+d,wait_in_the_middle_of_trx';
# server 1 commit new transaction
[connection server1]
INSERT INTO t1 VALUES(2);
SELECT * FROM t1;
c1
1
2
select CHANNEL_NAME,MEMBER_HOST,MEMBER_PORT,MEMBER_STATE,MEMBER_ROLE,MEMBER_VERSION,MEMBER_COMMUNICATION_STACK from performance_schema.replication_group_members order by MEMBER_PORT;
CHANNEL_NAME    MEMBER_HOST    MEMBER_PORT    MEMBER_STATE    MEMBER_ROLE    MEMBER_VERSION    MEMBER_COMMUNICATION_STACK
group_replication_applier    127.0.0.1    13000    ONLINE    PRIMARY    8.0.32    XCom
group_replication_applier    127.0.0.1    13002    ONLINE    SECONDARY    8.0.32    XCom
group_replication_applier    127.0.0.1    13004    ONLINE    SECONDARY    8.0.32    XCom
# server 1 crash
# Kill the server
# sleep enough time for electing new leader

# server 3 check
[connection server3]
SELECT * FROM t1;
c1
1
select CHANNEL_NAME,MEMBER_HOST,MEMBER_PORT,MEMBER_STATE,MEMBER_ROLE,MEMBER_VERSION,MEMBER_COMMUNICATION_STACK from performance_schema.replication_group_members order by MEMBER_PORT;
CHANNEL_NAME    MEMBER_HOST    MEMBER_PORT    MEMBER_STATE    MEMBER_ROLE    MEMBER_VERSION    MEMBER_COMMUNICATION_STACK
group_replication_applier    127.0.0.1    13002    ONLINE    PRIMARY    8.0.32    XCom
group_replication_applier    127.0.0.1    13004    ONLINE    SECONDARY    8.0.32    XCom
# server 3 crash and restart
# Kill and restart
# sleep enough time for electing new leader

# server 2 check
[connection server2]
SELECT * FROM t1;
c1
1
select CHANNEL_NAME,MEMBER_HOST,MEMBER_PORT,MEMBER_STATE,MEMBER_ROLE,MEMBER_VERSION,MEMBER_COMMUNICATION_STACK from performance_schema.replication_group_members order by MEMBER_PORT;
CHANNEL_NAME    MEMBER_HOST    MEMBER_PORT    MEMBER_STATE    MEMBER_ROLE    MEMBER_VERSION    MEMBER_COMMUNICATION_STACK
group_replication_applier    127.0.0.1    13002    ONLINE    PRIMARY    8.0.32    XCom
group_replication_applier    127.0.0.1    13004    UNREACHABLE    SECONDARY    8.0.32    XCom
# server 2 crash and restart
# Kill and restart
# sleep enough time for electing new leader

############################################################
# 4. Check alive members, lost t1(c1=2) record
# server 3 check
[connection server3]
select CHANNEL_NAME,MEMBER_HOST,MEMBER_PORT,MEMBER_STATE,MEMBER_ROLE,MEMBER_VERSION,MEMBER_COMMUNICATION_STACK from performance_schema.replication_group_members order by MEMBER_PORT;
CHANNEL_NAME    MEMBER_HOST    MEMBER_PORT    MEMBER_STATE    MEMBER_ROLE    MEMBER_VERSION    MEMBER_COMMUNICATION_STACK
group_replication_applier        NULL    OFFLINE
# server 3 lost t1(c1=2) record
SELECT * FROM t1;
c1
1

# server 2 check
[connection server2]
select CHANNEL_NAME,MEMBER_HOST,MEMBER_PORT,MEMBER_STATE,MEMBER_ROLE,MEMBER_VERSION,MEMBER_COMMUNICATION_STACK from performance_schema.replication_group_members order by MEMBER_PORT;
CHANNEL_NAME    MEMBER_HOST    MEMBER_PORT    MEMBER_STATE    MEMBER_ROLE    MEMBER_VERSION    MEMBER_COMMUNICATION_STACK
group_replication_applier        NULL    OFFLINE
# server 2 lost t1(c1=2) record
SELECT * FROM t1;
c1
1
The general logic of Case to reproduce the data loss is as follows:
According to the above Case, for MGR, when the majority of the servers are down and the primary database is unavailable, after the secondary database is recovered, there exists RPO<>0 for data loss, and the original record of commit success that was returned to the client is lost.
For DN, the achievement of the majority requires the persistence of logs in the majority, so even in the above scenario, data will not be lost and RPO=0 can be guaranteed.
In the traditional primary/secondary mode of MySQL, the secondary database generally contains I/O and Apply threads. After introducing the Paxos protocol to replace I/O threads for synchronizing the binlog of the primary and secondary databases, the replication latency of the secondary database mainly depends on the overhead of the secondary database Applying replay, which is called the replay latency of the secondary database.
We use sysbench to test the oltp_write_only scenario and test the duration of the replay latency of the secondary database with different numbers of events under 100 concurrent transactions. The duration of the replay latency of the secondary database is determined by monitoring the APPLYING_TRANSACTION_ORIGINAL_COMMIT_TIMESTAMP column of the performance_schema.replication_applier_status_by_worker table to check in real time whether each worker is working and whether replication is complete.
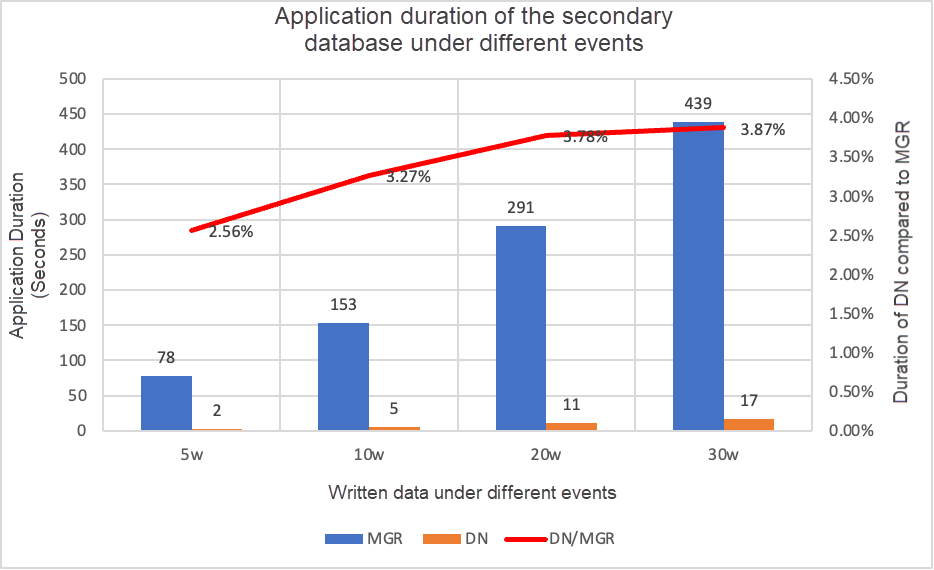
It can be seen from the test results chart that:
• With the same amount of written data, the time it takes for the DN secondary database to replay all logs is much shorter than that for MGR, and the duration of DN is only 3% to 4% of that of MGR. This is critical to the timely switchover of the primary and secondary databases.
• As the number of written data increases, the latency advantage of DN over MGR continues to be maintained stable.
• Analyzing the cause of the replay latency of the secondary database, the strategy of MGR adopts group_replication_consistency with the default value of EVENTUAL, that is, neither RO nor RW transactions wait for the previous transaction to be applied before execution. It ensures that the write performance of the primary database is maximized, but the latency of the secondary database will be relatively high (by sacrificing the latency of the secondary database and RPO=0 to achieve high-performance writes of the primary database, enabling the throttling function of MGR can balance the performance and the latency of the secondary database, but the performance of the primary database will be compromised).
|
Major Items |
Sub-item |
MySQL MGR |
PolarDB-X DN |
|
Performance |
Read Transactions |
Same |
Same |
|
|
Write Transactions |
Performance is not as good as that of DN when RPO<>0Performance is far worse than that of DN when RPO=0The performance of cross-region deployment significantly decreases by 27% to 82% |
The performance of write transactions is much higher than that of MGRThe performance of cross-region deployment slightly decreases by 4% to 37% |
|
|
Jitter |
The performance jitter is severe with a jitter range of 6% to 10% |
It is relatively stable at 3%, only half of MGR |
|
RTO |
Primary Database Downtime |
find the abnormal node in 5 seconds, reduce to two nodes in 23 seconds |
find the abnormal node in 5 seconds, reduce to two nodes in 8 seconds |
|
|
Primary Database Restart |
find the abnormal node in 5 seconds, recover to three nodes in 37 seconds |
find the abnormal node in 5 seconds, recover to three nodes in 15 seconds |
|
|
Secondary Database Downtime |
The traffic in the primary database drops to 0 for 20 seconds, which needs group_replication_paxos_single_leader explicitly enabled to alleviate |
Continuous high availability of the primary database |
|
|
Secondary Database Restart |
The traffic in the primary database drops to 0 for 10 seconds and it is ineffective to explicitly enable group_replication_paxos_single_leader |
Continuous high availability of the primary database |
|
RPO |
Case Reproduction |
RPO<>0 during majority downtimePerformance and RPO=0 cannot be achieved at the same ti |
RPO = 0 |
|
Secondary Database Latency |
The Replay Duration of the Secondary Database |
Large primary/secondary latencyPerformance and primary/secondary latency cannot be achieved at the same time |
The total replay duration of the secondary database is 4% of that of MGR, which is 25 times that of MGR |
PolarDB-X adopts the default configuration without the need for a professionally customized configuration.
MySQL MGR involves multiple professional parameters in this article, which are explained here:
• group_replication_flow_control_mode: flow control is enabled by default and needs to be disabled to improve performance.
• replication_optimize_for_static_plugin_config: optimization for the static plug-in is disabled by default and needs to be enabled to improve performance.
• group_replication_paxos_single_leader: it is disabled by default and needs to be enabled to improve the stability of the primary database during the secondary database downtime.
• group_replication_consistency: it is disabled by default and RPO=0 is not guaranteed. To force RPO=0, you need to configure AFTER.
• group_replication_transaction_size_limit: the default size is 143M, which needs to be raised when large-scale transactions occur.
• binlog_transaction_dependency_tracking: the default value is COMMIT_ORDER and needs to be adjusted to WRITESET to improve the replay performance of the secondary database during MGR.
After in-depth technical analysis and performance comparison, PolarDB-X DN demonstrates multiple advantages over MySQL MGR in terms of performance, correctness, availability, and resource overhead by virtue of its self-developed X-Paxos protocol and a series of optimized designs. Although MGR also occupies an important position in the MySQL ecosystem, it is necessary to consider various situations such as downtime jitter of the secondary database, disaster recovery performance fluctuation across data centers, and stability. Therefore, to make good use of MGR, it must be equipped with the support of professional technology and O&M teams.
In the face of large-scale, high-concurrency, and high-availability requirements, the PolarDB-X storage engine has unique technical advantages and excellent performance. Compared with MGR in out-of-the-box scenarios, the PolarDB-X DN-based centralized (Standard Edition) achieves a good balance between functionality and performance, becoming a highly competitive database solution.
GanosBase H3 Geospatial Grid Capabilities and Best Practices
Alibaba Cloud DTS Experience Sharing Series | Guide to Accelerating Full Data Migration
ApsaraDB - November 12, 2024
Alibaba Clouder - March 16, 2017
ApsaraDB - March 27, 2024
ApsaraDB - June 19, 2024
ApsaraDB - June 19, 2024
ApsaraDB - January 3, 2024
 PolarDB for MySQL
Alibaba Cloud PolarDB for MySQL is a cloud-native relational database service 100% compatible with MySQL.
Learn More AnalyticDB for MySQL
AnalyticDB for MySQL is a real-time data warehousing service that can process petabytes of data with high concurrency and low latency.
Learn More PolarDB for PostgreSQL
Alibaba Cloud PolarDB for PostgreSQL is an in-house relational database service 100% compatible with PostgreSQL and highly compatible with the Oracle syntax.
Learn More PolarDB for Xscale
Alibaba Cloud PolarDB for Xscale (PolarDB-X) is a cloud-native high-performance distributed database service independently developed by Alibaba Cloud.
Learn MoreMore Posts by ApsaraDB