By Hao Chendong, Alibaba Cloud Technical Expert
Contributed by Alibaba Cloud ECS
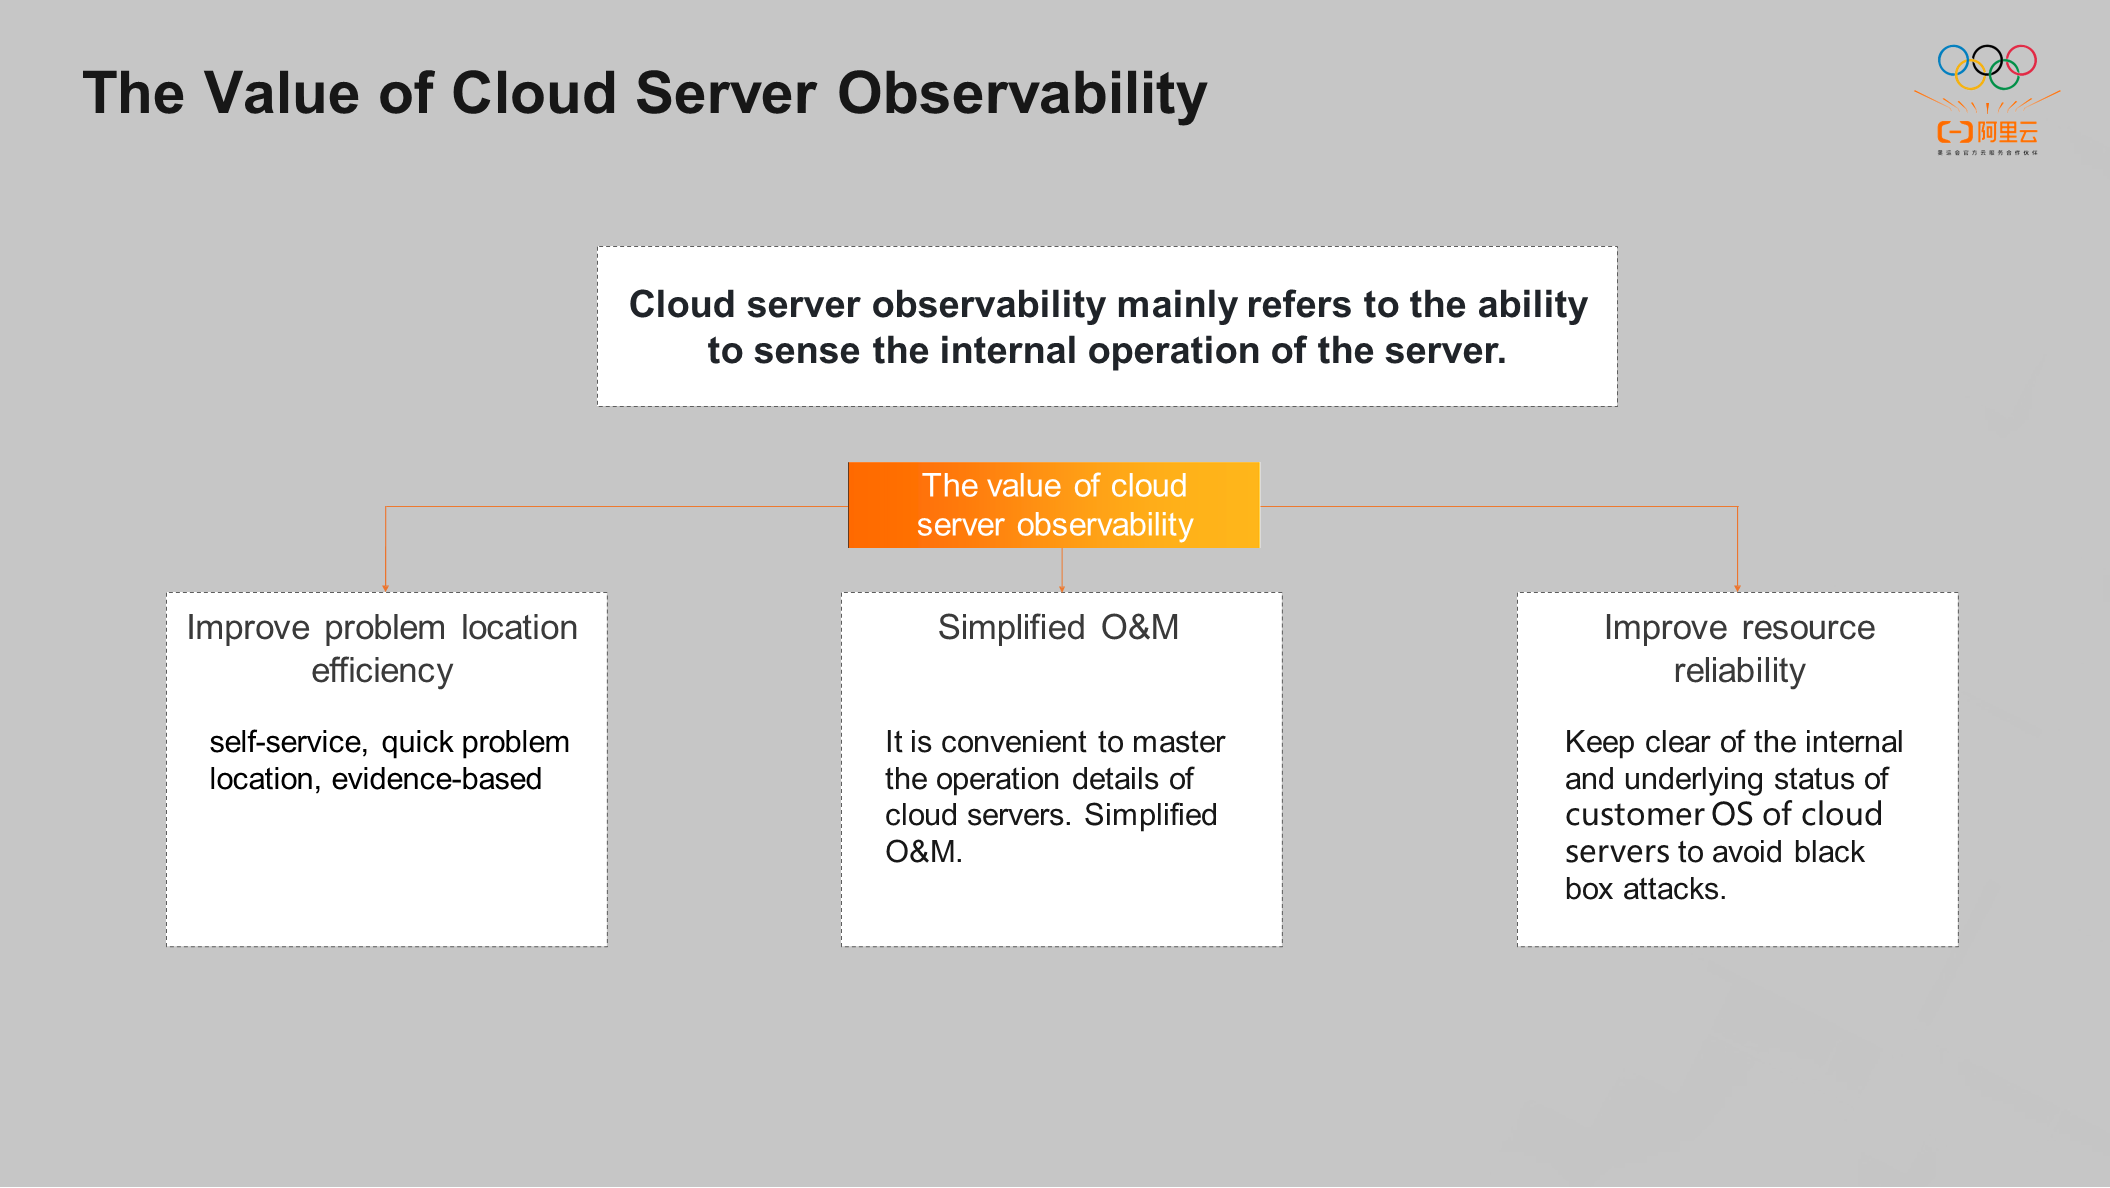
Cloud server observability refers to the ability of customers to perceive the internal running status of servers to ensure the reliability of cloud resources. Compared with traditional IT O&M, some changes have taken place in the usage and O&M methods of cloud-based IT. For example, customers will purchase computer rooms and machines and operate hardware resources in traditional IT operation and maintenance scenarios. After cloud migration, customers use OpenAPI to operate various computing resources. At the same time, the business scale is limited by data centers or physical machines in traditional scenarios. Thanks to the elasticity of the cloud, customers can easily expand the business scale to hundreds or thousands of servers.
O&M after cloud migration is more challenging, which requires the observability of cloud servers.
The value of cloud server observability mainly includes the following three points:
① Improve the Efficiency of Problem Location: Quickly locate problems through self-service, which can be based on evidence
② Simplify operation and maintenance to facilitate mastering the operation details of cloud servers
③ Improve resource reliability, timely grasp the internal and underlying status of customer OS of cloud servers, and avoid black box attacks
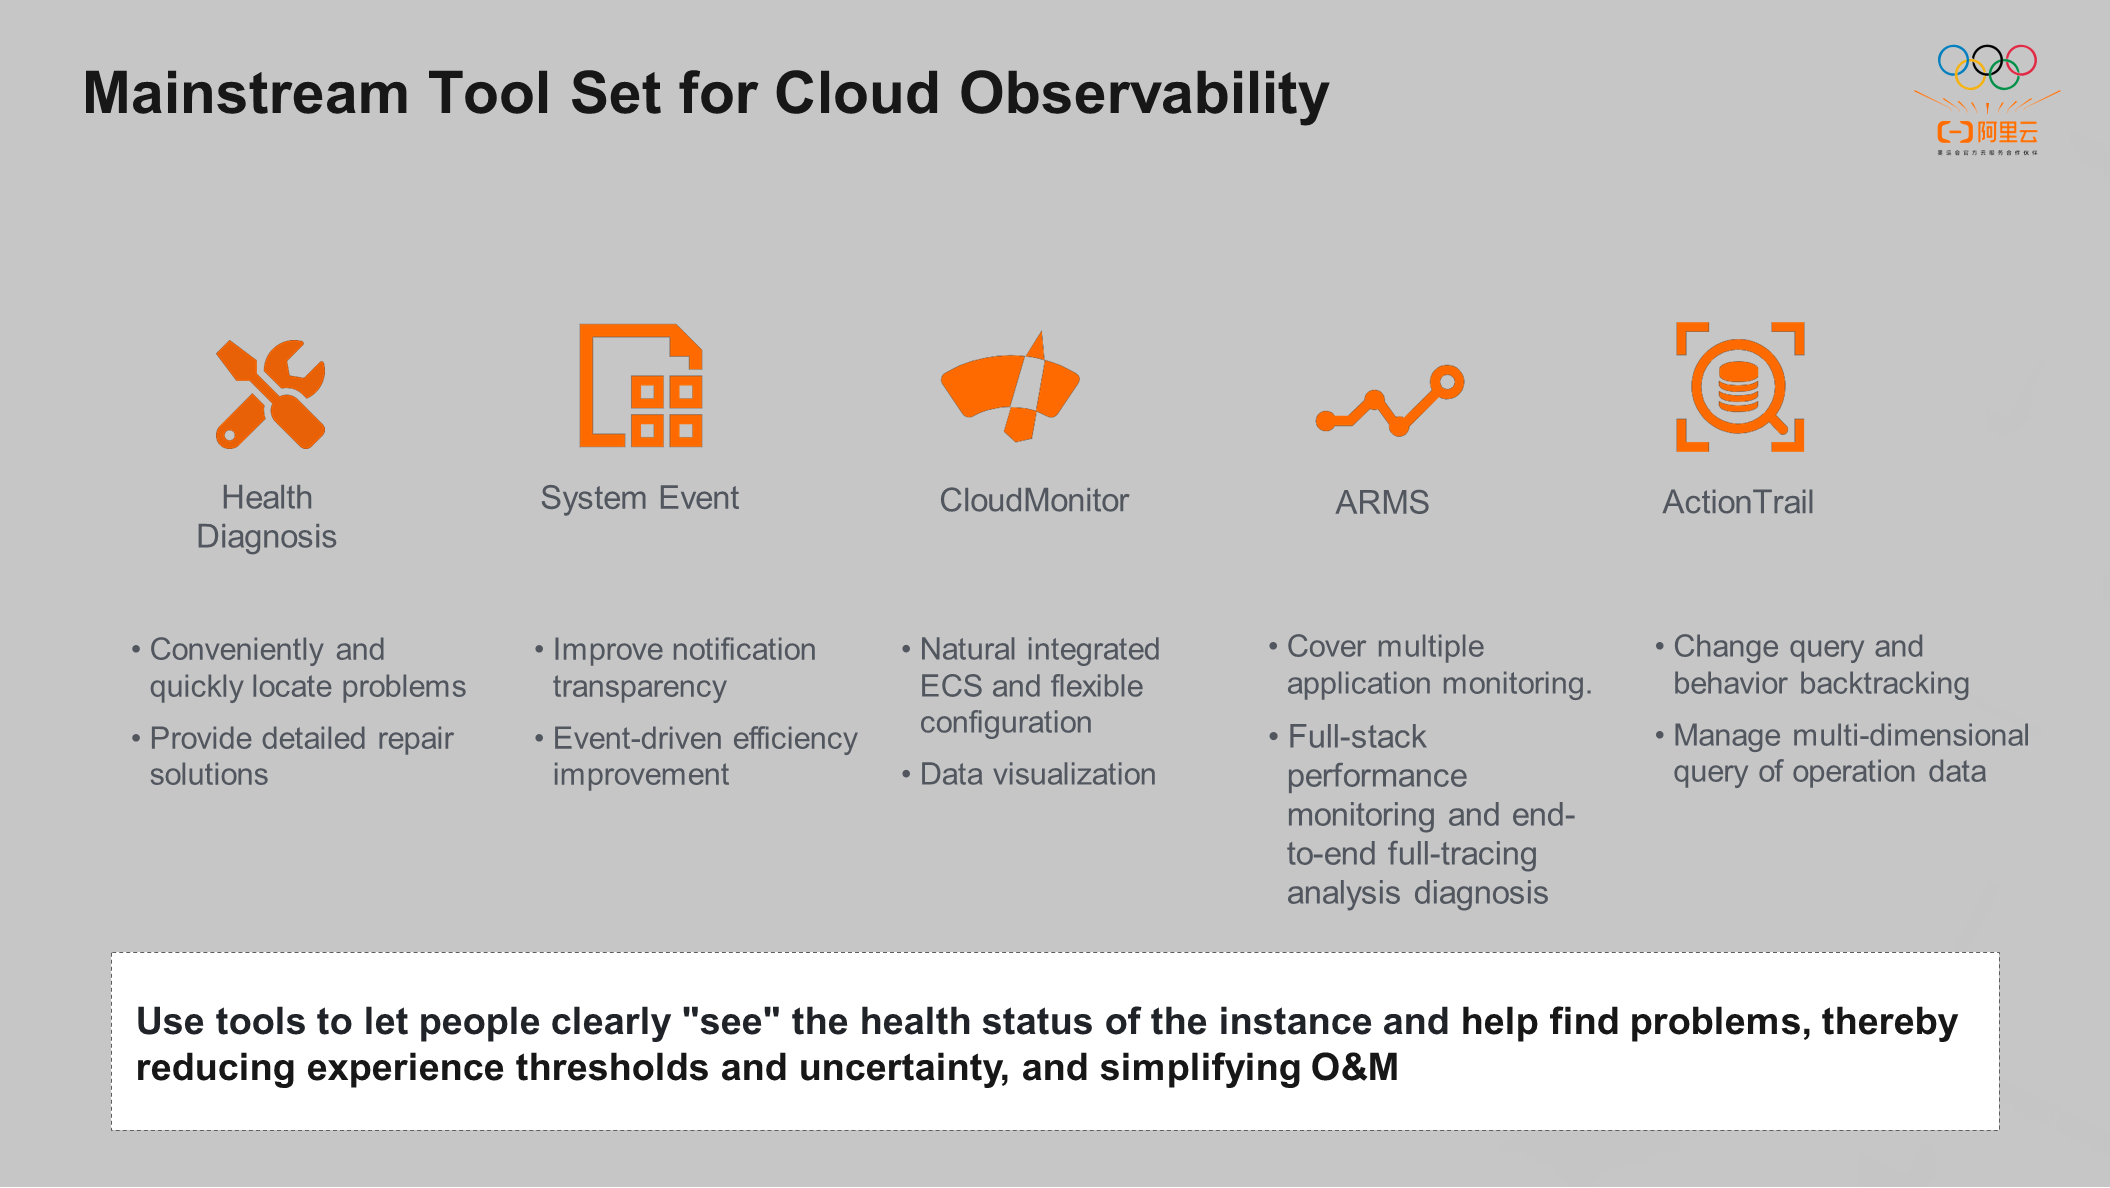
Alibaba Cloud provides many mainstream tool sets to improve the observability of cloud servers, including Health Diagnosis, System Event, CloudMonitor, ARMS, and ActionTrail. These tools are designed with different philosophies, but both aim to make customers aware of the health status of the current instance, help find problems quickly, and reduce O&M costs.
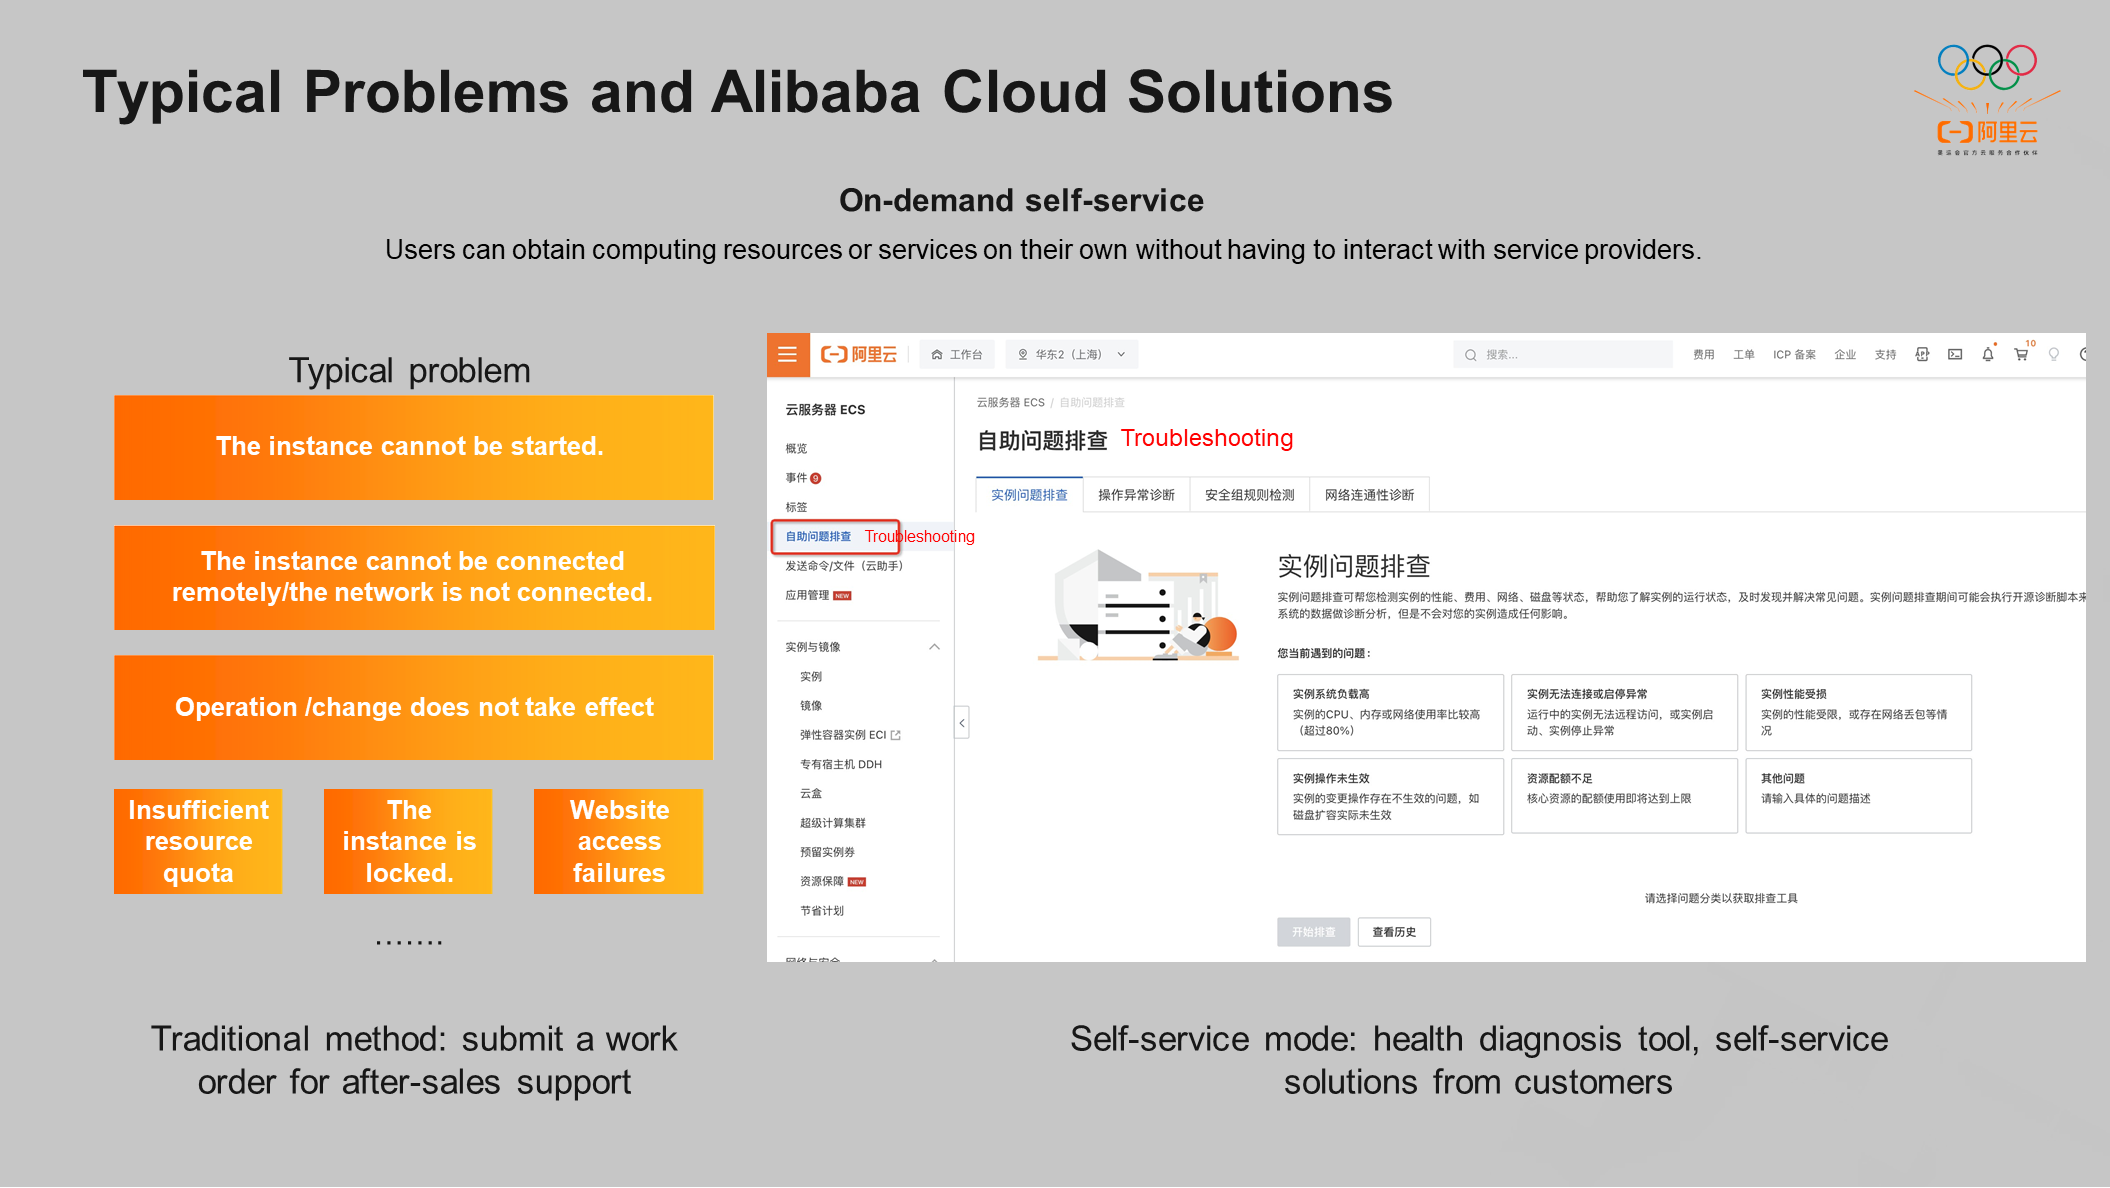
Self-service tool on-demand self-service means users can obtain computing resources or services by themselves without dealing with service providers.
Typical problems that customers often face on the cloud include instances that cannot be started, instances that cannot be connected, and operations that do not take effect. Customers can only submit work orders for after-sales support in traditional scenarios. The speed of problem resolution depends on the customer service staff's understanding of the problem or the response efficiency.
In the self-service scenario, we put all typical problems initiated by customers into the health diagnosis tool set. Customers can initiate diagnosis and solve problems by themselves on the console, and the problem can be located in minutes.
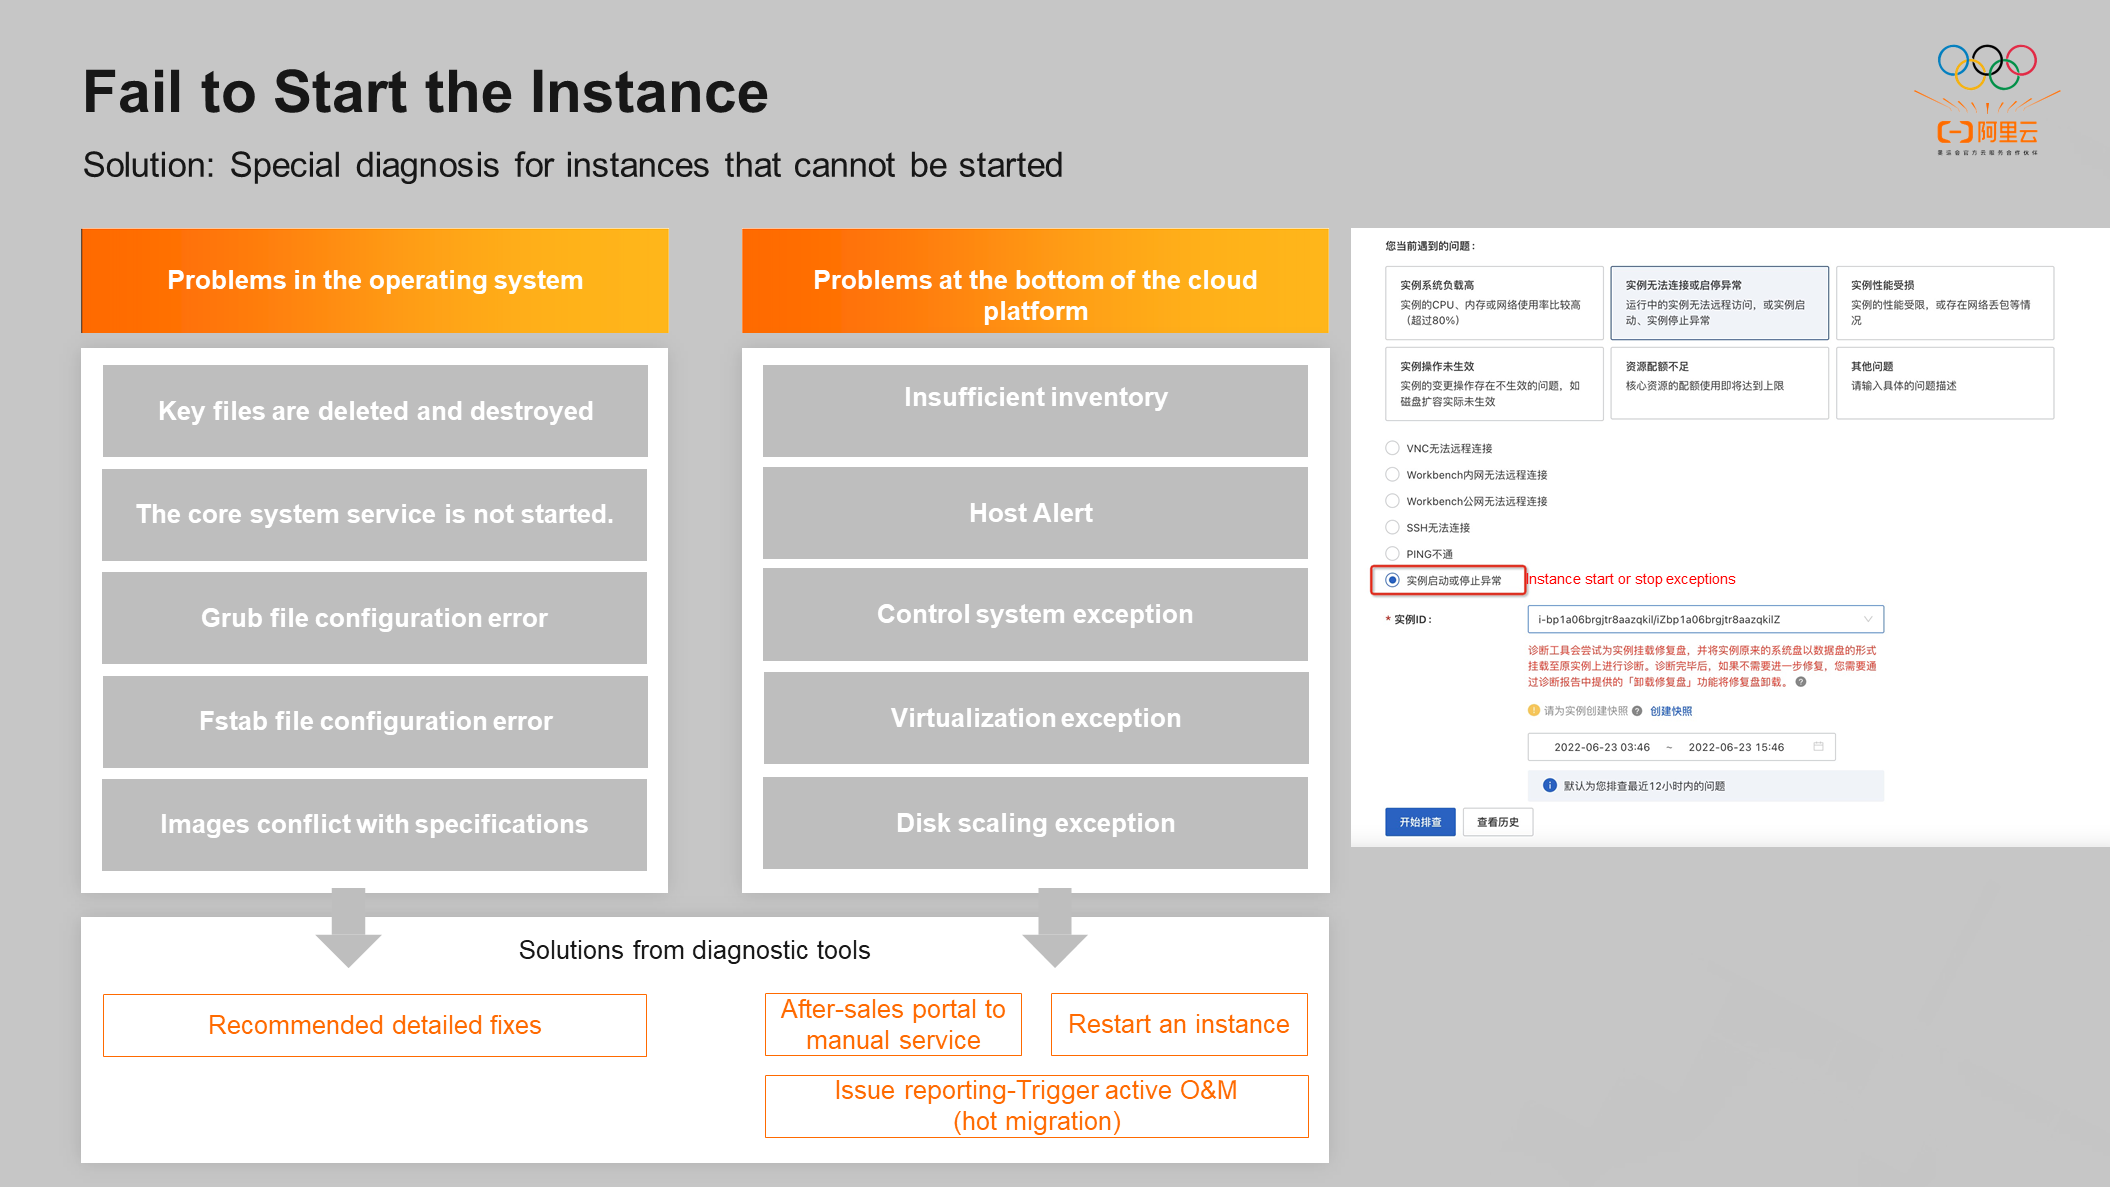
Instances cannot be started for two reasons:
The first reason is the problems in the operating system, such as viruses in the customer's operating system. Some key files are destroyed or deleted. Some core system services of the operating system are not started due to the wrong operation of the customer. The Fstab file is incorrectly configured. It may also be caused by conflicts between images and specifications. The health guide tool can quickly locate the problem in the operating system and push the corresponding repair solution to the customer.
The second reason is the underlying problems of the cloud platform, which are relatively rare, mainly including insufficient inventory, host alarm, abnormal control system, abnormal virtualization, and abnormal disk scaling. In response to such problems, the diagnostic tool will push the manual service to the customer through the portal. At the same time, the problem reporting portal will be pushed to the customer for some serious errors. If the Operation and Maintenance Team confirms that the problem reported by the customer is very serious, the operation and maintenance actions will be actively triggered, and the steps will be completely transparent to the customer.
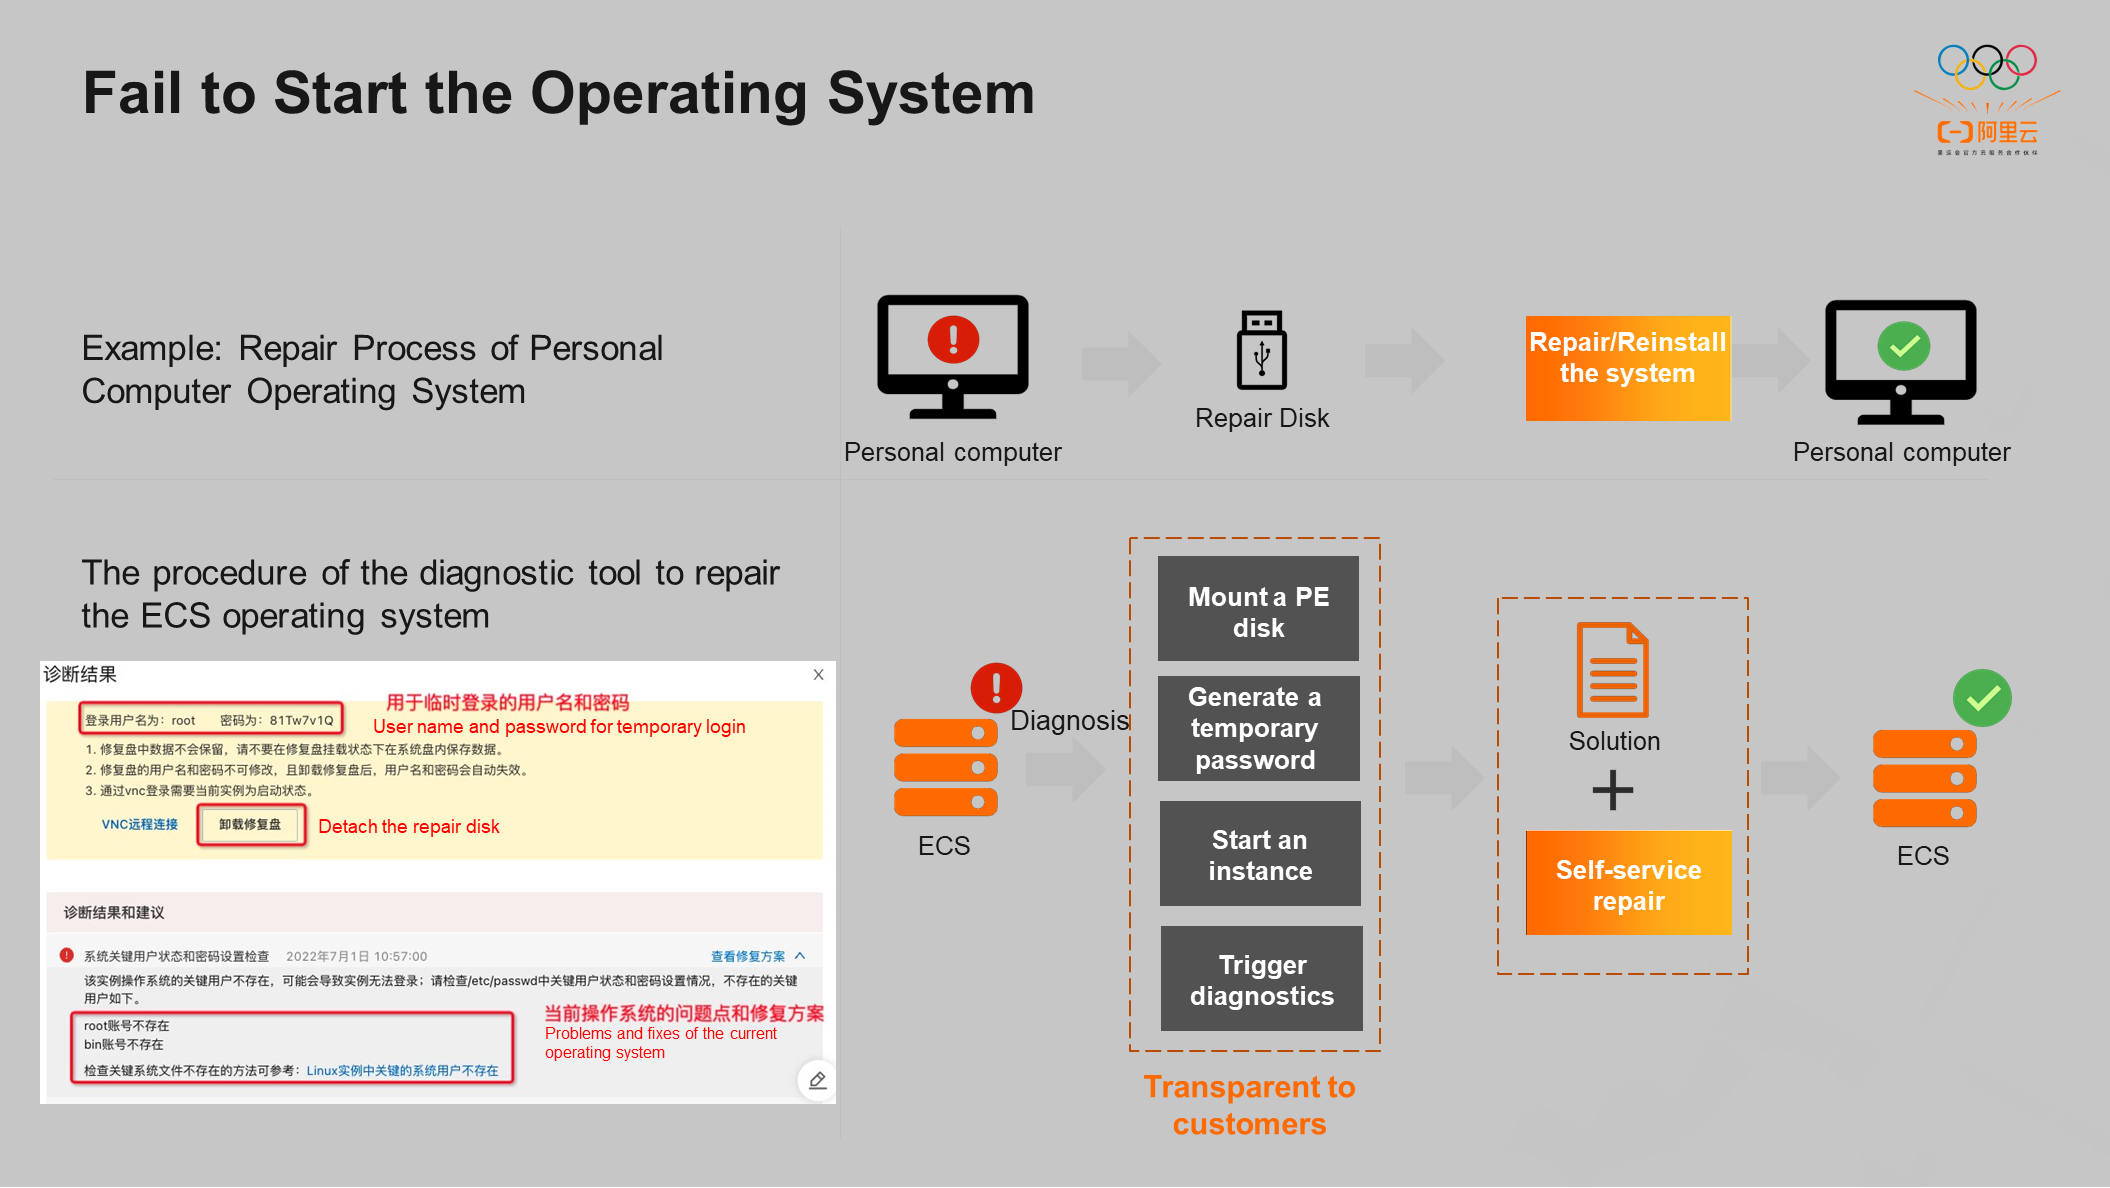
If an instance cannot be started, how can Alibaba Cloud diagnostic tools detect the internal operating system of the instance?
Let's take the personal computer operating system as an example. After the personal computer breaks down, the U disk is usually used as the repair disk, which is adjusted during startup. The U disk is started to reinstall or repair the system. Finally, the repair disk is uninstalled, and the computer can start normally.
The diagnostic tool works similarly, as shown in the bottom left of the preceding figure. If the operating system of the customer fails to start, the diagnostic tool mounts a repair disk for the customer and generates a temporary password to log into the repair disk. After the repair disk is mounted, the instance is automatically started for the customer. The original system disk is hung under the current instance as a data disk, and real-time detection is performed. If a problem is found, a specific repair solution is recommended to the customer. The customer can solve the problem according to the repair solution. After the problems in the original system disk are solved, the repair disk is uninstalled, and the operating system can start normally. The whole process is completely transparent to customers.
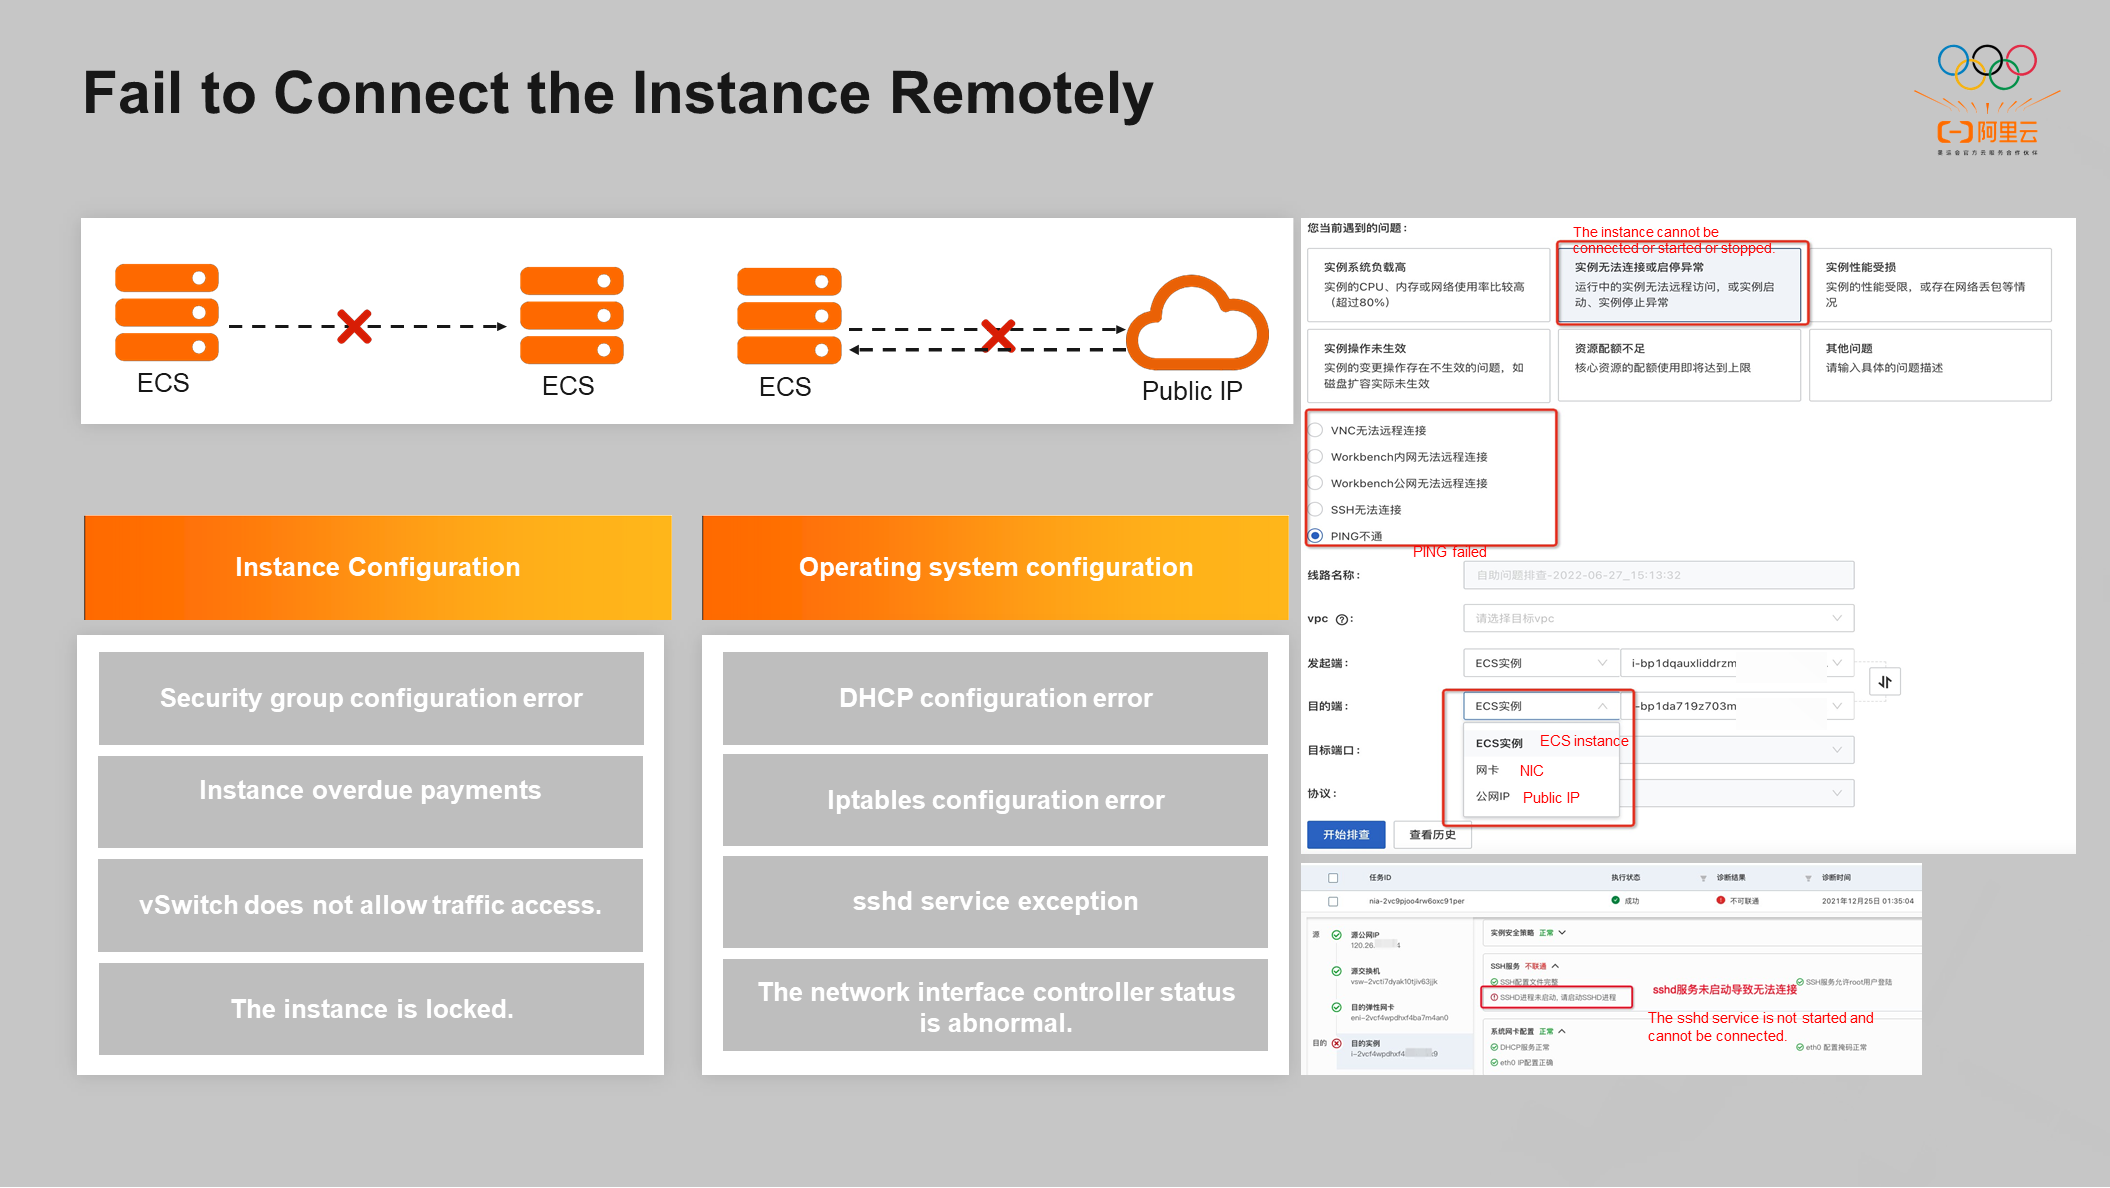
The main reason why the instance cannot be remotely connected is because the two ECS servers cannot be connected, and the ECS instance cannot be connected to the public IP address. The diagnostic tool supports three types of input. ECS Instance, network interface controller, or Public IP Address can be selected.
The diagnostic tool lists the critical paths between the initiator and the target, such as the instance account status, the instance operating system, and the switch where the current instance is located. The diagnostic tool checks whether each critical path is connected and finally draws a conclusion.
Critical paths can be divided into two categories: instance configuration and operating system configuration. The instance configuration class includes instance overdue payment, vSwitch does not allow traffic access, and the instance is locked. Open-source diagnosis commands are delivered in the operating system configuration in real-time with the help of Cloud Assistant. If problems are found in the operating system, users will be informed of the repair solution. The network connectivity diagnostic report displays the critical paths that cannot be connected and their causes.
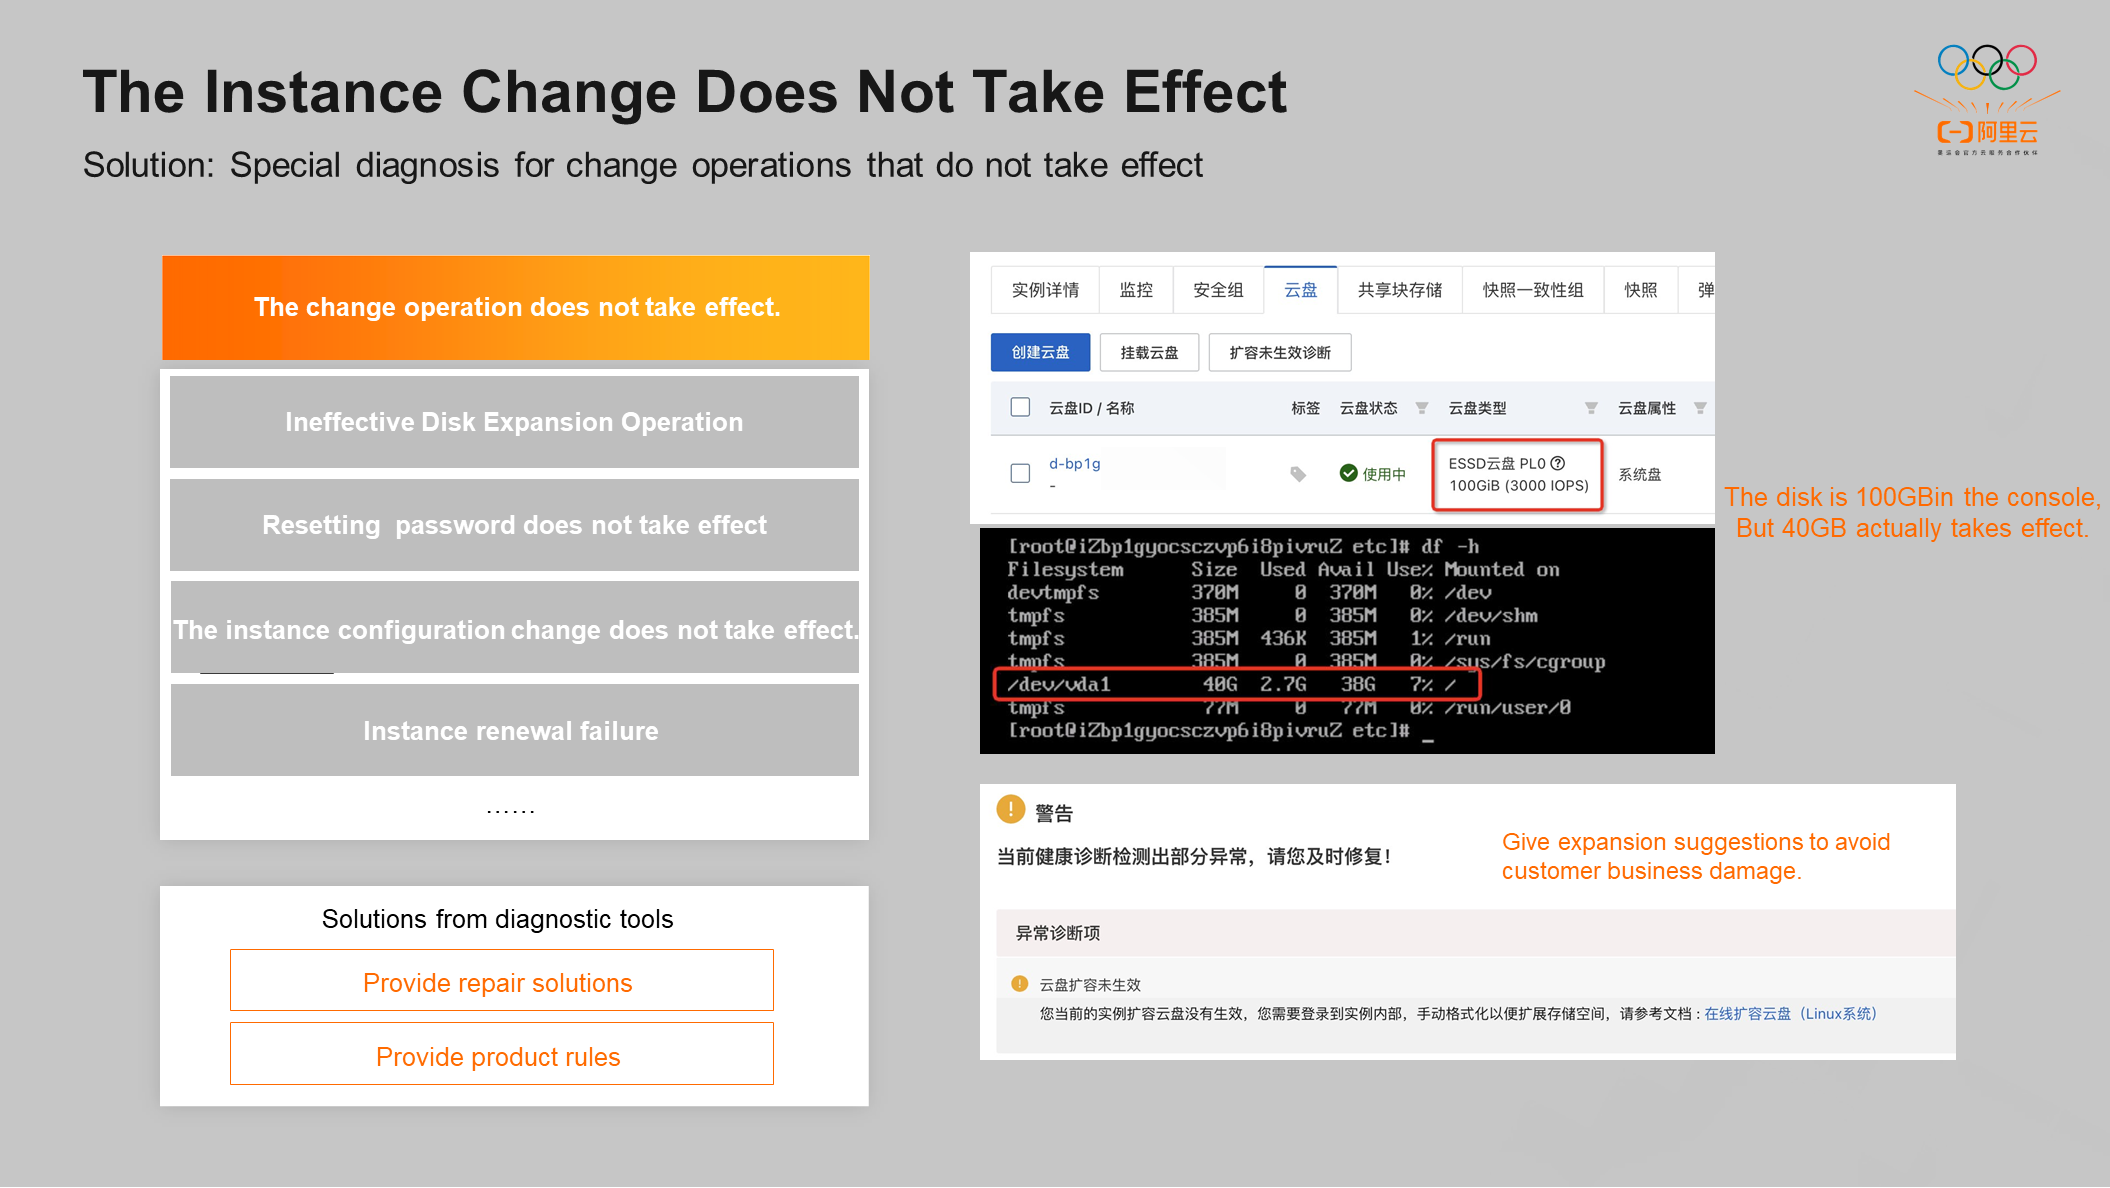
The instance change operation does not take effect, which means the customer has made some changes in the console, but the results are not as expected. This kind of problem is difficult to solve because there are many changes and reasons why the operation does not take effect. Currently, the self-service diagnostic tool supports the following diagnostic capabilities: disk expansion does not take effect, password reset does not take effect, instance configuration change does not take effect, and instance renewal fails.
For example, if the capacity of a customer cloud disk exceeds the original capacity, it is expanded from 40 GB to 100 GB in the console. The capacity of a customer cloud disk has been displayed as 100 GB in the console. However, customers still need to enter the OS to make some expansion commands take effect. Otherwise, business damage will occur. The diagnostic tool provides special diagnostics for disk expansion. If the diagnostic tool finds that the actual disk size of a customer is inconsistent with the size of the disk expansion, it will send suggestions to the user to avoid damage to the customer's business.
Another type of instance change operation does not take effect because the customer is not familiar with the product rules. The diagnostic tool will push the current product rules to the customer.
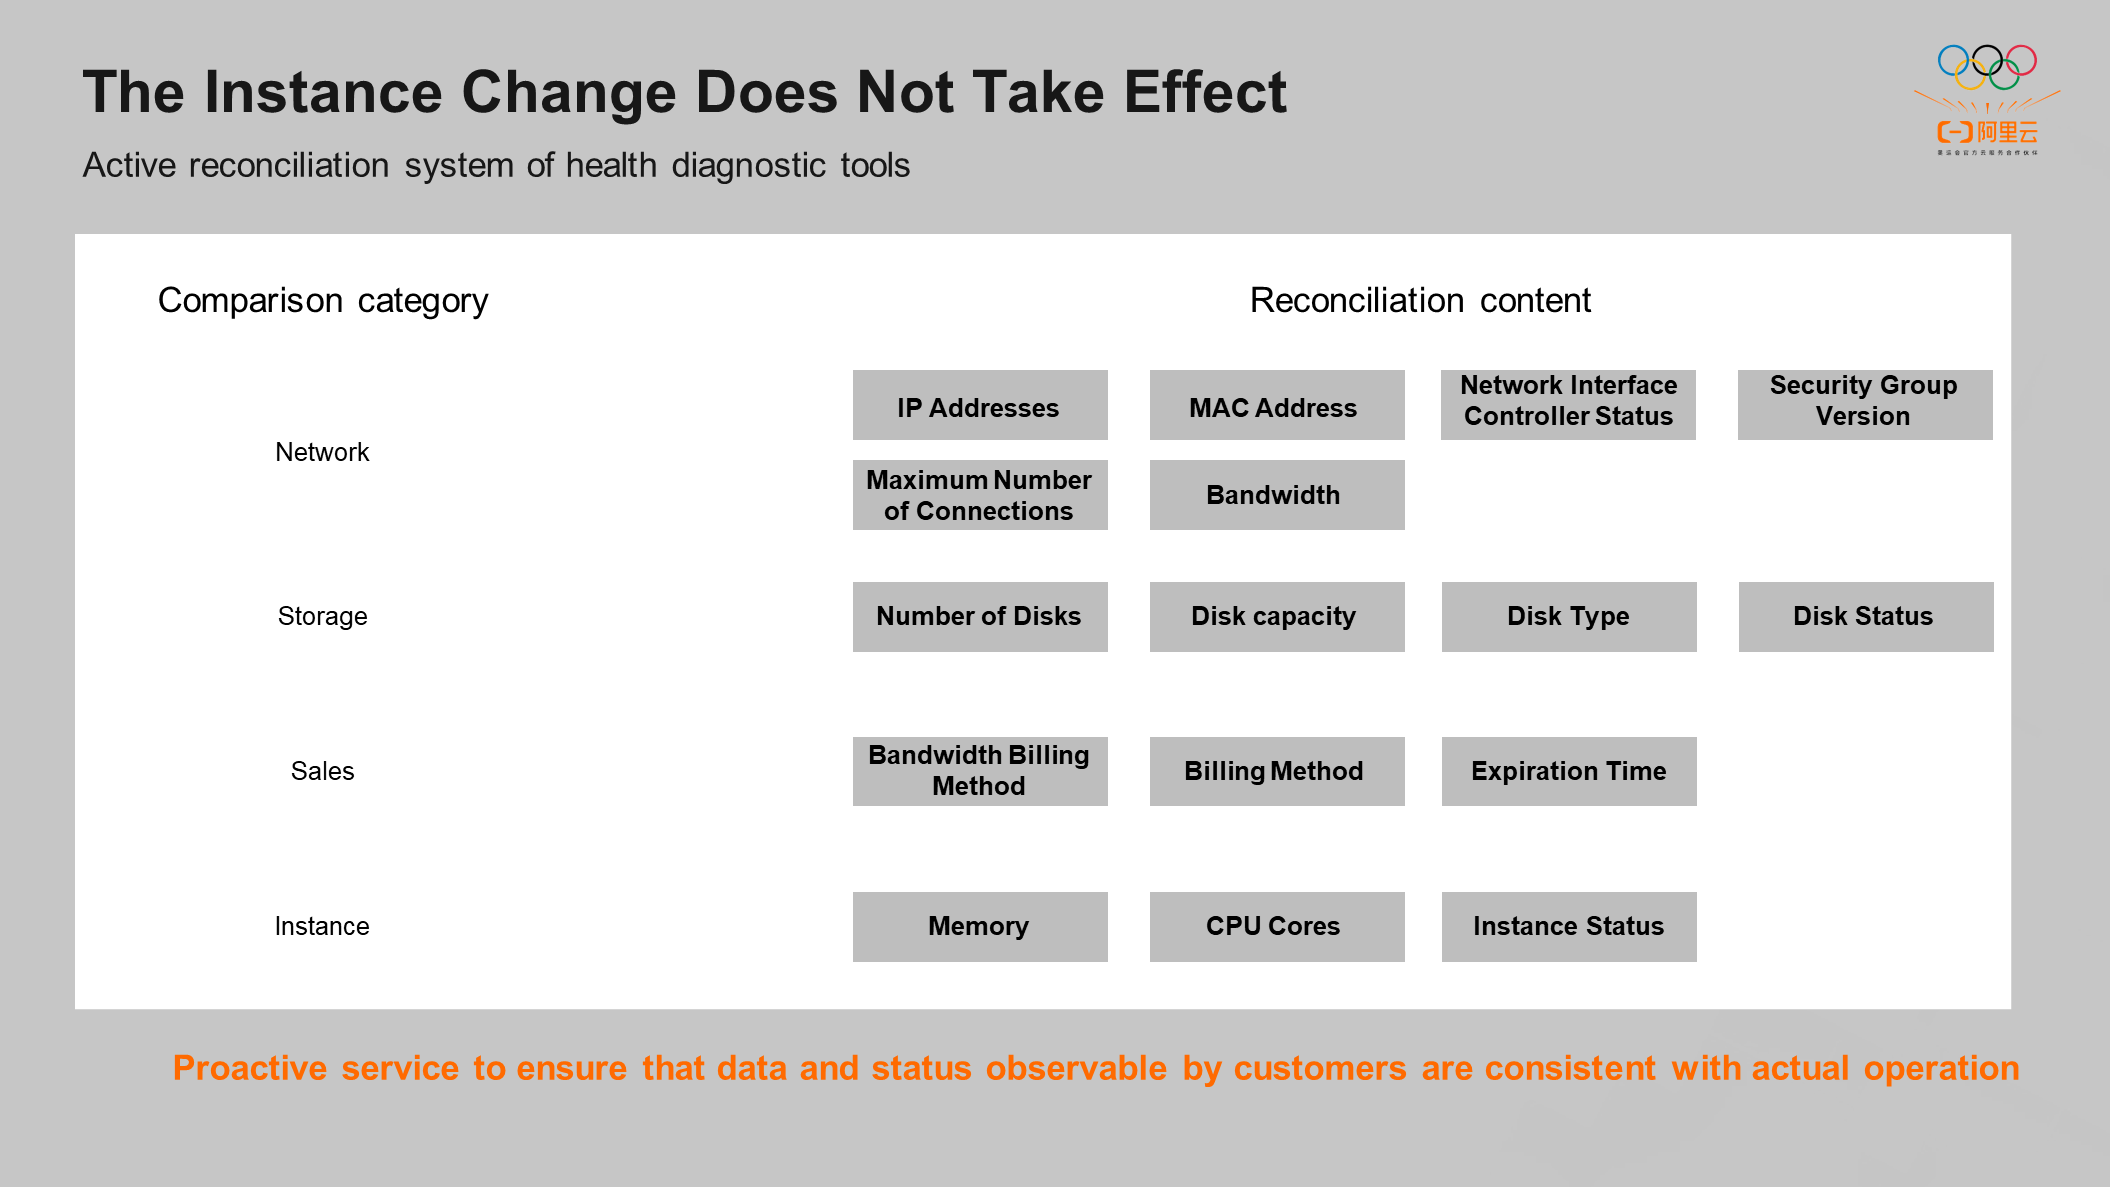
The preceding typical problems need to rely on the customer to actively initiate diagnosis on the console, which is a passive service. The active detection tool behind the self-service capability is the reconciliation system. If the services used by the customer on the cloud are inconsistent with what is running, the business will be affected. Therefore, the reconciliation tool can ensure what the customer sees on the console is consistent with the operating value. For example, it will compare whether the IP seen by the customer on the console is consistent with the actual IP.
Customer-initiated diagnostics and proactive services behind the self-service tools ensure the data observable by the customer is consistent with the actual data.
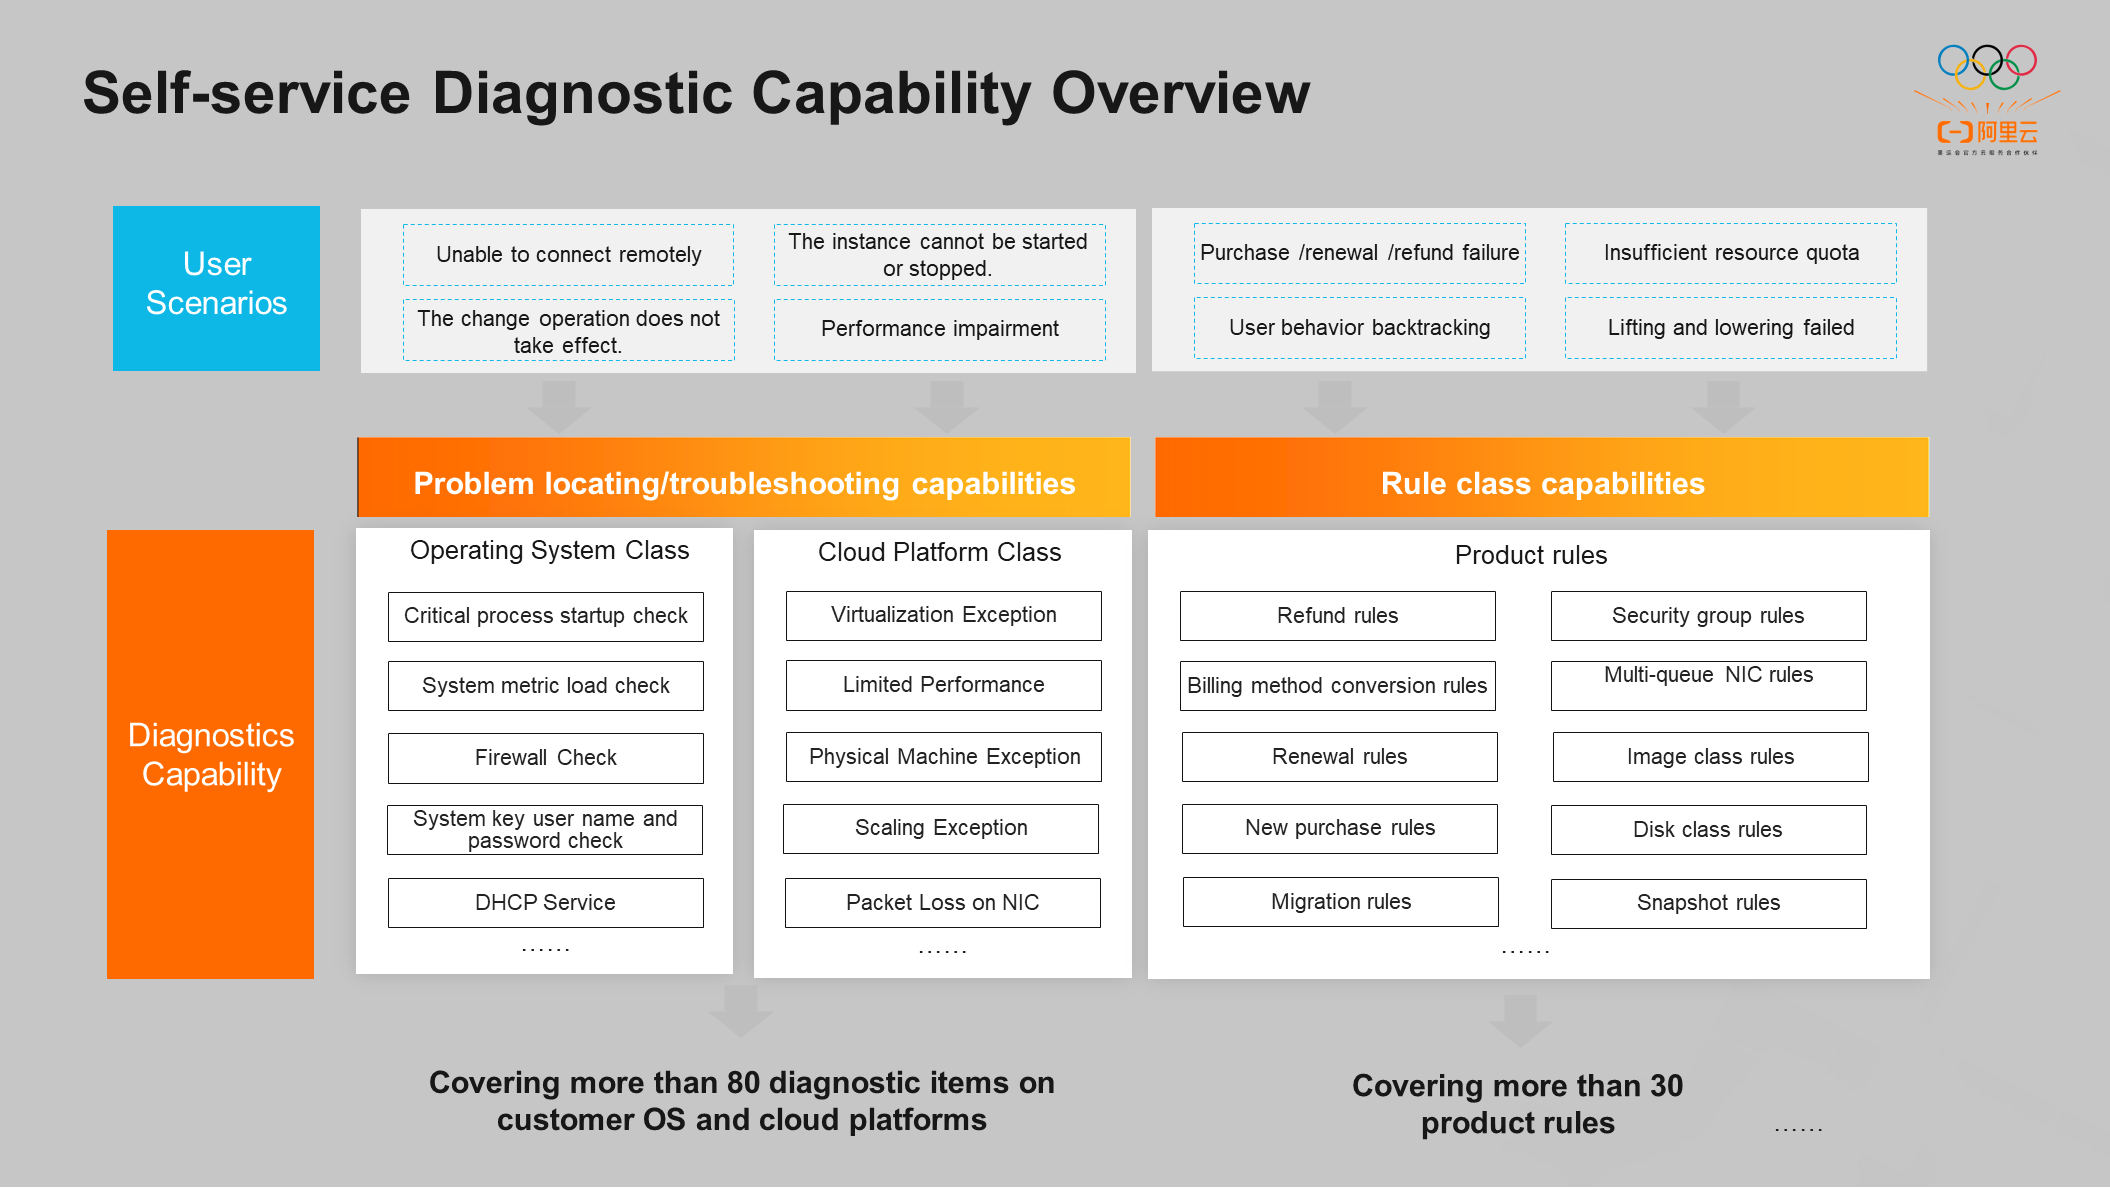
The preceding figure shows an overview of the diagnostic capabilities and user scenarios of the self-service diagnostic tool.
Diagnostic capabilities are divided into two main categories: troubleshooting and product rules. The troubleshooting category is subdivided into operating systems and cloud platforms. Currently, there are more than 80 diagnostic capabilities. The product rules category currently provides more than 30 capabilities.
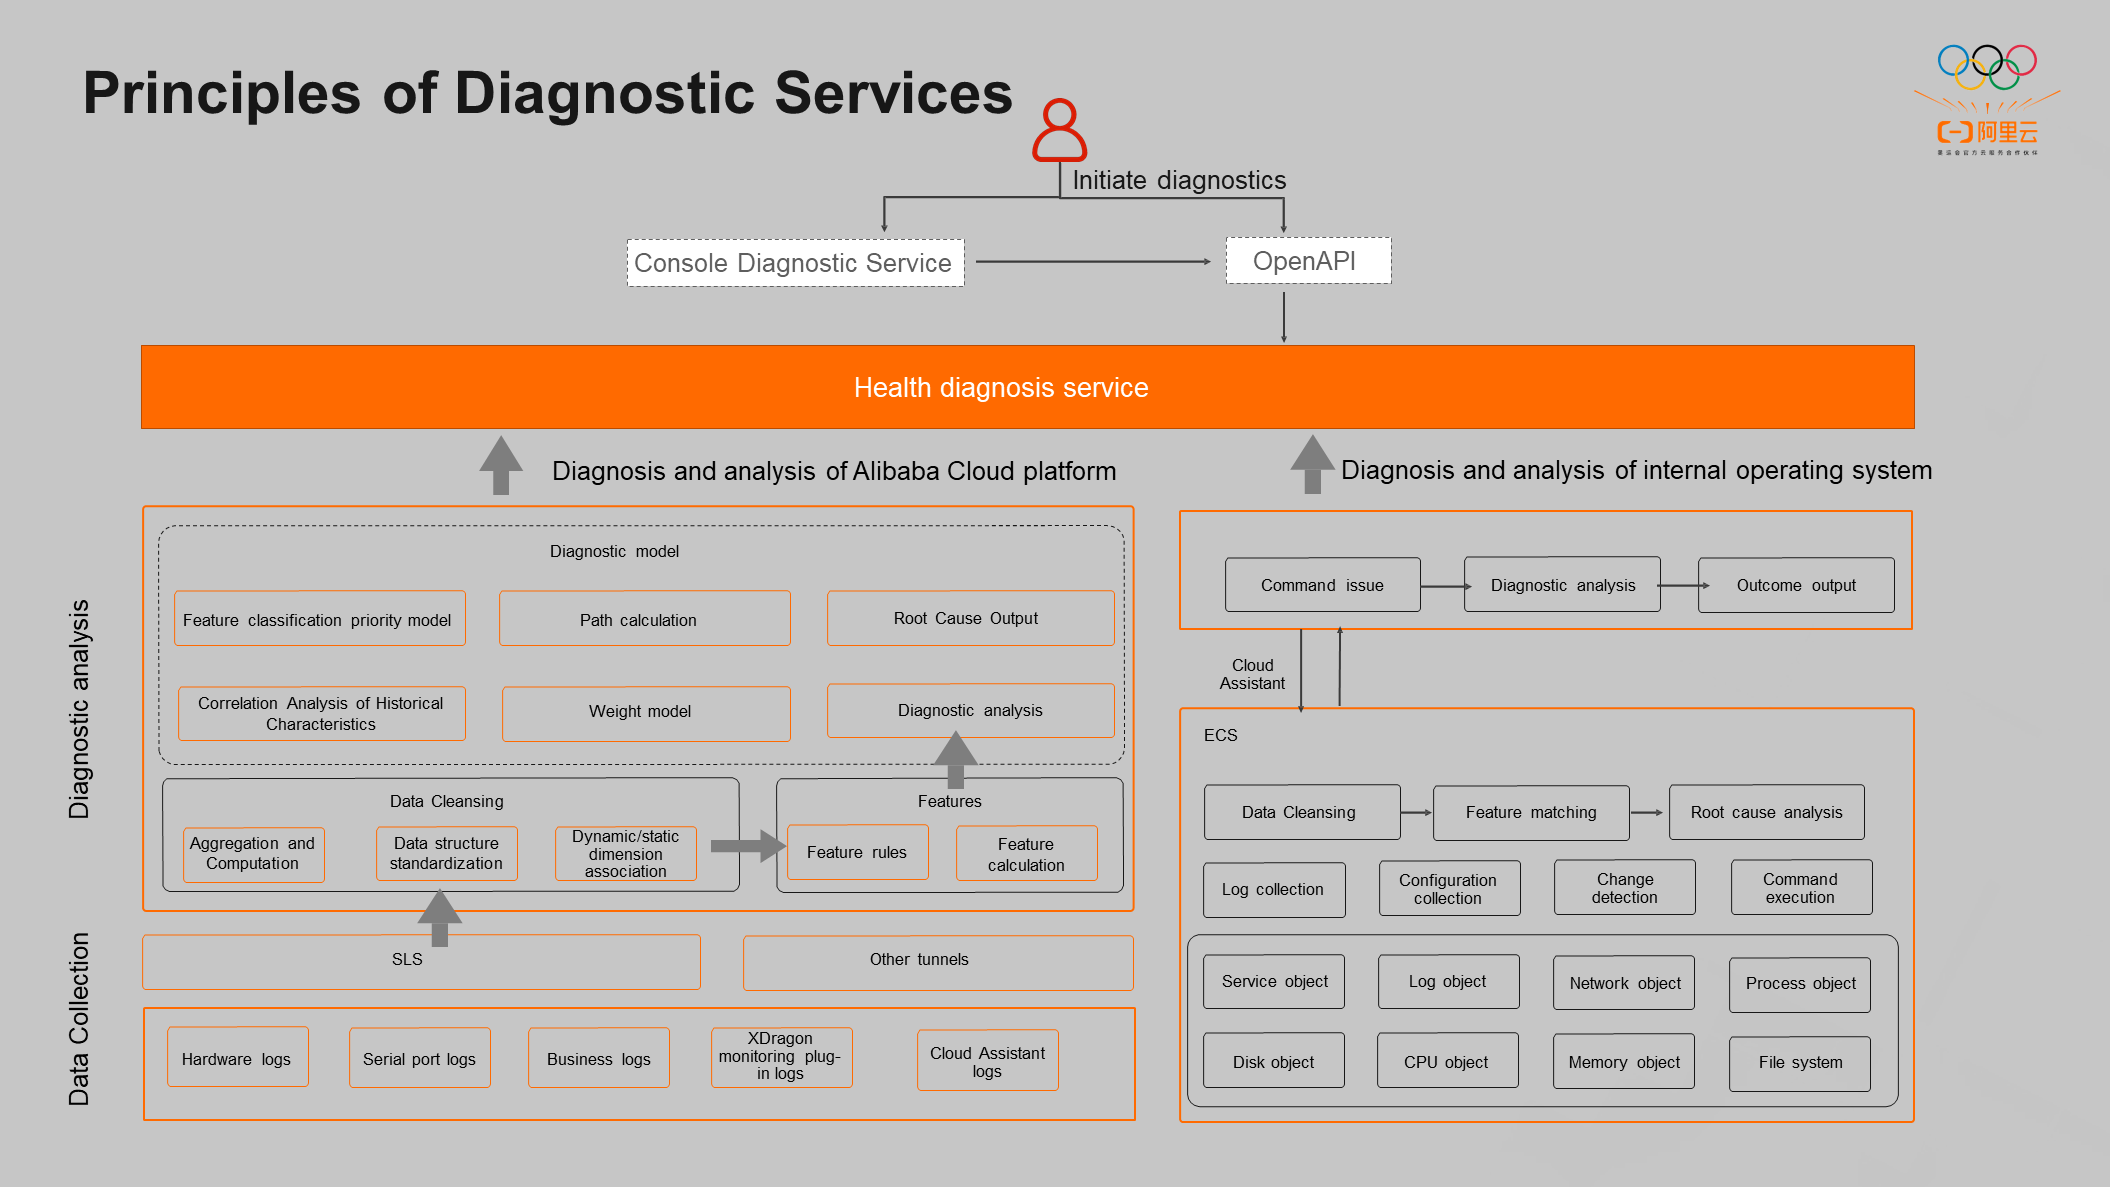
Alibaba Cloud diagnosis and analysis depend on the data at the underlying layer of Alibaba Cloud. Real-time data, such as physical machines, data centers in IDCs, operating performance, and serial port logs, are the basic logs that are input to the health diagnosis tools. Data cleansing, aggregate computing, and extracting features related to exceptions can be done with these underlying data, producing a diagnostic root cause.
Another part of the diagnostic capabilities is closely related to customers in the operating system and is implemented by installing Cloud Assistant services in the instance. When a customer initiates diagnostics, use the Cloud Assistant to execute open-source scripts on the customer instance to collect real-time data, including load classes and configuration classes (such as real-time detection of CPU, memory, iOS, and other load classes in the current customer OS), or configuration classes (such as DHCP and IP).
Alibaba Cloud platform diagnostics and operating system diagnostics constitute the health diagnosis service together. Currently, the health diagnosis service has been exported to the console for cloud customers and exported to the internal system for cloud products. OpenAPI will launch in the near future.
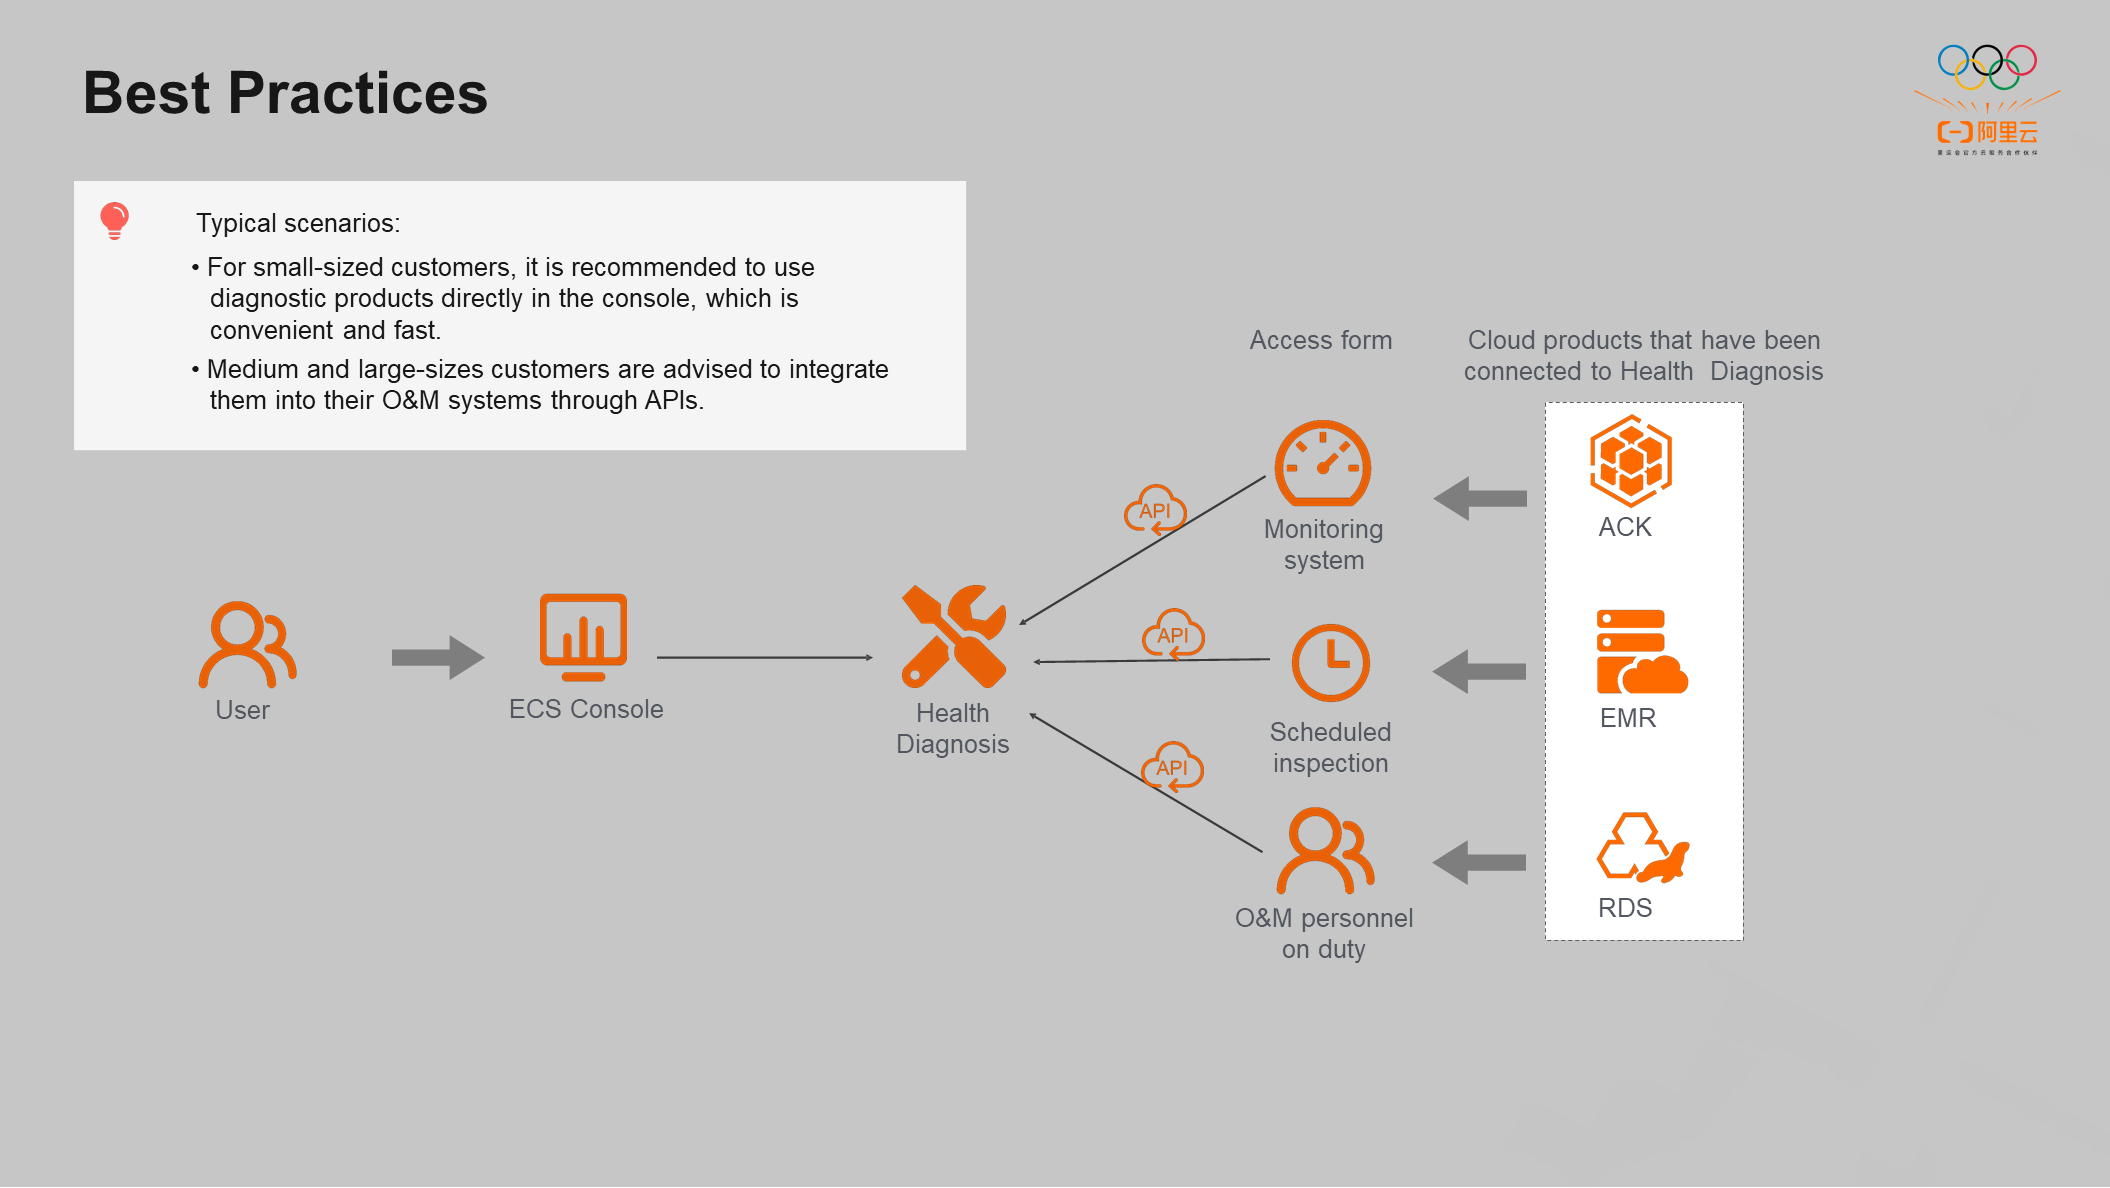
We recommend small-sized customers that do not have an O&M platform use diagnostic products directly in the console, which is convenient and fast. The diagnostic products also provide detailed solutions for your reference.
We recommend medium and large-sized customers that have O&M systems integrate the diagnostic tools into their O&M systems using APIs for high efficiency and convenience. For example, monitoring systems and diagnosis can be integrated. When the instance load in the monitoring system is abnormal, it will directly call the diagnosis API and process the problem according to the diagnosis result. The diagnosis service can be integrated into the inspection system, and the core instances of some clusters can be diagnosed in real-time every day. If there is any abnormality, the abnormal instances can be replaced or expanded in time. The diagnosis service can be integrated into the background operation and maintenance system for personnel on duty. For example, when an RDS instance initiates a diagnosis, it can also initiate a diagnosis at the ECS level.
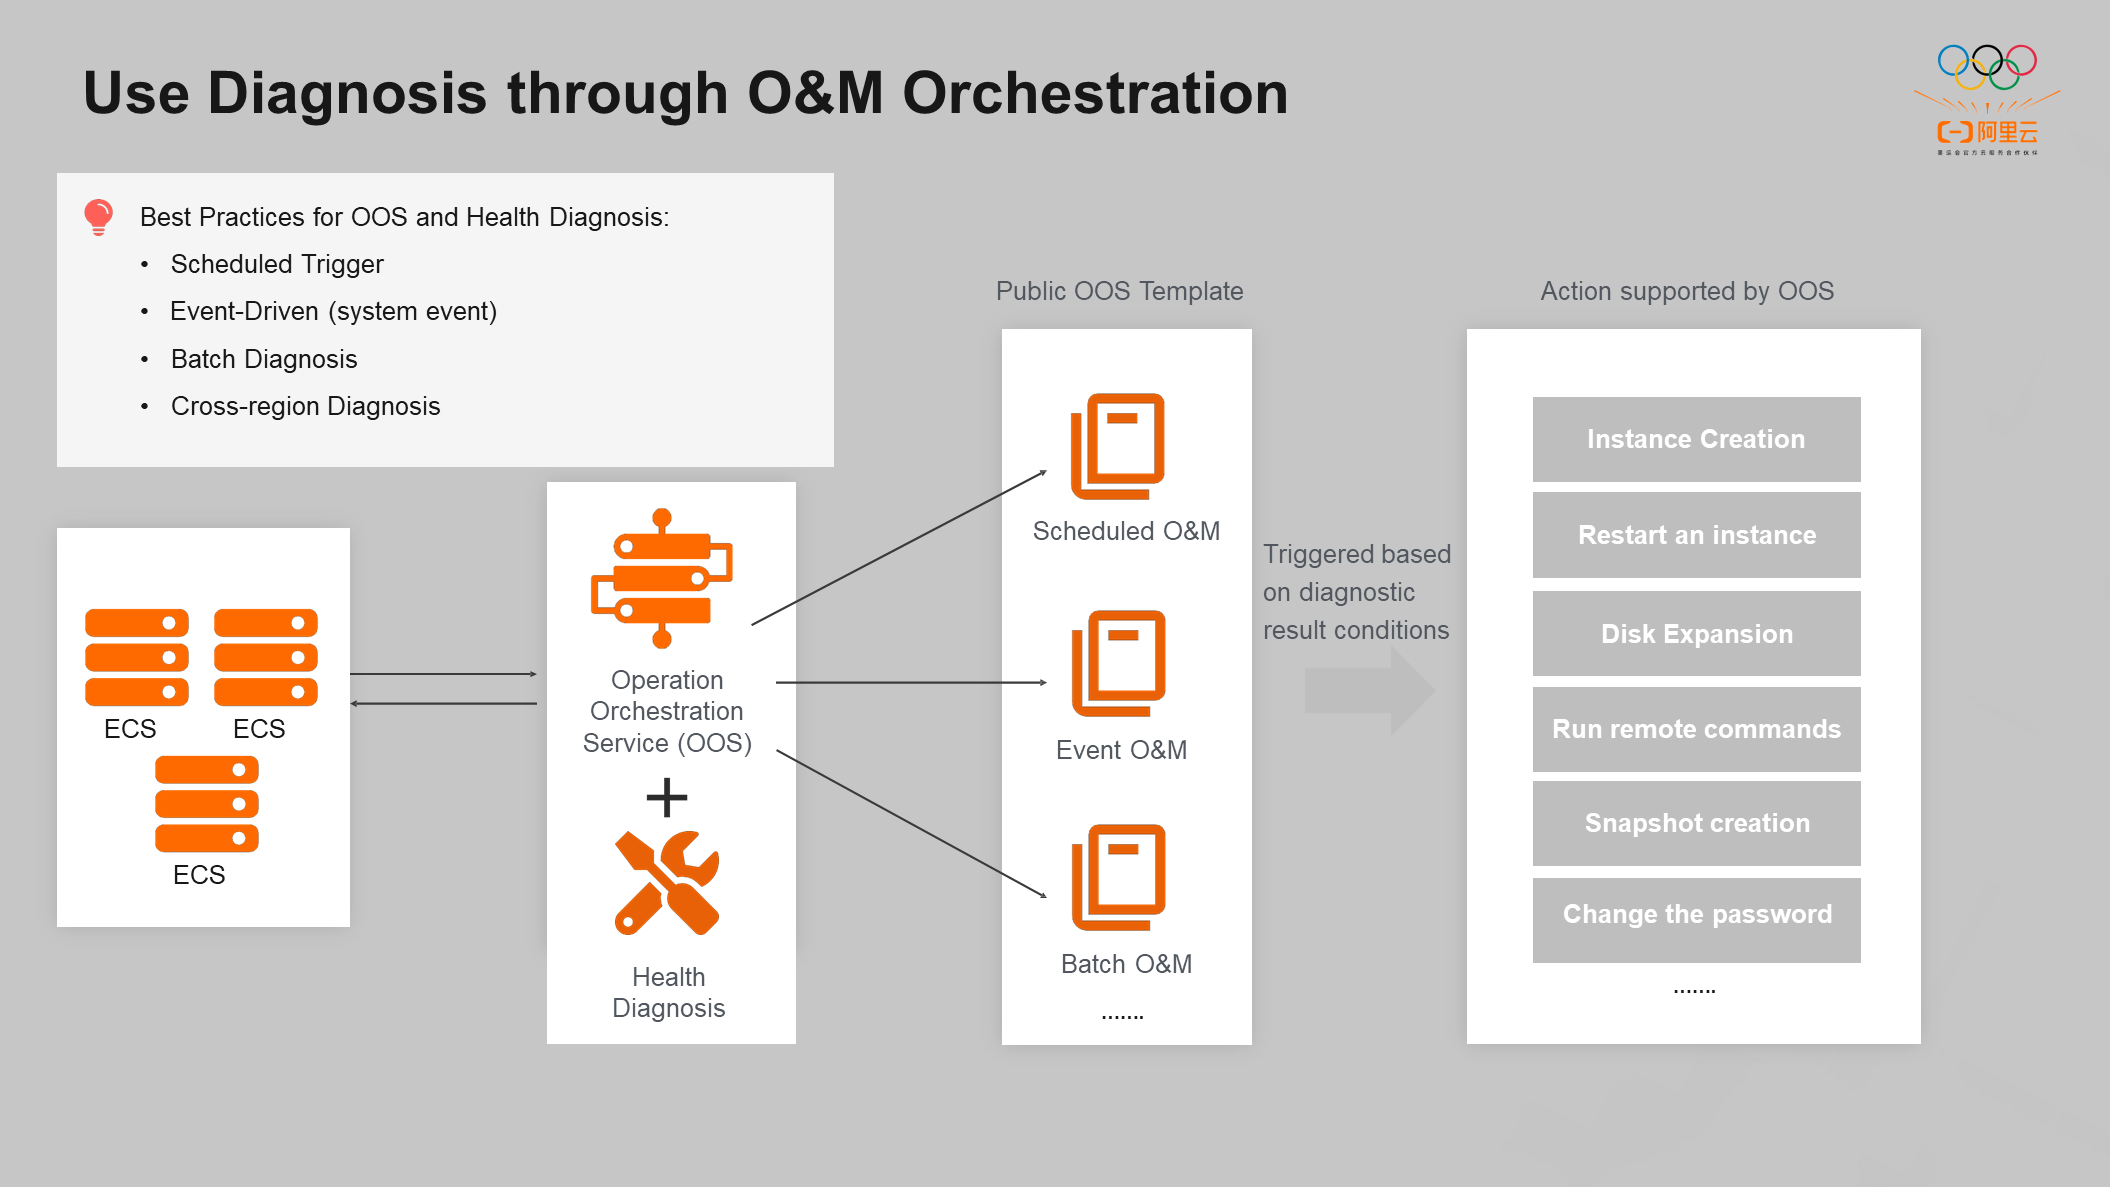
In addition, the diagnostic product combines O&M orchestration capabilities. Many public O&M templates are available to implement scheduled O&M and event-driven O&M quickly. The diagnostic product also provides batch operations, such as batch diagnosis or cross-region diagnosis. You can directly use public scripts in the OS console. At the same time, the diagnostic products support ECS products to trigger operations according to the diagnosis results. For example, if the diagnostic result indicates that the current instance is overloaded, new instance creation or configuration upgrade will be triggered. If the diagnostic result indicates that the cloud disk capacity is full, an expansion command will be triggered.
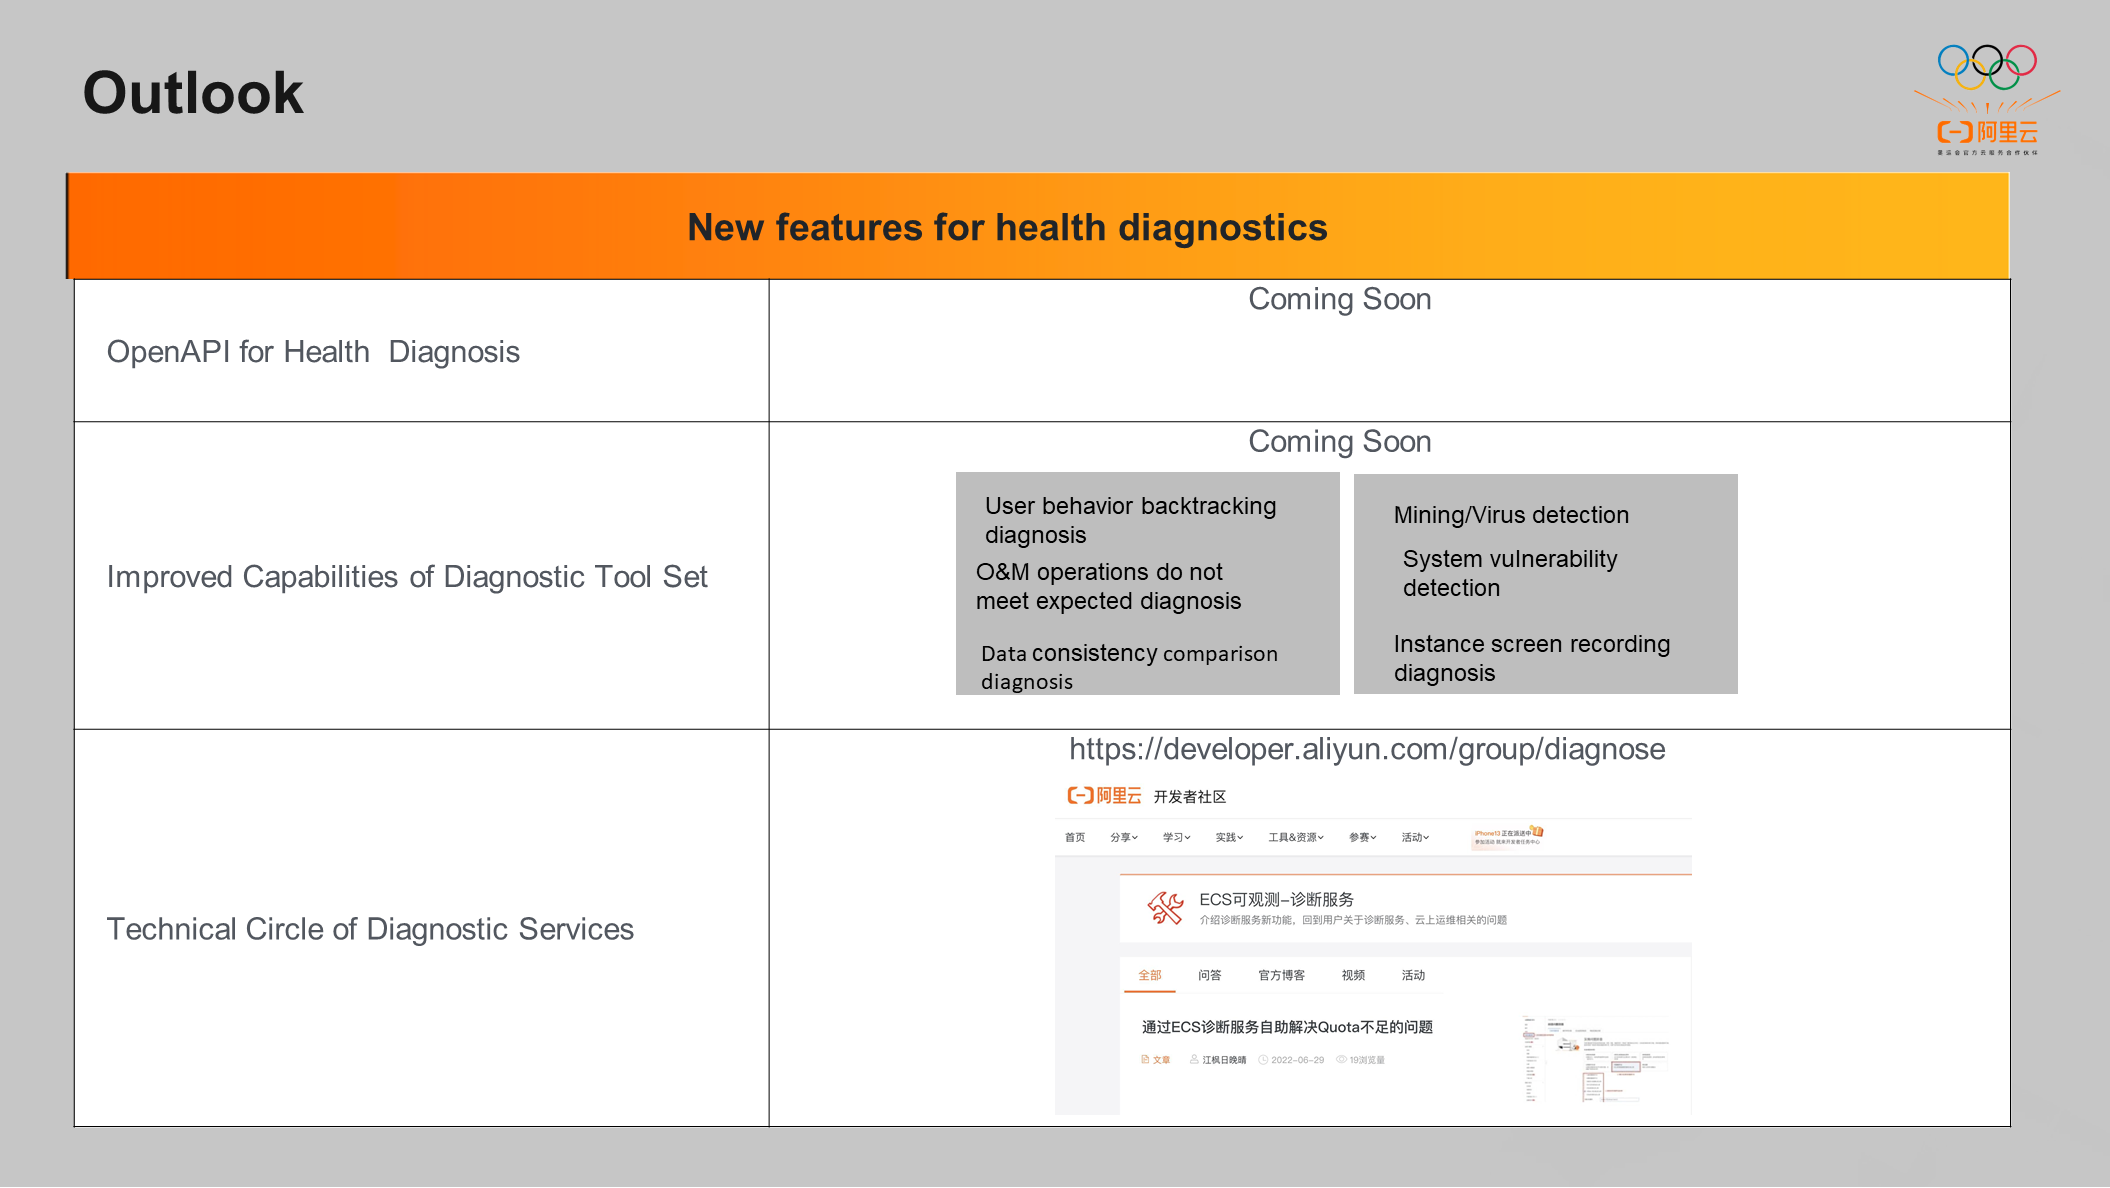
The self-service diagnosis tool is expected to be the general entry point to locate and troubleshoot the problems of ECS. The Open API for Health Diagnosis will release in the near future. We are intensively developing more diagnostic capabilities. In addition, a technical circle has been established in the official community of Alibaba Cloud for professional communication and sharing.
Q1: Why not perform an automatic repair after an automatic diagnosis?
A: We have tried some automatic repair, but the effect is not good. First, some repair actions are risky. Second, repair actions may require user authorization. Therefore, we only provided the repair plan to the customer.
Q2: How accurate is problem discovery and location?
A: Diagnostic tools cannot fully cover problems. Currently, it mainly covers the frequency of problems. There are three sources of problems. The first type is customer work orders, which can be integrated into diagnostic tools (from frequently occurring problems). The second category is to visit some customers above GC 3 regularly. The third category is the weekly control duty report within the team at ordinary times.
Essential for Reliability Assurance – Performing Chaos Engineering on the Cloud

1,345 posts | 472 followers
FollowDavidZhang - July 5, 2022
Alibaba Cloud Community - August 2, 2022
Alibaba Cloud Native Community - July 13, 2022
Alibaba Cloud Community - October 14, 2022
Alibaba Cloud Native Community - September 12, 2023
Alibaba Cloud Community - October 10, 2022

1,345 posts | 472 followers
Follow Bastionhost
A unified, efficient, and secure platform that provides cloud-based O&M, access control, and operation audit.
Learn More Managed Service for Grafana
Managed Service for Grafana displays a large amount of data in real time to provide an overview of business and O&M monitoring.
Learn More ECS(Elastic Compute Service)
Elastic and secure virtual cloud servers to cater all your cloud hosting needs.
Learn More Apsara Stack
Apsara Stack is a full-stack cloud solution created by Alibaba Cloud for medium- and large-size enterprise-class customers.
Learn MoreMore Posts by Alibaba Cloud Community