By Wenting and Buzhou
This article describes the best practices of observable tools of Message Queue for Apache RocketMQ in online production environments. Message Queue for Apache RocketMQ overtakes similar products in the industry in observability. The features of Message Queue for Apache RocketMQ, such as dashboards and messaging tracing, protect the core business process and effectively cope with scenarios, including capacity planning, troubleshooting of message sending and receiving, and customized monitoring, which are encountered during online mass production and utilization.
Alibaba Cloud provides a large number of message products. The message product matrix covers the fields of various business scenarios, such as the Internet, big data, and IoT, offering multi-dimensional message solutions to cloud customers. No matter which MQ product is, its core is to help you solve the asynchrony and decoupling of the business and system and cope with load shifting during traffic peaks. It is also a distributed product with high throughput, low latency, and high scalability.
However, message products have different focuses on customer-oriented applications. Briefly speaking, Message Queue for Apache RocketMQ is the preferred message channel in the business field, Kafka is an indispensable message product in the big data field, MQTT is a message solution in the IoT field, RabbitMQ focuses on the traditional business message field, MQ MNS completes cloud-native product integration and event flow channel, and EventBridge is an event hub on Alibaba Cloud to build the event center in a unified way.
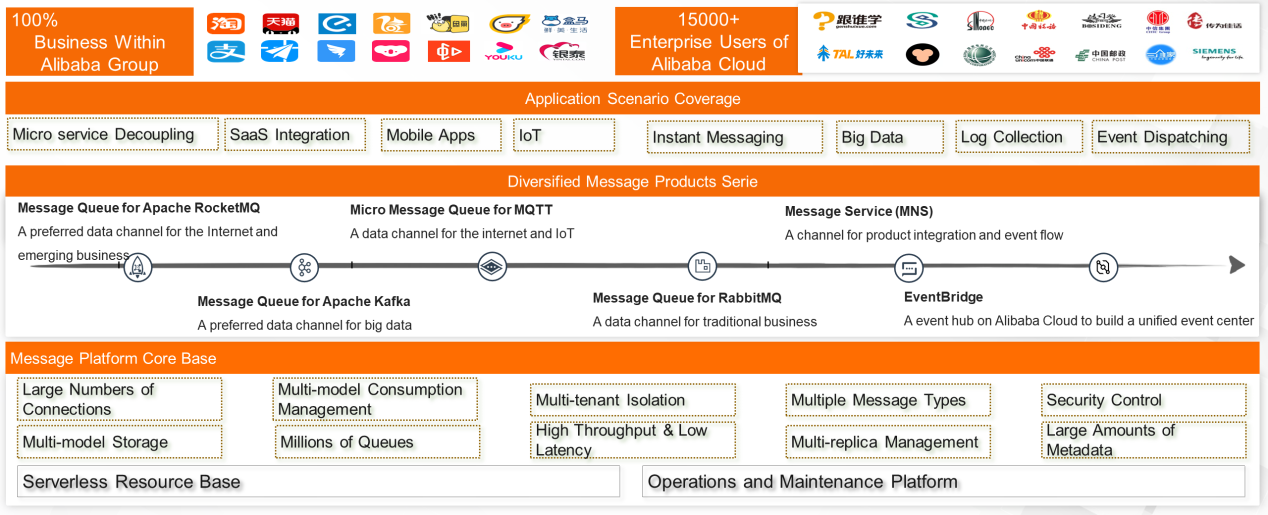
This article describes the preferred message channel in the business field, Message Queue for Apache RocketMQ, which was born in the e-commerce system of Alibaba Group. It has capabilities for high performance, low latency, and load shifting. It also provides a wide range of features to deal with instantaneous traffic peaks in business and message scenarios. It is integrated into the core business process for you.
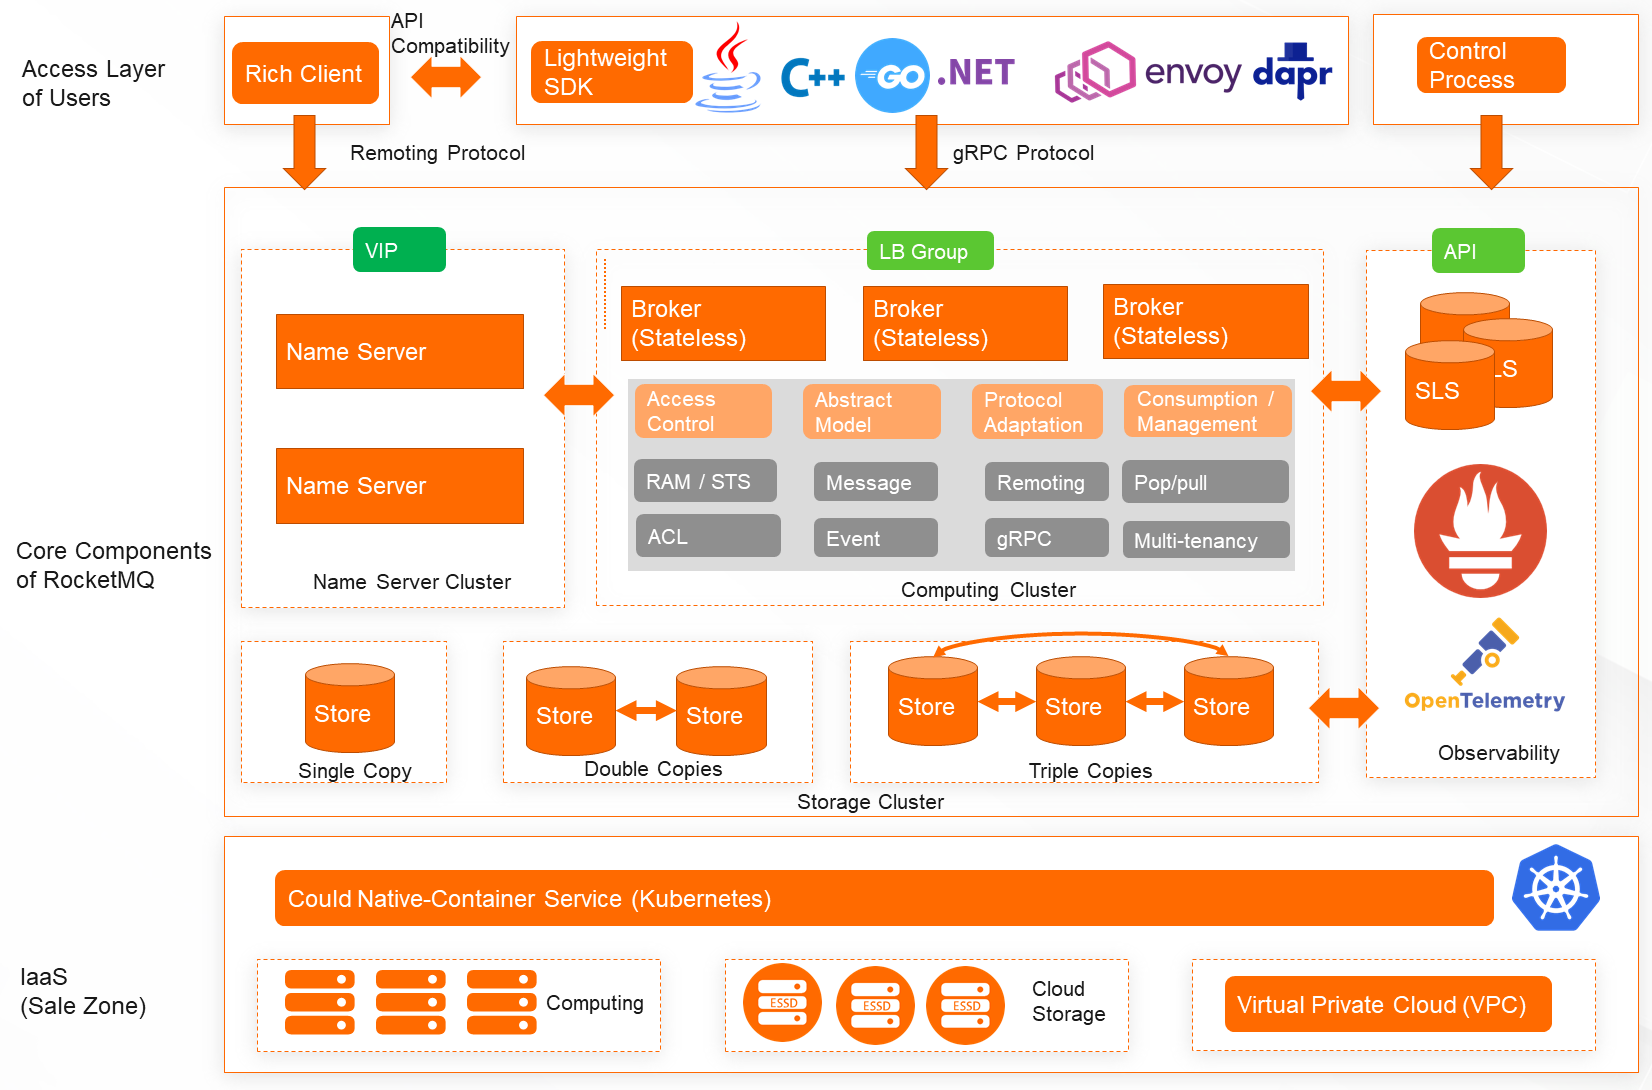
Message Queue for Apache RocketMQ is required to have very high observability to process a message in the core business process. Thanks to the observability, you can monitor and locate abnormal fluctuations in time and troubleshoot specific business data problems. Therefore, observability has gradually become one of the core capabilities of Message Queue for Apache RocketMQ.
When it comes to observability, you can think of its three elements: metrics, tracing, and logging.
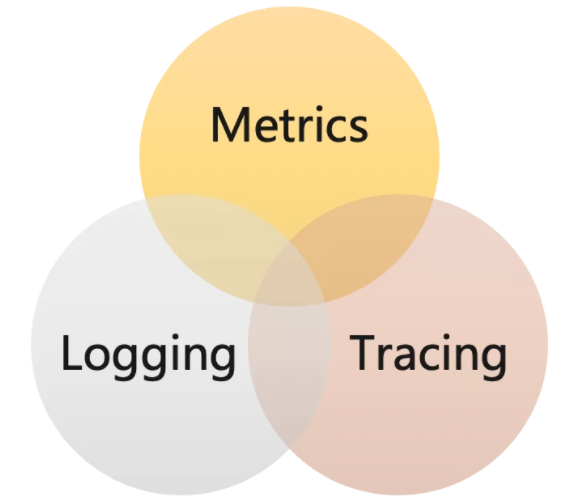
Combined with the understanding of MQ, the three elements of observability are explained below:
1) A Wide Range of Metrics: The metrics include the number of messages, the amount of accumulation, and the duration of each phase. Each metric is aggregated and displayed from multiple dimensions, including Instance, Topics, and Consumption Group IDs.
2) Best Practice Templates of Message Team: It provides the best templates for you, especially in complex message consumption scenarios. It also offers a wide range of metrics to help you quickly locate problems and continuously realize updates and iterations.
3) Prometheus and Grafana: Data that complies with Prometheus standard data formats can be collected and displayed in Grafana. In addition to templates, you can customize dashboards.
1) Tracing Standard -- OpenTelemetry: The tracing standard of Message Queue for Apache RocketMQ has been merged into the open-source standard of OpenTelemetry to regulate and enrich definitions of scenarios for messaging tracing.
2) Customized Display of the Message Field: It reorganizes abstract request span data from the message dimension to display one-to-many consumption information and multiple consumption information, which is intuitive and easy to understand.
3) Connecting Upstream and Downstream Tracing Processes: The tracing of a message can inherit and call contexts and add it to the complete call process. The message process information concatenates the information of upstream and downstream processes of the asynchronous process.
1) Error Code Standardization: Different errors have a unique error code.
2) Complete Error Message: It contains the complete error messages and the resource information required for sorting.
3) Error Level Standardization: The log levels of different error messages are refined, allowing you to configure more appropriate and monitor alerts based on levels such as error and warn.
After understanding the basic concepts of MQ and observability, let's take a look at what will happen when Message Queue for Apache RocketMQ encounters observability.
From the preceding introduction, the observability of Message Queue for Apache RocketMQ can help you troubleshoot messages during production and consumption according to error messages. The following section will introduce some concepts in the production and consumption processes of messages to help you understand the application of features.
First of all, let's clarify the following concepts:
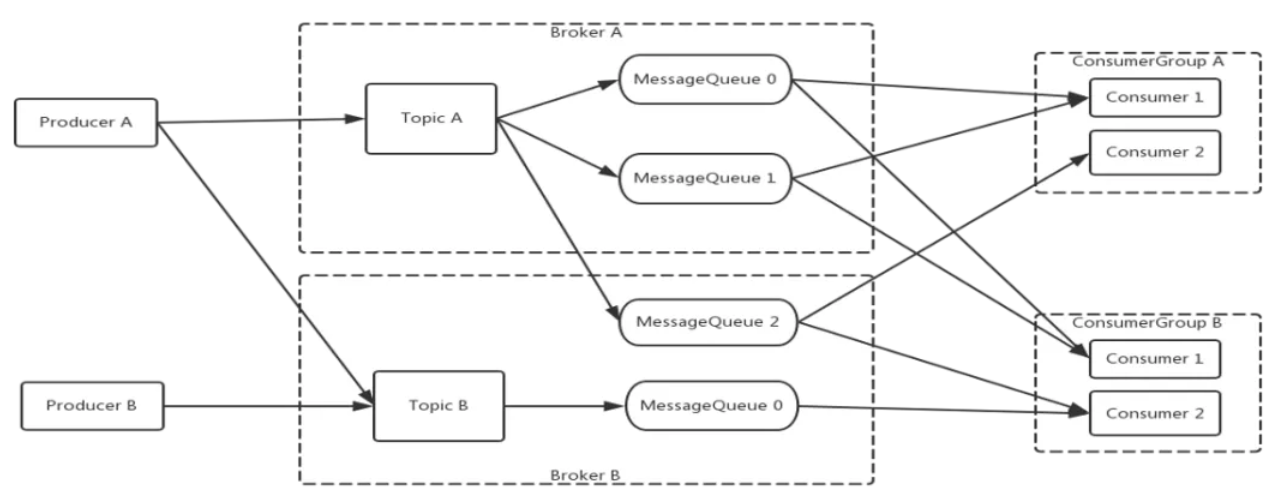
In short, the production and consumption processes of messages say the producer sends messages to the MQ of the topic for storage. Then, the consumer consumes the messages on the MQ. What is the lifecycle of complete message production with multiple consumers?
Here, we take a scheduled message as an example. The producer sends a message to MQ Server after a certain duration, and MQ Server stores the message in the MQ. At this time, there is a storage time in the queue. If it is a scheduled message, it needs a certain scheduled time to be consumed by the consumer. It is the time when the message is ready. After the scheduled time, the consumer starts to consume the message, and the consumer pulls the message from the MQ. Then, the message reaches the consumer client after a certain duration of the network. At this time, it is not a low code for consumption. There will be a process of waiting for the resource thread of the consumer, and the business message processing will start after waiting for the thread resources of the consumer.

From the introduction above, business messages are processed for a certain duration, and the ACK result is not returned to the Server until the business message processing is finished. In the entire process of production and consumption, the most complicated part is consumption. Due to duration and other reasons, scenarios where messages are accumulated often occur. The following part focuses on the meaning of each metric in scenarios of message accumulation.

As shown in the preceding figure, the gray part indicates the number of completed messages in the MQ; the messages that the consumer has processed and returned to ACK. The orange part indicates those messages that have been pulled to the consumer client and are being processed, but the processing result has not been returned. This message has a very important metric, the message processing duration. The green part indicates that those messages have been stored in the MQ that has occurred. They are already in a state that can be consumed by the consumer called ready messages.
The Number of Ready Messages:
Meaning: It indicates how many ready messages are.
Feature: The number of messages reflects the scale of the message that has not been consumed. When the consumer experiences exceptions, the number of ready messages increases.
Queue Time:
Meaning: The time lag between the ready time and the current time of the earliest ready message
Feature: This time reflects the delay of messages that have not been processed. It is a vital metric for time-sensitive business.
Combined with the concept of the observability of Message Queue for Apache RocketMQ described above, the following part describes the two core features of the observability tools of Message Queue for Apache RocketMQ.
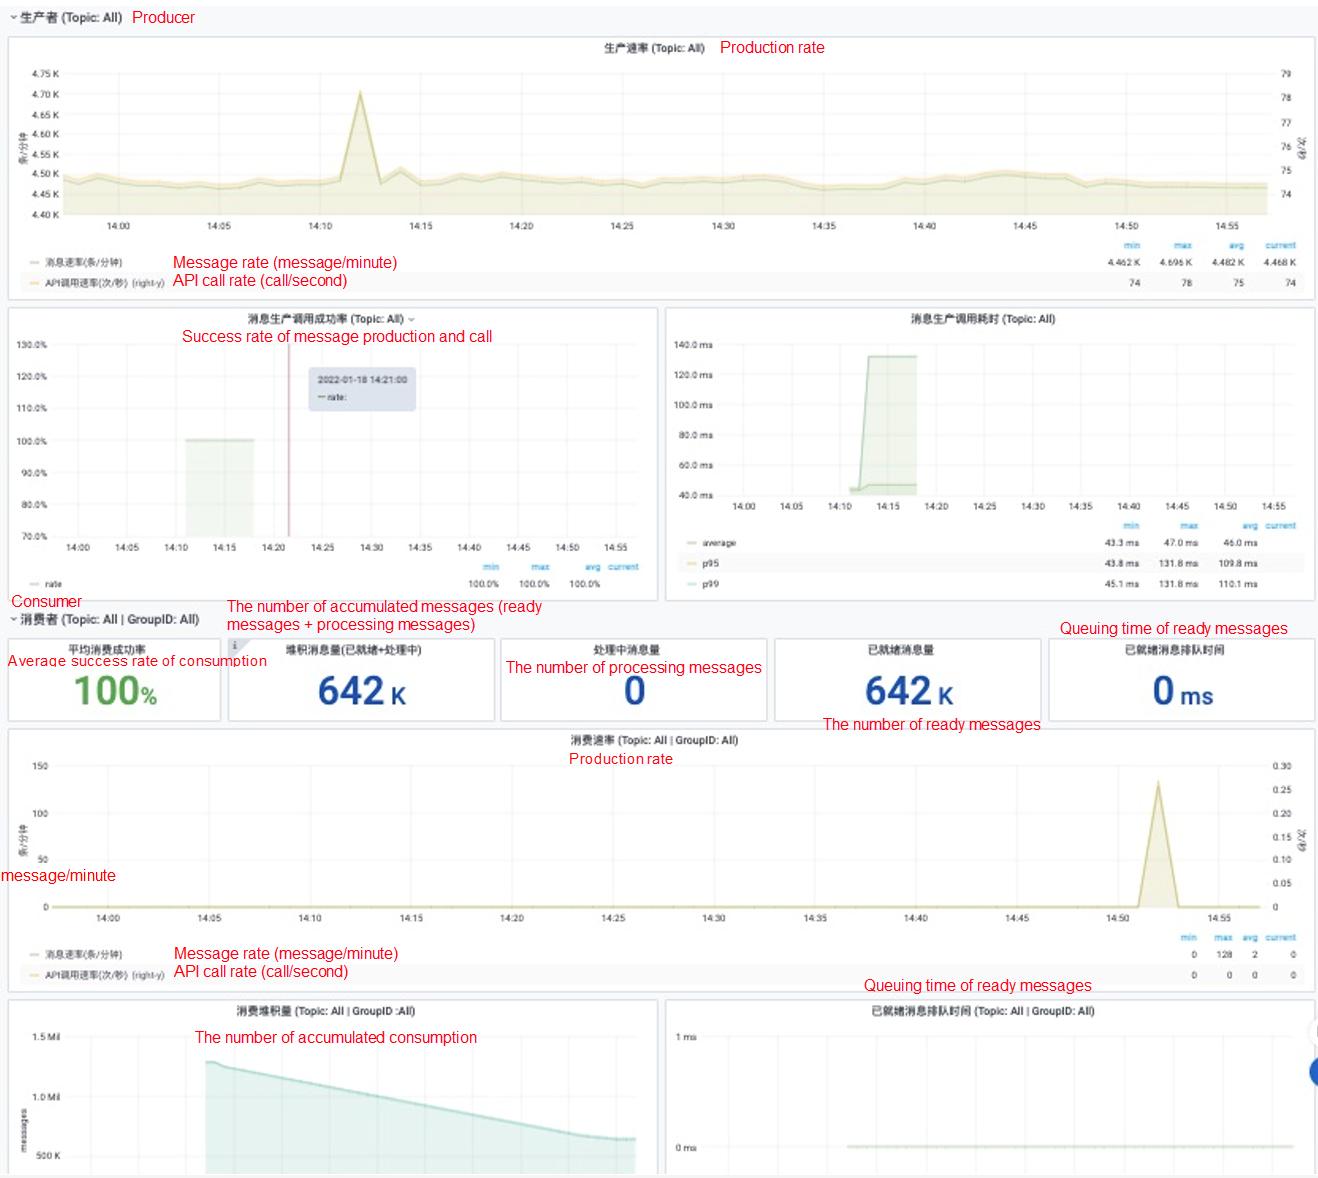
The dashboard allows you to view the specified metric data based on various parameters. The main metric data includes the following three points:
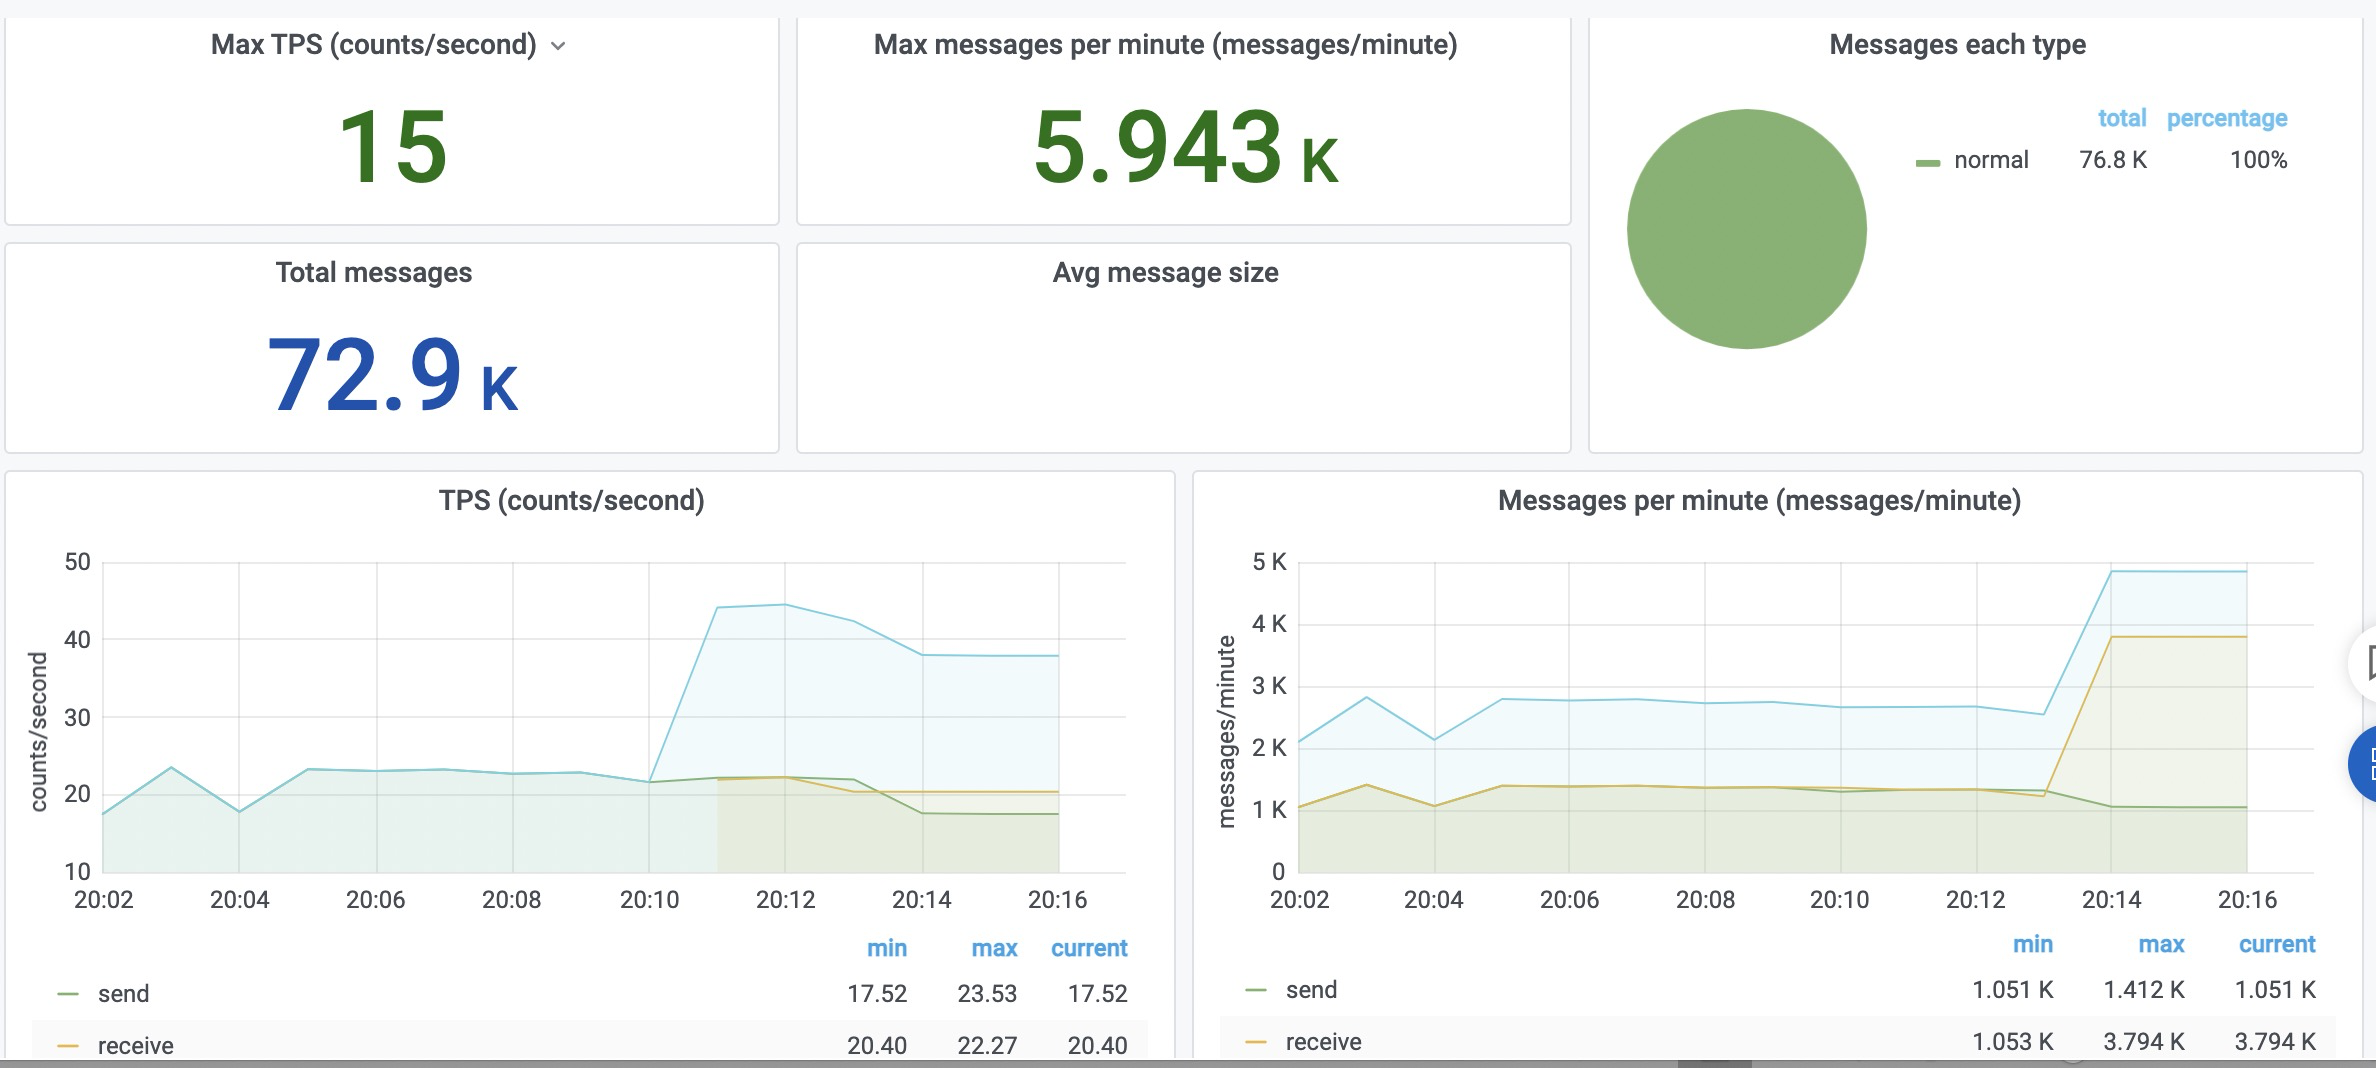
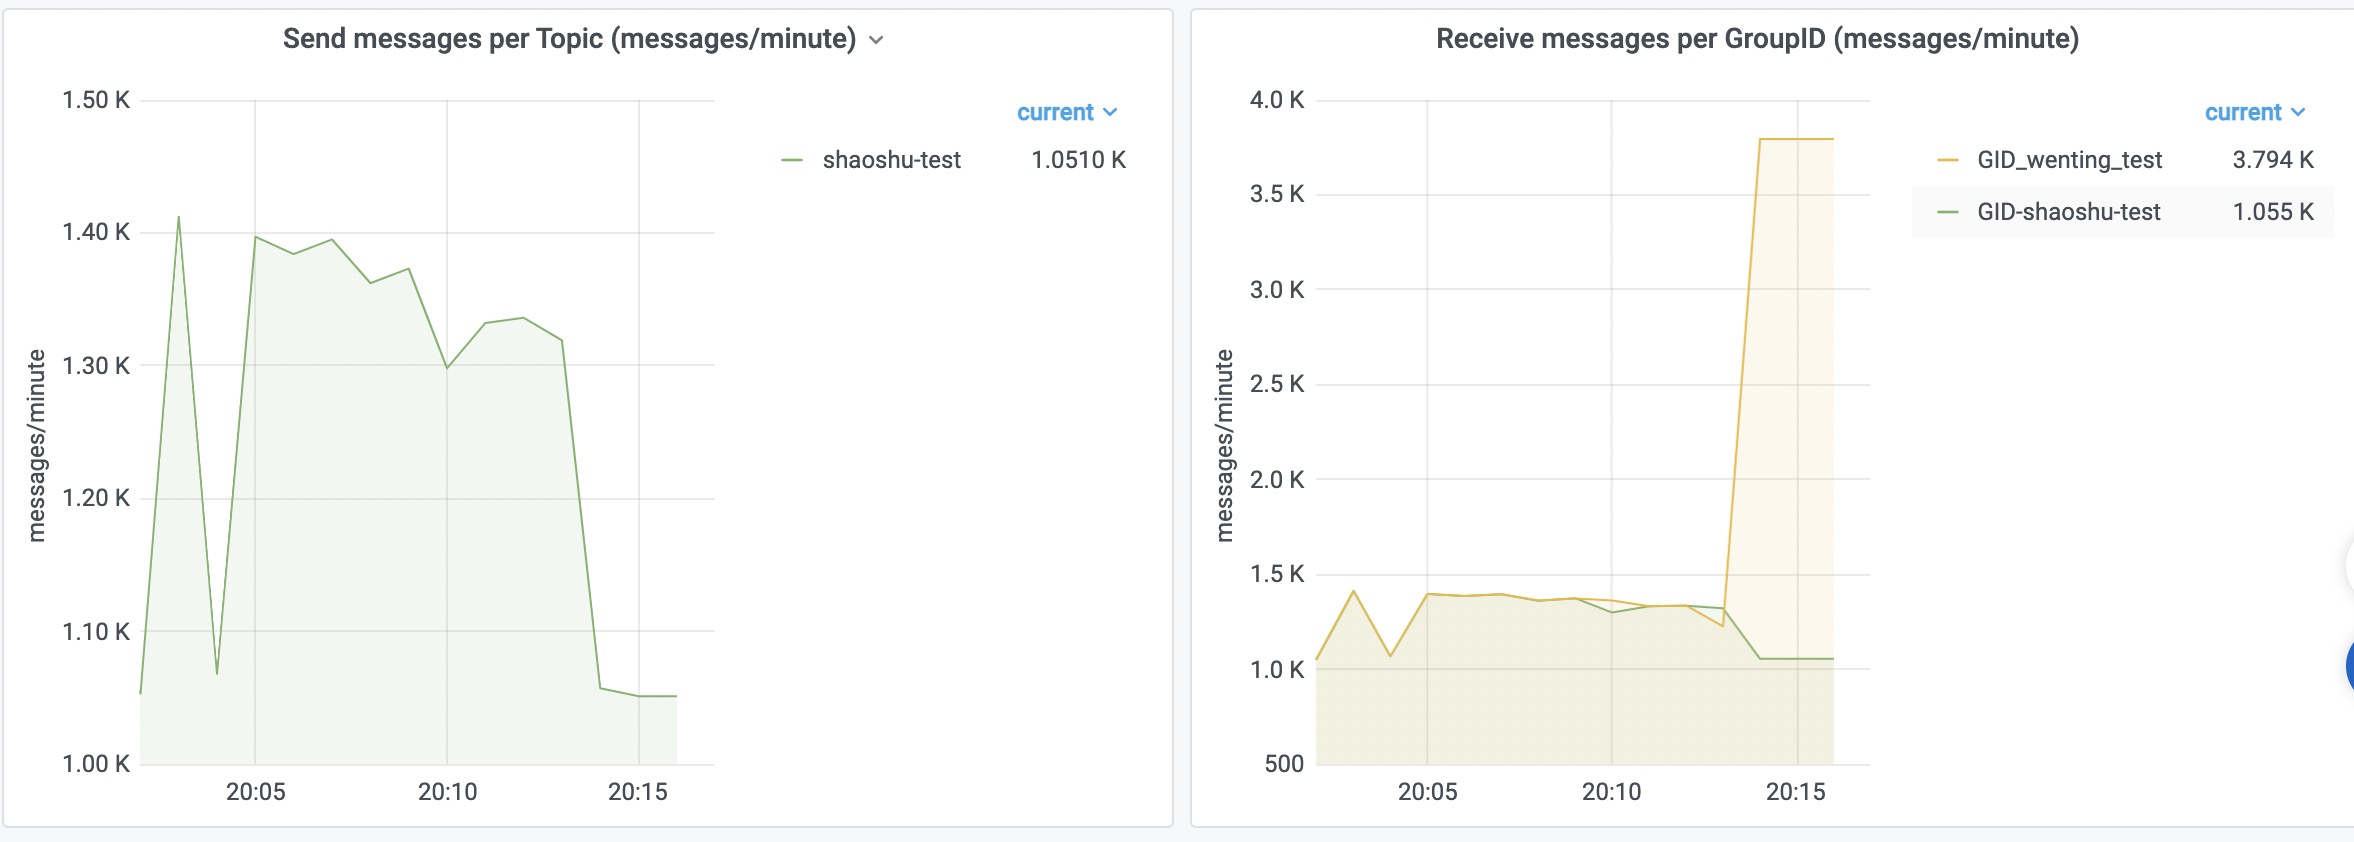
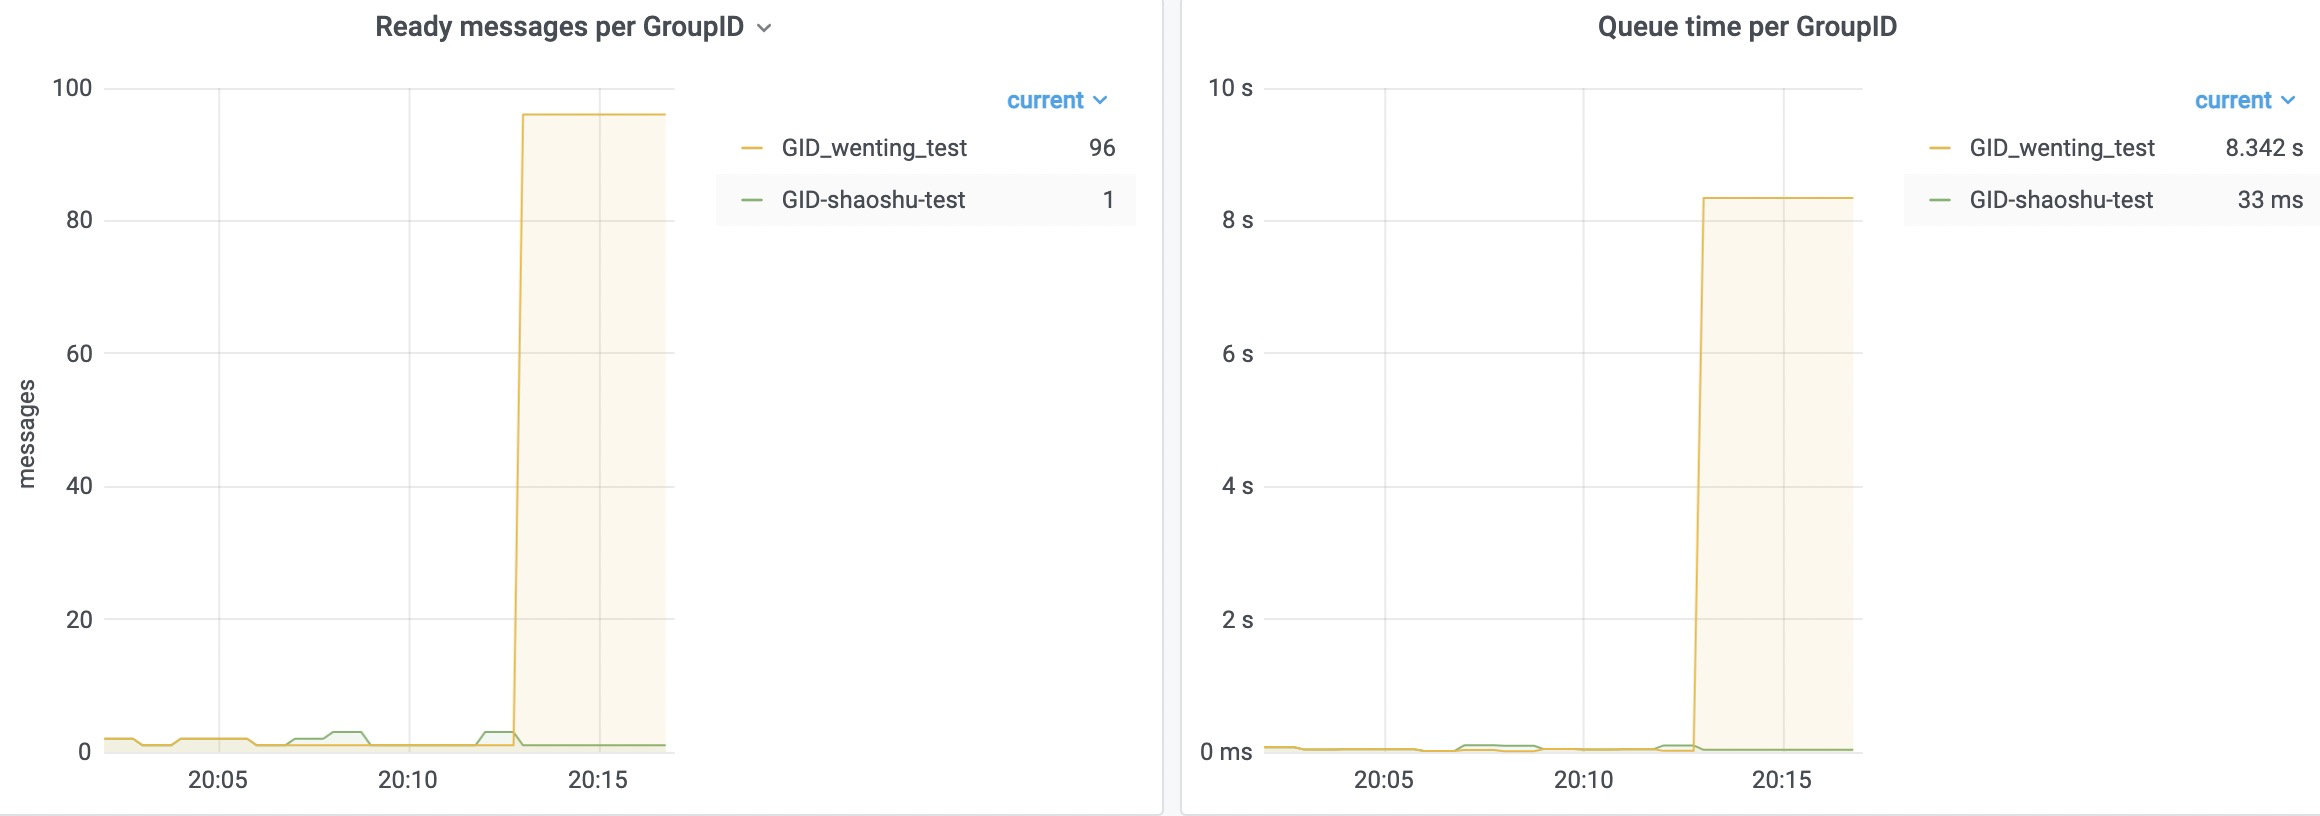
In terms of tracing, the observability tools have the feature of messaging tracing, which includes the following three capabilities:
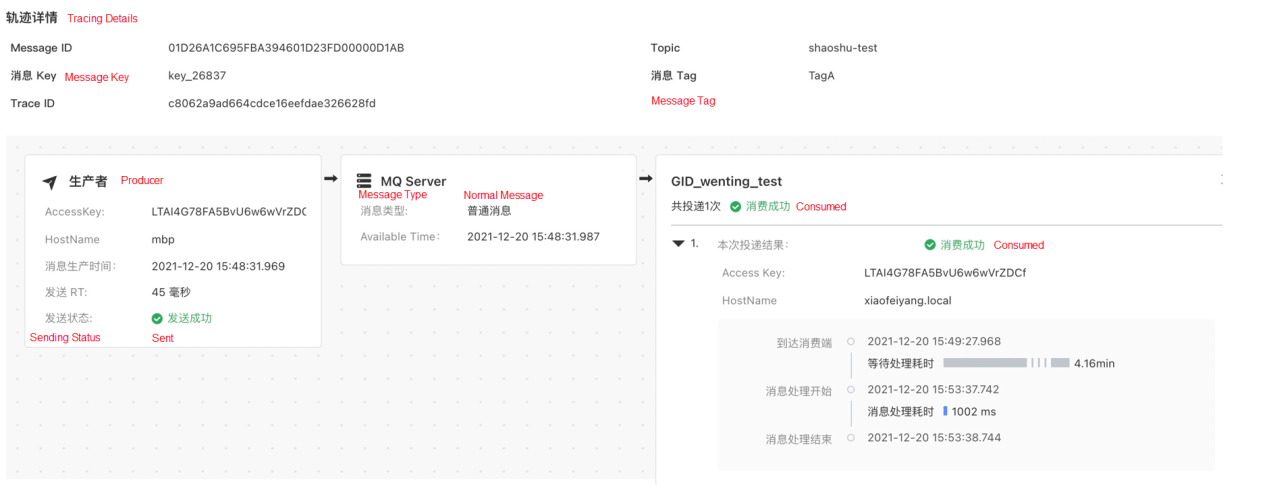
1) Convenient Query Capability: You can query relevant tracing based on the basic information of messages. In addition, you can filter queries based on the result status and duration to find valid tracing to quickly locate problems.
2) Detailed Tracing Information: In addition to the time and duration data of each lifecycle, the messaging tracing provides the accounts and machine information of producers and consumers.
3) Optimized Display Effect: The messaging tracing displays different message types, scenarios where there are multiple consumption Group IDs, and scenarios where the same consumption GroupID is recommitted multiple times.
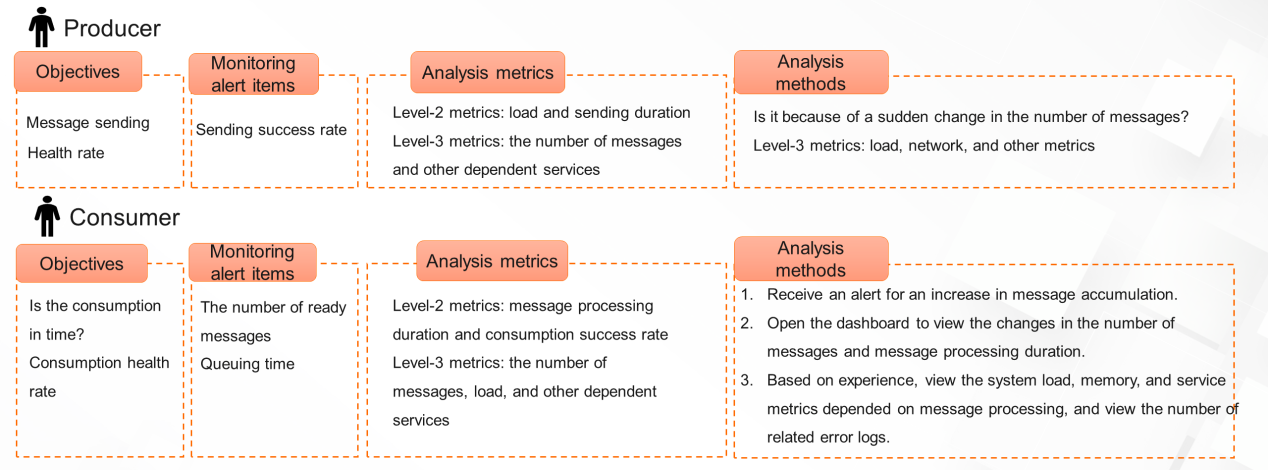
1) Target: Health status of message production and consumption
2) Principles
Based on the target and principles, the troubleshooting and analysis for producers and consumers are listed below:
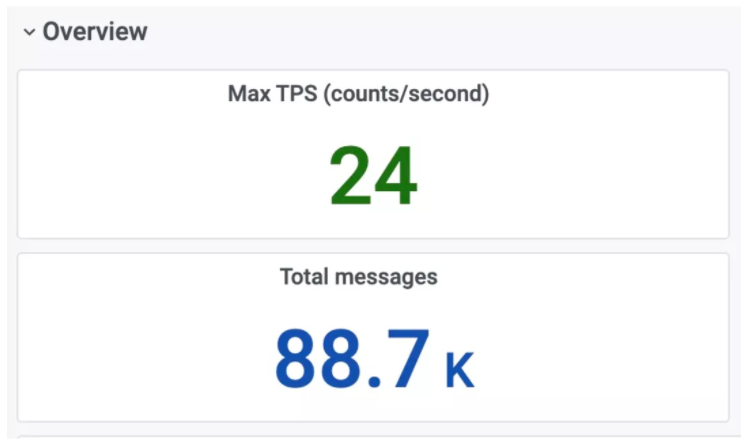
In scenarios of capacity planning, you only need to solve the following three issues:
Solutions:
Solution:
Solutions:
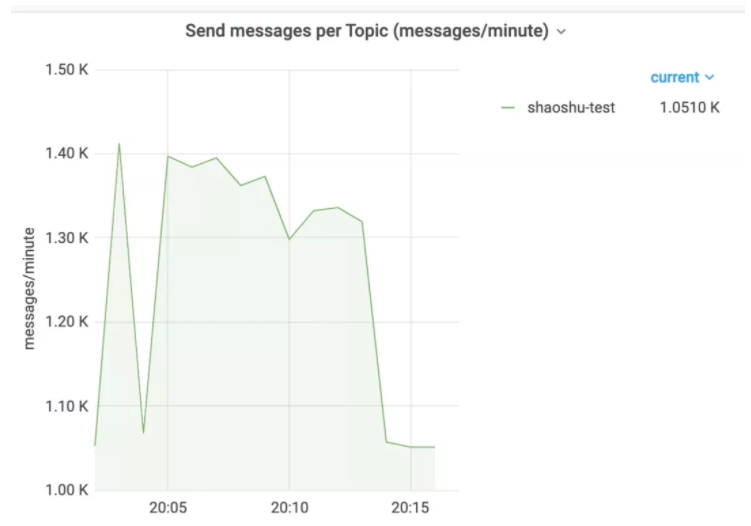
In scenarios of business planning, you mainly need to solve the following three issues:
Solutions:
Solution:
Solution:
This article introduces MQ, concepts, and the features of observability of Message Queue for Apache RocketMQ and the best practices. It shows the capabilities for visualization of observability tools of Message Queue for Apache RocketMQ in the core business process. It is expected to help with daily online troubleshooting and operations and maintenance.
Click here to experience the observability tools of Message Queue for Apache RocketMQ
How to Build a Traffic-Lossless Online Application Architecture – Part 1

212 posts | 13 followers
FollowAlibaba Cloud Native Community - April 13, 2023
Alibaba Cloud Native Community - September 9, 2025
Alibaba Cloud Community - December 21, 2021
Alibaba Cloud Native Community - March 20, 2023
Alibaba Developer - September 7, 2020
Alibaba Cloud Native Community - December 6, 2022

212 posts | 13 followers
Follow Best Practices
Follow our step-by-step best practices guides to build your own business case.
Learn More ApsaraMQ for RocketMQ
ApsaraMQ for RocketMQ is a distributed message queue service that supports reliable message-based asynchronous communication among microservices, distributed systems, and serverless applications.
Learn More Big Data Consulting for Data Technology Solution
Alibaba Cloud provides big data consulting services to help enterprises leverage advanced data technology.
Learn More Big Data Consulting Services for Retail Solution
Alibaba Cloud experts provide retailers with a lightweight and customized big data consulting service to help you assess your big data maturity and plan your big data journey.
Learn MoreMore Posts by Alibaba Cloud Native