By Priyankaa Arunachalam, Alibaba Cloud Community Blog author.
The main aim of of Big Data is to analyze the data and reveal business insights hidden in the data to be able to transform business accordingly. Big data analytics is a combination of various tools and technologies. The collective use of these technologies can assist companies in the process of examining large quantities of data so to uncover hidden patterns and arrive at useful findings. To put things in more practical terms, through gathering and analyzing data about customers and transactions, organizations can make the appropriate judgements in how they run and do their business.
As we continue to walk through the big data cycle, it's time for us to collect and make full use of business intelligence with various BI tools. After transforming data into information using spark, now we are all set to convert this information into insights for which we might need some help of visualisation tools. In this article, we will focus on building visual stories using Apache Zeppelin, an open-source notebook for all your needs including
Apache Zeppelin is a web-based multi-purpose notebook that comes inbuilt with the set of services provided by Alibaba Cloud E-MapReduce. This makes easy for you to process and visualise large datasets with the familiar codes without moving on to a separate set of Business Intelligence (BI) tools.
Zeppelin enables all set of people with interactive data analytics. It provides both data exploration and visualization, as well as sharing and collaboration features to Spark. It supports Python, and also a growing list of programming languages such as Scala, Hive, SparkSQL and markdown. It has in-built visualizations such as graphs and tables which can be used to present our newly found data in a more appealing format. In this article, we will focus on accessing the interface of Zeppelin and explore different ways in which we can present data.
Alibaba E-MapReduce supports Apache Zeppelin. Once the cluster is created, we can see the set of services initiated and running. To access Zeppelin, first step to do is to open the port. On creation of an E-MapReduce cluster, port 22 is accessible by default which is the default port of Secure Shell (SSH) with which we accessed the cluster in our previous articles. We can create security groups and assign the ECS instances to the groups created. The best way is to divide ECS instances by their functions, and put them into different security groups, as each security group is provided with unique access control as required.
To link a security group with a cluster that has already been created, then follow the steps provided below:
Log on to the Alibaba Cloud E-MapReduce console and navigate to the Cluster Management tab at the top of the page. In this cluster overview page, you can see the Security Group ID under Networks tab.
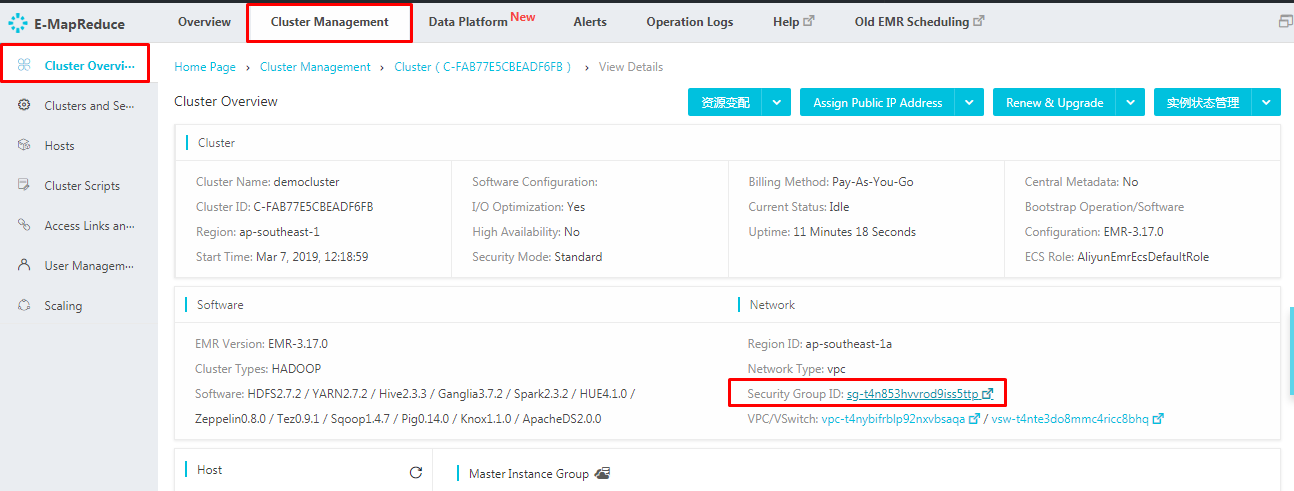
Click on the "Security Group ID" quick link which leads to a page like below. On the left side menu, click Instances in Security Group. This can provide you with the details of security group names of all ECS instances which is been created. If needed, we can also add up the required instances to the created security group as mentioned above.

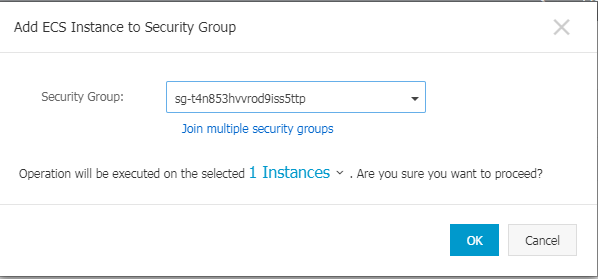
Navigate to Security Groups tab and click Add to Security Group.

In the wizard that follows, select the security group to which the cluster should be linked and click ok
Now let's add the security rules to the group. Navigate to Security Group tab and the rules which are already created will be displayed in this page. As mentioned earlier, port 22 is accessible by default. Now that to access Zeppelin, we have to open port 8080. Let's add a new rule by clicking Add Security Group Rule.

Clicking Add Security Group rule will display a window as below. Specify the needed details and port range.
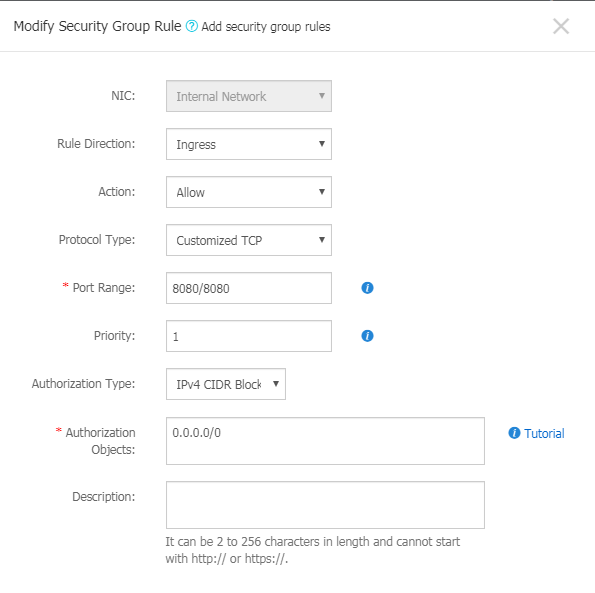
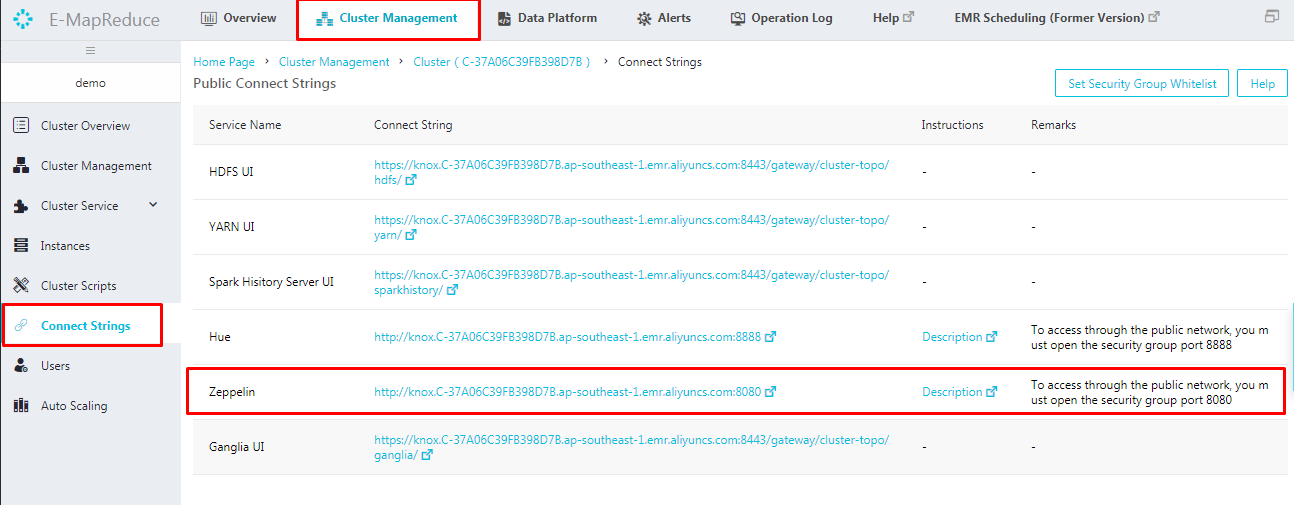
The new rule is added up and we have opened the port successfully. Now we are all set to access Zeppelin. There are two ways to access Zeppelin.
For example, 47.88.171.243:8080 which will lead to the Zeppelin homepage
This leads to the homepage of Zeppelin as shown below. On the homepage, you will have the notebooks which are already created and you will also have options to import your note from local disk or from a remote location by providing the web address.
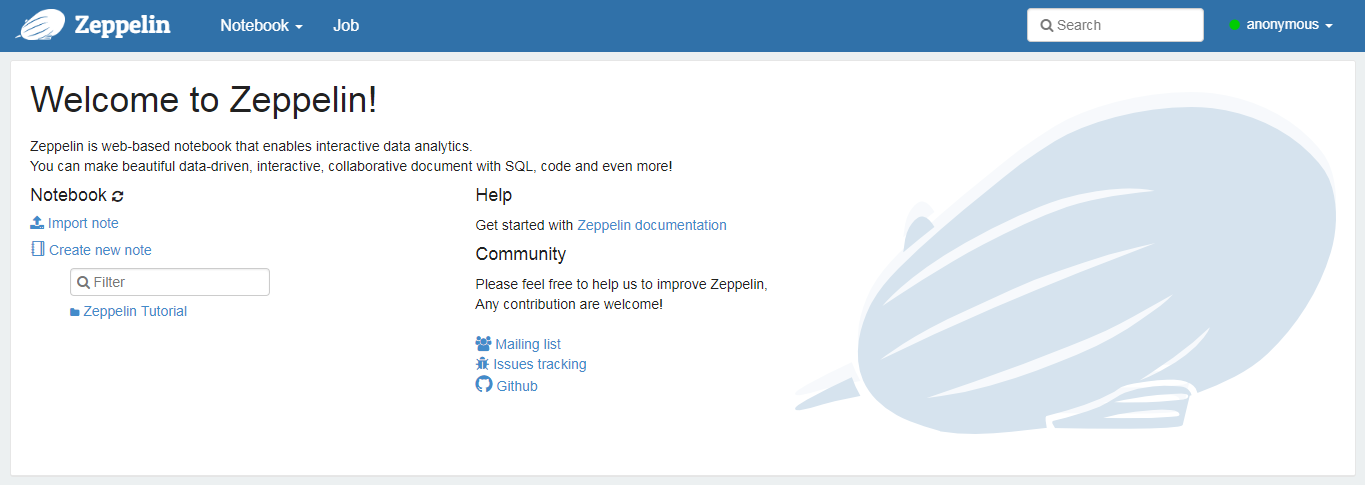
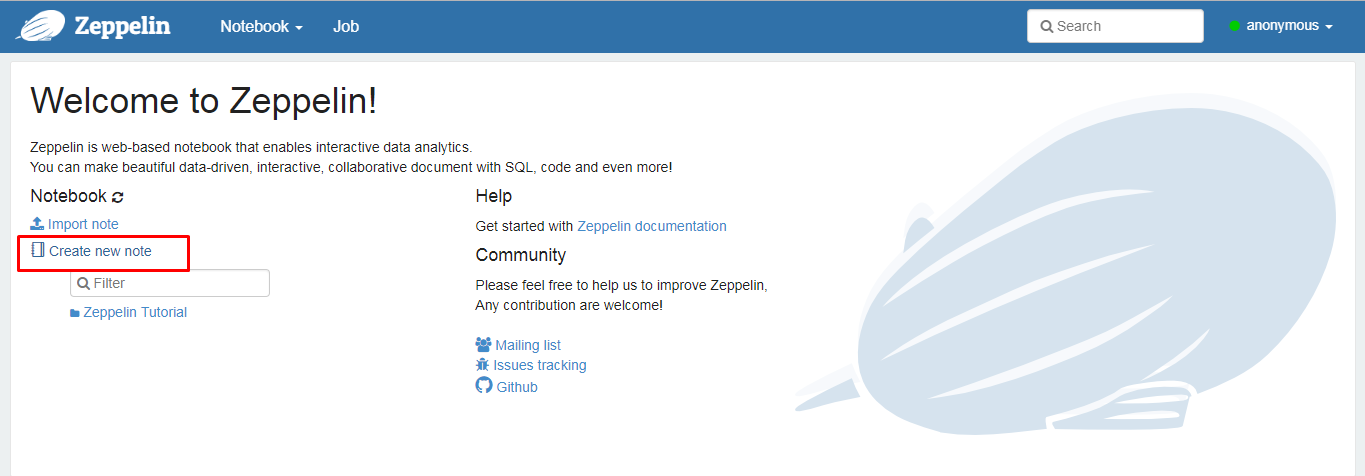
Once the Zeppelin notebook is opened, you are good to create notebooks and play around with visual stories with the languages in which you are comfortable with. Let's create a new notebook by clicking
This will lead to a prompt as below. Give a name to the notebook which you are creating. The default interpreter is spark here and you can choose the interpreter type from the list of options like python, hive, etc.
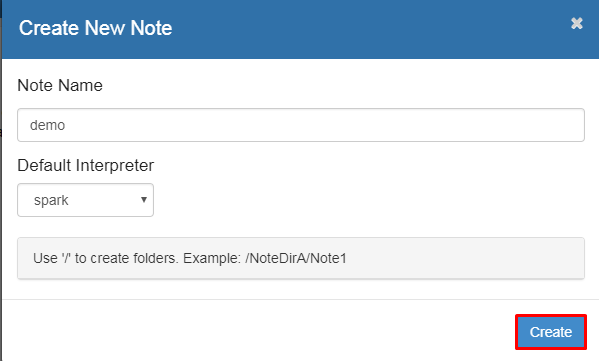
Let's choose spark as the interpreter as we have seen processing of data using spark in our previous article, Drilling into Big Data-Data Preparation . This is easy to start with, as we can carry out with the same code which we used in the spark shell.
Start with %spark.pyspark which is a Pyspark interpreter providing a python environment. Then, read the file as a Dataframe and create a view using spark. Once you complete with the code, click on the Run icon on the right which runs the code and leads to the next step. If the code is successful, the status will be "Finished" and the corresponding output will be displayed. If the code is not successful, the corresponding error message will be displayed.

There are two approaches to visualize DataFrame or a Dataset in Zeppelin
%spark.sql
z.show
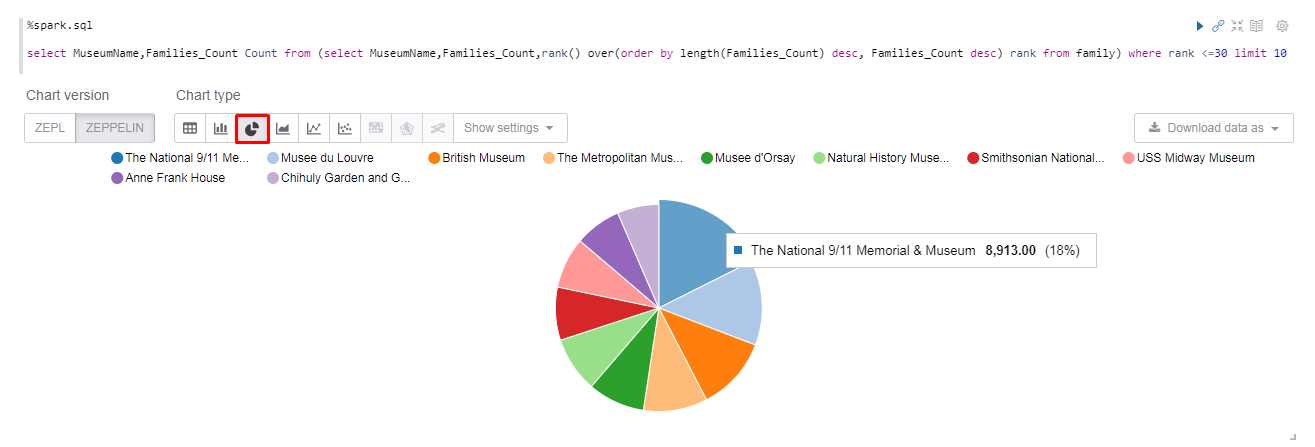
To use SparkSQL, type %spark.sql and query the view which we created. Soon you run this query, the chart types will be displayed at the bottom of the code. Here we can see the Top Museums by Family Count in Table format.
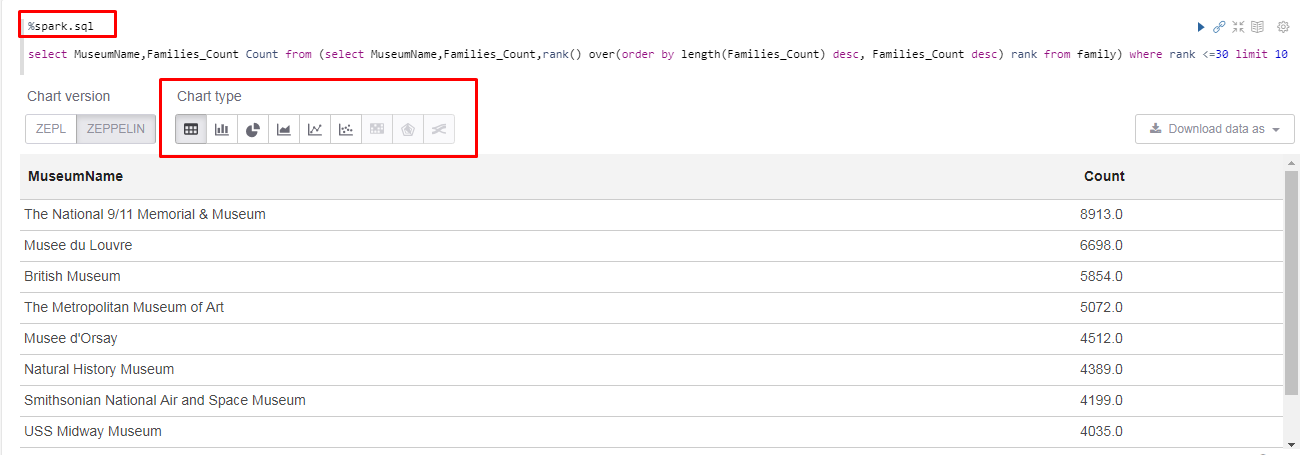
Let's choose Pie chart from the Chart types, to make the visual more interactive. From this chart, the end user can easily identify the top museums in a glimpse.
Similar to this, we can use Pig, Hive, Python, so on, as language backends and a variety of charts to make big data analytics more appealing. On the top-right corner of each paragraph there will be icons to execute the code, hide and show the output, and so on.
Zeppelin is a notebook where each paragraph can be configured according to the user's wish, by clicking on the gear icon. This leads to options like moving the paragraph up/down, giving a suitable title to the paragraph, line numbers and exporting the current paragraph as an iframe. Thus you can have a clean notebook which can be saved for future reference.
Apache Zeppelin interpreter allows any data-processing backend to be plugged into Zeppelin, which is, to use python code in Zeppelin, you need a python interpreter. Every Interpreter belongs to an InterpreterGroup and the interpreters in the same Group can reference each other. For example, SparkSqlInterpreter can refer SparkInterpreter and get SparkContext from it as they are in the same group. As said, other than spark, there are various interpreters like Python, Big query, Hive, Pig, so on, which helps people work easier in their comfortable zone.
Let's go ahead and create a Pig interpreter. From the dropdown on the top left, choose Interpreter.

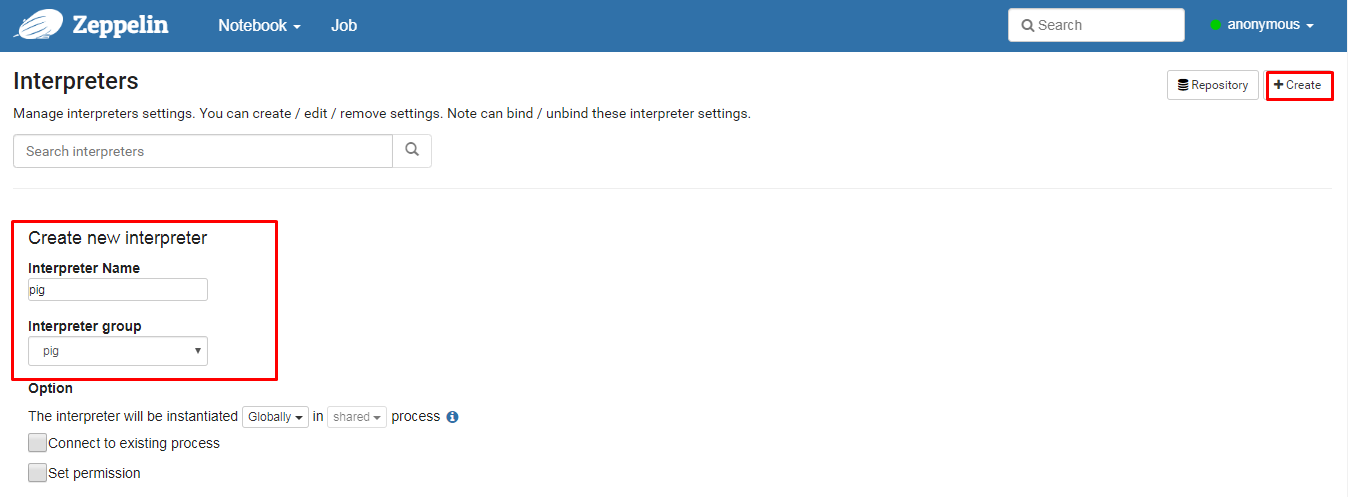
On the Interpreters page, click Create. Enter the name and choose the Interpreter group. This will automatically include the libraries needed. Now the Interpreter is created but it is not binded to the notebook in which we are working. That's where we have to include Interpreter Binding.
To use an Interpreter in a notebook, move to the corresponding notebook and click on the Interpreter Binding icon. This will show the list of Interpreters. Click to bind or unbind the required Interpreter and click on save.
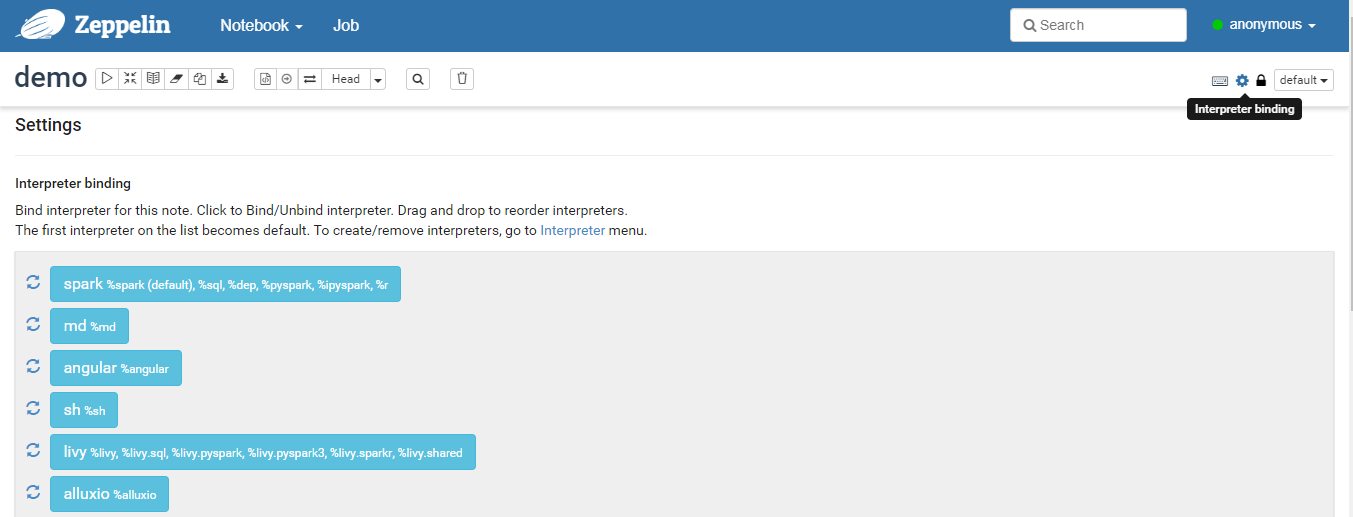

Thus, you can use the newly created interpreter in the notebook you are using.
From identifying and gathering big data from variety of sources, to visualising stories to uncover insights and hidden patterns, we end up with Big Data Analytics. I hope that you enjoyed walking through this cycle of batch processing pipeline in Big Data with various tools and technologies. In future articles, we will focus on the EMR cluster management and Big Data with another set of Alibaba Cloud products.
Cross-Chain Interaction and Continuous Stability Based on SimpleChain Beta

2,598 posts | 769 followers
FollowAlibaba Clouder - August 10, 2020
Alibaba Clouder - September 2, 2019
Alibaba Clouder - September 2, 2019
Alibaba Clouder - July 20, 2020
Farruh - February 19, 2024
Data Geek - April 25, 2024

2,598 posts | 769 followers
Follow MaxCompute
Conduct large-scale data warehousing with MaxCompute
Learn More DataWorks
A secure environment for offline data development, with powerful Open APIs, to create an ecosystem for redevelopment.
Learn More DataV
DataV
A powerful and accessible data visualization tool
Learn MoreMore Posts by Alibaba Clouder