Zhang Cheng, a technical expert, explains how to build a flexible, powerful, reliable, and scalable log system in Cloud Native scenarios.
By Zhang Cheng (Yuanyi), Alibaba Cloud Storage Service Technical Expert
In the previous article Six Typical Issues when Constructing a Kubernetes Log System, we discussed why you need a log system, the importance of the log system in Cloud Native implementations, and the construction challenges with a Kubernetes log system. DevOps, SRE, and O&M engineers have a deep understanding of these aspects. In this article, I will explain how to build a flexible, powerful, reliable, and scalable log system in Cloud Native scenarios.
Architecture Design Driven by Demands
Technical architecture is the process of transforming product requirements into technology implementations. It is essential for all architects to thoroughly analyze product requirements. Many systems have to be reworked soon after they are built because they fail to address the real requirements of products.
Over the past decade, Alibaba Cloud's Log Service team has served almost all in-house teams, covering e-commerce, payment, logistics, cloud computing, gaming, instant messaging, IoT, and many other fields. Over the years, we have optimized and iterated the product features whenever the teams change their requirements for logs.
In recent years, we have served tens of thousands of enterprise users on Alibaba Cloud, including the top Internet clients in major industries in China regarding live broadcasting, short video, news media, and gaming. From serving one company to serving tens of thousands of companies, product features have undergone qualitative changes. Cloud migration urges us to think more deeply: What functions do users require from the log platform? What are the core requirements for logging? How can we meet the requirements of different industries and business roles?
Requirement Analysis and Feature Design
According to the analysis in the previous article, different roles in the company have the following requirements for logs:
- Collects logs in different formats and from different data sources, including non-Kubernetes sources.
- Quickly locate questionable logs.
- Formats semi-structured or non-structured log files and supports fast statistical analysis and visualization.
- Computes in real-time based on logs to obtain business metrics and generates alerts in real-time based on the business metrics. These features are Application Performance Monitoring (APM) features in nature.
- Supports multidimensional association analysis of mega-scale logs with an acceptable latency.
- Supports easy connection to external systems such as a third-party audit system or supports customized data acquisition.
- Implements intelligent alerting, prediction, and root cause analysis according to logs and related time series information. Supports customized offline training to achieve better results.
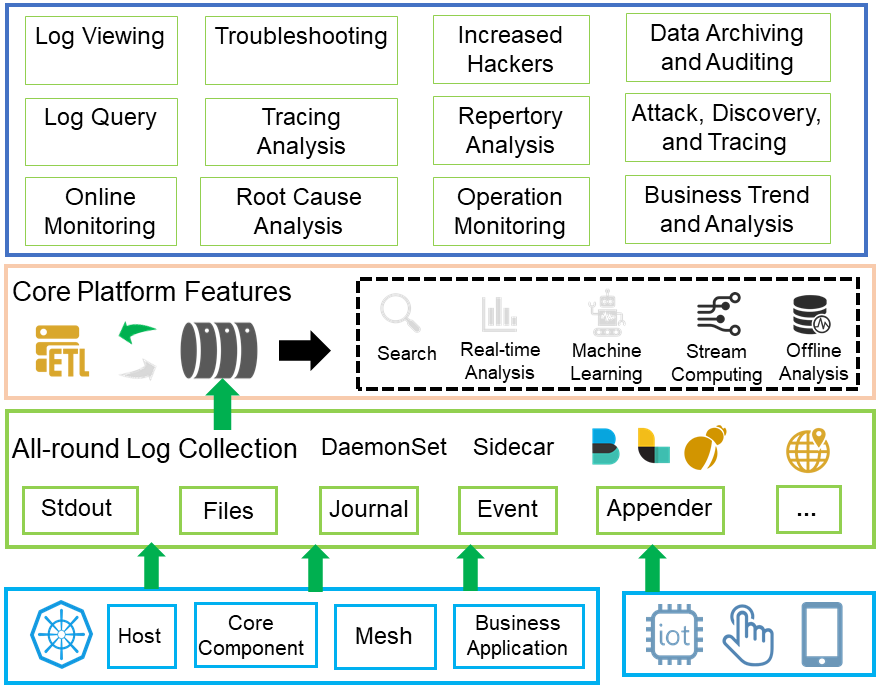
To meet these requirements, the log service platform must provide the following features:
-
All-round log collection: The log service platform needs to support a variety of collection methods such as DaemonSet and Sidecar. It also needs to support data sources such as web, mobile terminals, Internet of Things (IoT), and physical or virtual machines.
-
Real-time log channel: This feature is necessary for upstream or downstream service connection. It ensures that logs can be readily used in multiple systems.
-
Data cleansing: The platform is required to perform extract, transform, and load (ETL) processing on logs in different formats, including filtering, enrichment, transformation, supplementation, splitting, and aggregation.
-
Log display and search: This essential feature of all log platforms allows users to quickly locate logs and view log context by searching for keywords. It looks simple yet requires painstaking work.
-
Real-time analysis: The search feature helps users locate problems, whereas the analysis and statistics feature can help users quickly analyze the root causes of problems and quickly calculate some business metrics.
-
Stream computing: A stream computing framework, such as Flink, Storm, or Spark Stream, is normally used for real-time metric computation or customized data cleansing.
-
Offline analysis: To address requirements related to operations and security requirements, you need multidimensional association analysis of mega-scale historical logs. Currently, such a task is supported only by the T+1 offline analysis engine.
-
Machine learning framework: This feature allows you to easily and quickly integrate historical logs with machine learning frameworks for offline training. Training results can then be uploaded to real-time online algorithm libraries.
Open-Source Solution Design
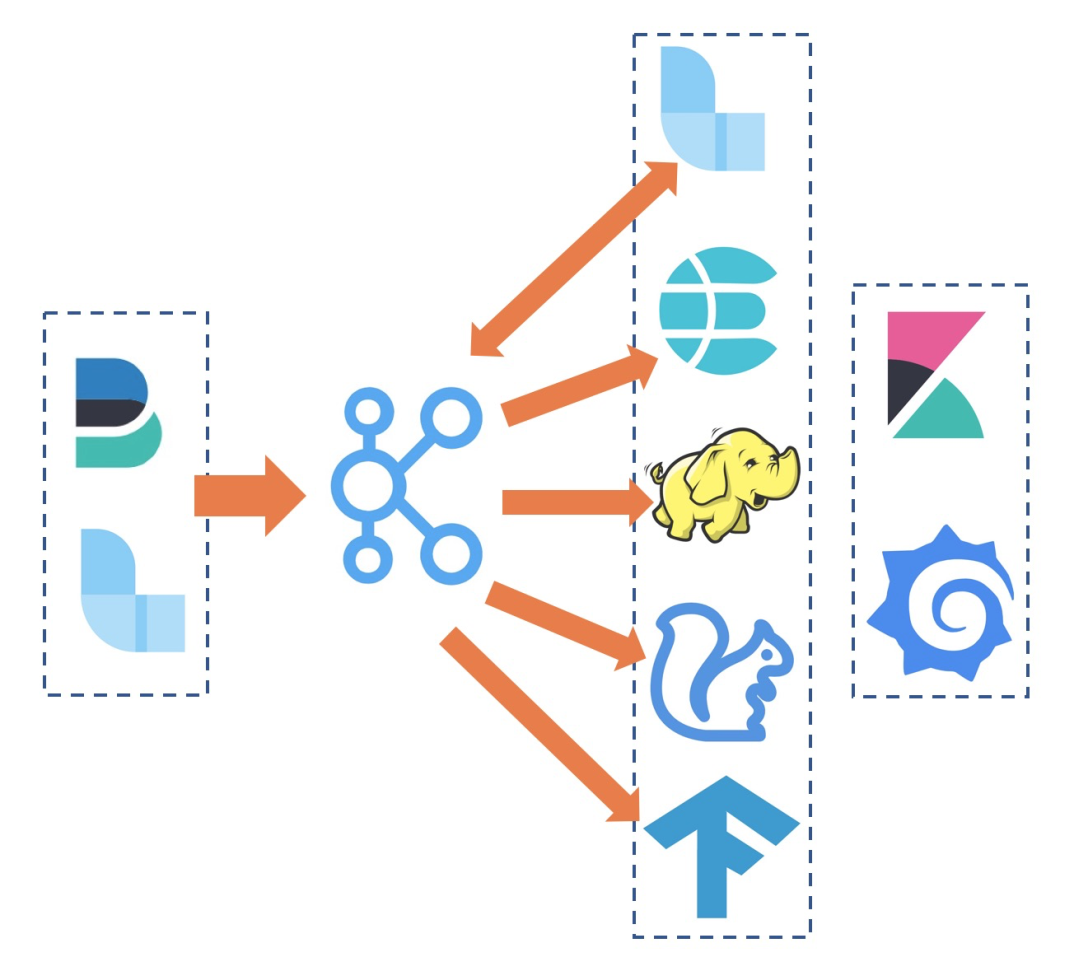
With strong open-source communities, we can easily construct a log platform based on the combination of open-source software programs. The preceding figure shows a typical log platform solution based on ElasticSearch, Logstash, and Kibana (ELK):
- You can use FileBeats, Fluentd, or other agents to collect data from containers in a unified manner.
- You can use Kafka to receive the collected data to enrich the upstream and downstream buffering capabilities.
- The collected raw data needs further cleansing. You can use Logstash or Flink to subscribe to data from Kafka and write the data to Kafka after cleansing.
- You can import the cleansed data to ElasticSearch (ES) for real-time query and retrieval, to Flink for real-time metric computing and alert generation, to Hadoop for offline data analysis, and to TensorFlow for offline model training.
- For data visualization, you can use common components such as Grafana and Kibana.
Why Do You Need a Proprietary Log System?
The combination of open-source software programs is a very efficient solution. Thanks to the strong open-source communities and accumulated experience from a large user base, you can quickly build a system that meets all your needs.
With the system deployed, you can collect logs from containers, query logs on ES, run SQL statements on Hadoop, view graphs on Grafana, and receive alert messages. When all these procedures are streamlined after several days of hard work, you might think you can finally breathe a sigh of relief and sit back in your office chair but this is just the beginning.
The system needs to be tested in the staging environment, test environment, and production environment. Then, the system receives its first application, followed by more applications and more users. At this point, a variety of problems start to emerge:
- As the business volume increases, the log volume snowballs. Kafka, ES, and the connector for synchronizing data from Kafka to ES have to be scaled out. Collection agents are even trickier issues. DaemonSet and Fluentd deployed on each machine cannot be scaled out at all. When the single agent becomes a bottleneck, the only solution is to replace it with Sidecar. This requires a heavy workload and also brings a series of challenges such as integration with CICD systems, resource consumption, configuration planning, and stdout collection.
- Being accessed by more and more core businesses, the system cannot meet the increasing demand for log reliability. For example, the R&D team often reports ES query failures, the operations team complains about inaccurate statistical statements, and the security team requires that data be updated in real-time. Troubleshooting for each issue involves a mass of procedures such as data collection, queuing, cleansing, and transmission, resulting in very high costs. Moreover, you have to set up a monitoring solution for the log system to promptly detect problems. Such a solution must not be log system-dependent or self-dependent.
- When more and more developers use the log platform for troubleshooting, one or two complicated queries may increase the overall system load, blocking all other queries, or even resulting in full garbage collection (GC). In coping with this problem, some enterprises may choose an ES transformation to support multi-tenant data segregation, or build different ES clusters for different business departments. This will lead to heavy workloads for operating and maintaining multiple ES clusters.
- When you are about to pat yourself on the back for finally making the log system stable for daily use, the finance officer comes and warns you that the system is consuming too many machines and costing too much. Then, you must seek ways to optimize costs. The number of machines cannot be reduced because the daily average utilization of most machines is 20-30%, with the peak utilization of 70%. In this case, you have to conduct load shifting, which means another big workload.
The preceding problems often occur in medium-sized Internet enterprises. In large enterprises like Alibaba, the number of similar problems is multiplied.
- No open-source software on the market can meet the high traffic demands of the Double 11 Global Shopping Festival.
- The log system is used by thousands of business applications and engineers simultaneously. This requires highly refined control over concurrency and multi-tenant data segregation.
- In many core scenarios such as orders and transactions, the overall link availability must be stably maintained at 99.999% or 99.9999%.
- Cost optimization is essential because the system has to process a large amount of data every day. A 10% reduction in costs can be worth hundreds of millions of RMB to the company.
Alibaba Cloud Kubernetes Log Solution
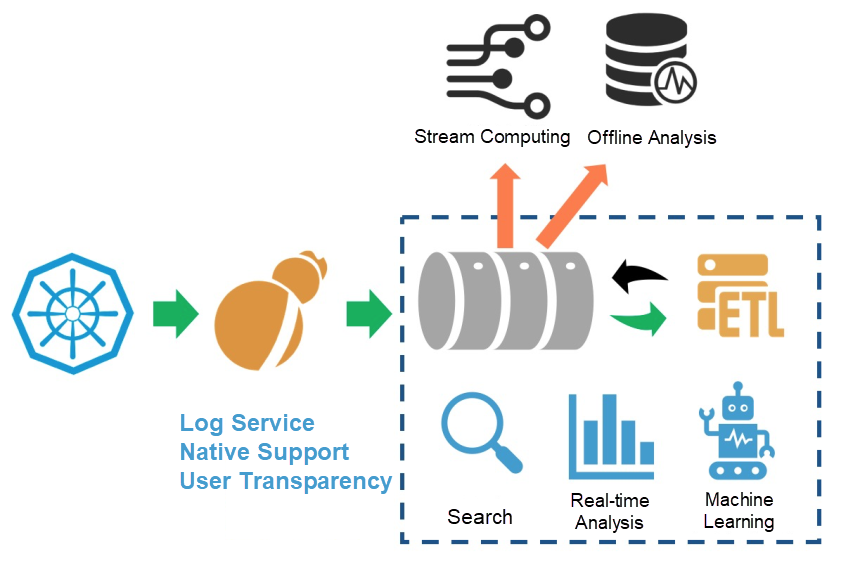
To cope with the preceding problems, we have developed a Kubernetes log solution over the years:
- Use Logtail to collect Kubernetes logs in an all-round manner. Logtail is a proprietary log collection agent of Alibaba Cloud. Now, millions of Logtail agents are deployed throughout Alibaba Group. The performance and stability of Logtail have been proved by multiple Double 11 Global Shopping Festivals.
- Implement native integration with data queues, cleansing and processing, real-time retrieval, real-time analysis, and AI algorithms. Compared with the stacking of various open-source software, the native integration method greatly shortens data links, reducing the possibility of errors.
- Customize and optimize data queues, cleansing and processing, retrieval, analysis, and AI engines for different log service scenarios. In this way, the solution can meet requirements such as high throughput, dynamic scaling, querying hundreds of millions of logs in seconds, low costs, and high availability.
- Implement seamless integration to support stream processing, offline analysis, and other common requirements. Currently, our log service supports seamless integration with dozens of downstream open-source and cloud products.
This system is supporting the entire Alibaba Group, Ant Financial, and tens of thousands of enterprises in the cloud with log analysis capabilities. More than 16 PB of data is written into the system every day. The system is facing many development and O&M challenges.
Summary
This article describes how to build a Kubernetes log analysis platform from the perspective of architecture, including an open-source solution and an Alibaba Cloud proprietary solution. However, we still have a lot to do to effectively run this system in the production environment:
- How can we perform logging in Kubernetes?
- Which log collection solution better matches Kubernetes, DaemonSet or Sidecar?
- How can we integrate the log solution with CICD systems?
- How can we classify the log storage of each application in the microservice architecture?
- How can we perform Kubernetes monitoring based on Kubernetes system logs?
- How can we monitor the reliability of the log platform?
- How can we configure automatic inspection for multiple microservices or components?
- How can we automatically monitor multiple sites and quickly identify traffic exceptions?
The first article of this blog series is available by clicking here.


 Simple Log Service
 Managed Service for Prometheus
 Container Service for Kubernetes
 Container Compute Service (ACS)