By Zhang Cheng (Yuanyi), Alibaba Cloud Storage Service Technical Expert

Based on the considerations for Kubernetes log output described in the previous article, this article focuses on the ultimate purpose of log output, which is to collect and analyze logs in a unified manner. Log collection in Kubernetes is very different from common virtual machines. It involves greater implementation difficulty and higher deployment costs. However, if properly used, it can benefit you with higher automation and lower O&M costs compared to conventional methods. This article is the fourth in the Kubernetes-related series.
Log collection in Kubernetes is a lot more complicated than in conventional virtual machines or physical machines. The most fundamental factor is that Kubernetes blocks underlying exceptions and provides finer-grained resource scheduling, to deliver a stable and dynamic environment. As a result, the Kubernetes log collection is faced with more diversified and dynamic environments with more that need consideration.
For example:
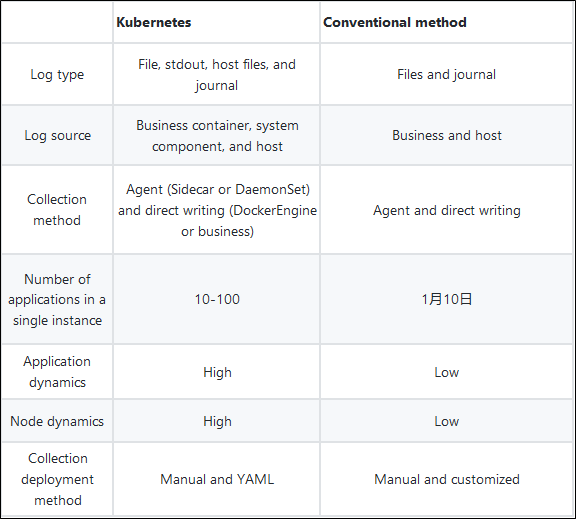
Log collection methods are divided into passive collection and proactive push. In Kubernetes, passive collection includes Sidecar and DaemonSet, and proactive push includes DockerEngine and business direct writing.

In summary:
The following table summarizes the comparison between these collection methods:
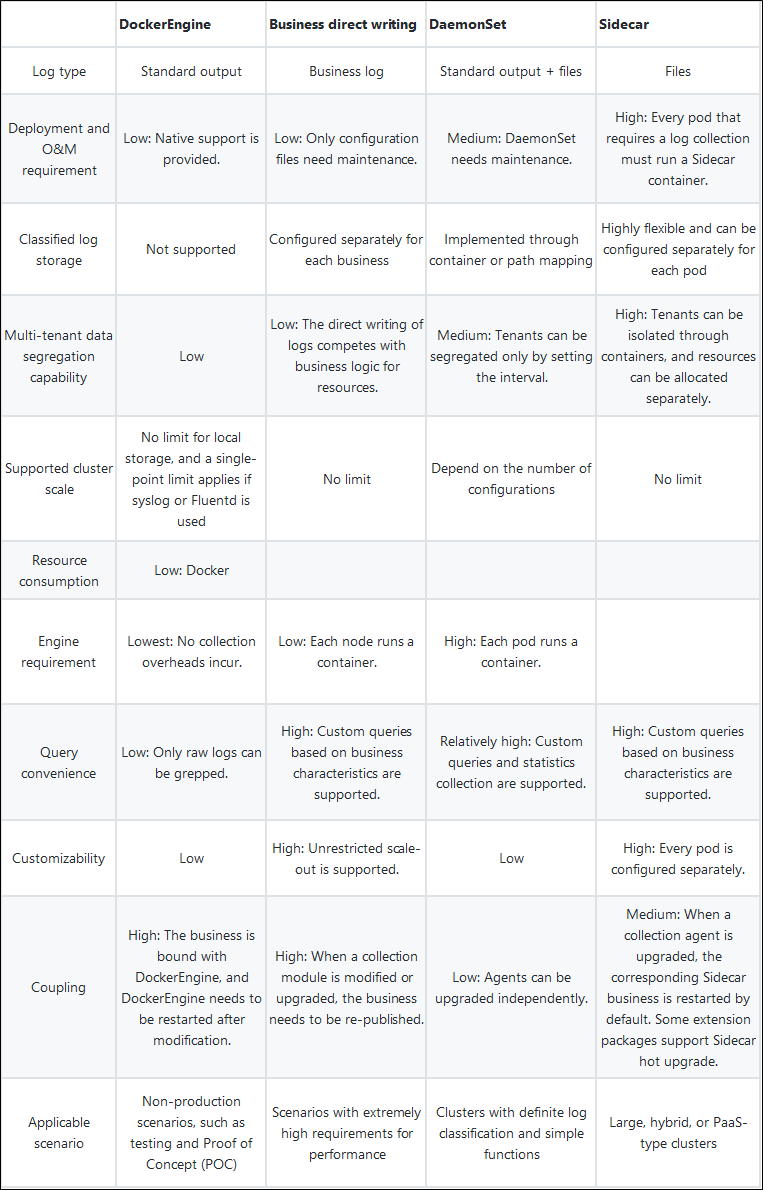
Unlike virtual machines or physical machines, Kubernetes containers support the standard output mode and the file mode. In containers, logs are directly output to stdout or stderr in standard output mode. DockerEngine takes over the stdout or stderr file descriptor and processes the received logs according to the LogDriver rules configured for the DockerEngine. In containers, logs can be written into files in a similar way as physical machines or virtual machines. The logs can be stored in different ways such as default storage, EmptyDir, HostVolume, and NFS.
Docker officially recommends using stdout to output logs. However, this recommendation is based on scenarios where containers are used as simple applications. In business scenarios, we recommend that you use the file mode whenever possible. The main reasons are:
We recommend using file mode for outputting logs of online applications and using stdout only for single-function applications, Kubernetes systems, or O&M components.
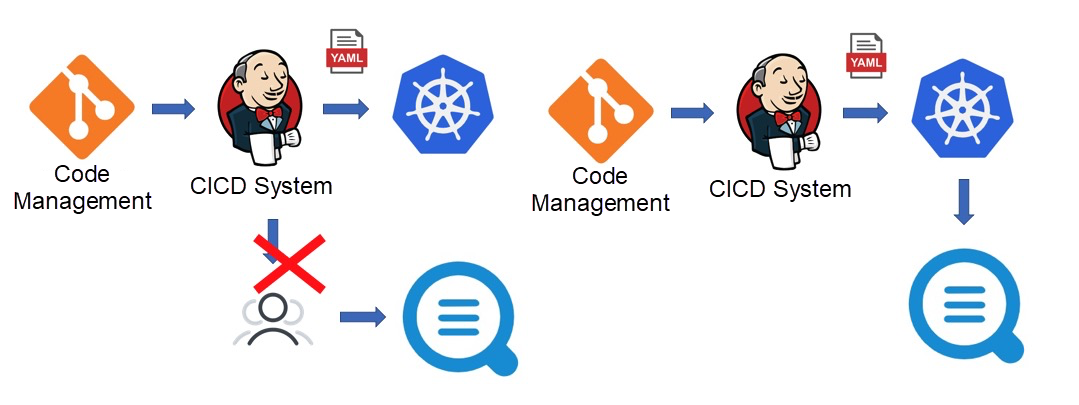
Kubernetes provides a standard business deployment process. You can use YAML (a Kubernetes API) to declare routing rules, expose services, mount storage, run businesses, and define scaling rules. Kubernetes can be easily integrated with CICD systems. Log collection is another important part of O&M and monitoring. After a business goes online, all logs must be collected in real-time.
According to the original method, you have to manually deploy log collection logic after a service is published. This goes against the purpose of CICD automation. To implement automation, some engineers encapsulate an automatically deployed service based on the log collection API or SDK, and then trigger calls through the webhook of CICD after the service is published. This method is expensive.
Kubernetes provides a standard log integration method. It allows you to register logs as a new resource with the Kubernetes system for management and maintenance through operators (Custom Resource Definitions (CRDs)). In this way, the CICD system does not require additional development. Instead, you only need to add log-related configurations when integrating the CICD system to Kubernetes.
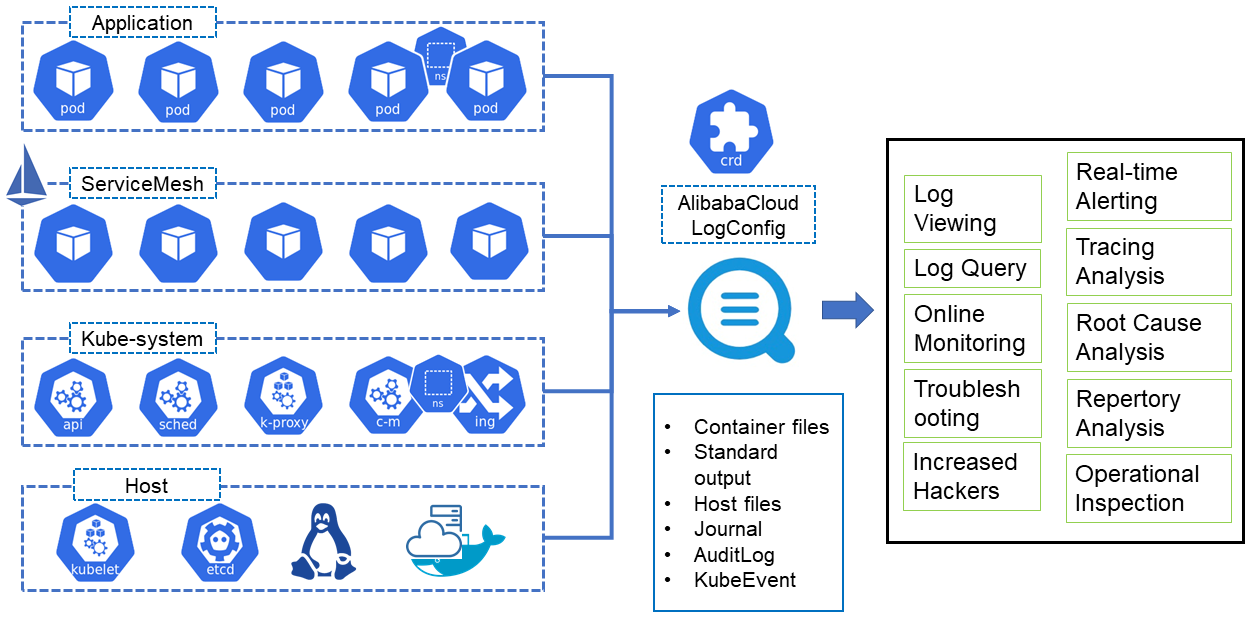
The development of log collection solutions for container environments started before Kubernetes. With the performance of Kubernetes becoming more stable overtime, we began to migrate many businesses to the Kubernetes platform. Now, we have developed a log collection solution for Kubernetes. This solution provides the following benefits:
This collection solution is now available to the public. We have provided a Helm installation package that contains Logtail, DaemonSet, AliyunlogConfig CRD declarations, and CRD Controller. After the installation is completed, you can use the DaemonSet collection method and CRD configurations. You can install the components like this:
Once the components are installed, Logtail and the corresponding Controller run in the cluster but these components do not collect any logs by default. Instead, you must configure log collection rules to collect logs from a specified pod.
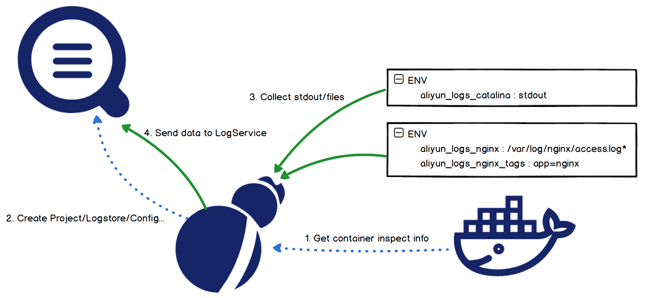
In addition to manual configuration in the Log Service console, Kubernetes supports another two options to configure collection rules: environment variables and CRDs.
This method features easy deployment and low learning costs. However, it supports few configuration rules and does not support most advanced configurations such as parsing methods, filtering methods, blacklists, and whitelists. Even worse, an address declared in this way cannot be modified or deleted. To specify another address, you have to create another collection configuration. You must also clear historical collection configurations to avoid the waste of resources.
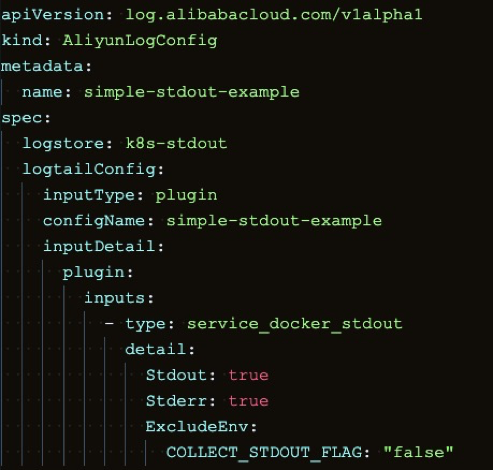
The following is a sample deployment for collecting container standard output. In this example, both stdout and stderr will be collected, excluding containers with environment variables containing:
COLLEXT_STDOUT_FLAG:false.The CRD-based method allows you to manage your configuration as standard Kubernetes extension resources. It supports complete semantics for configuration addition, deletion, modification, and search, and supports a variety of advanced configurations. In short, the CRD-based configuration method is highly recommended for data collection.
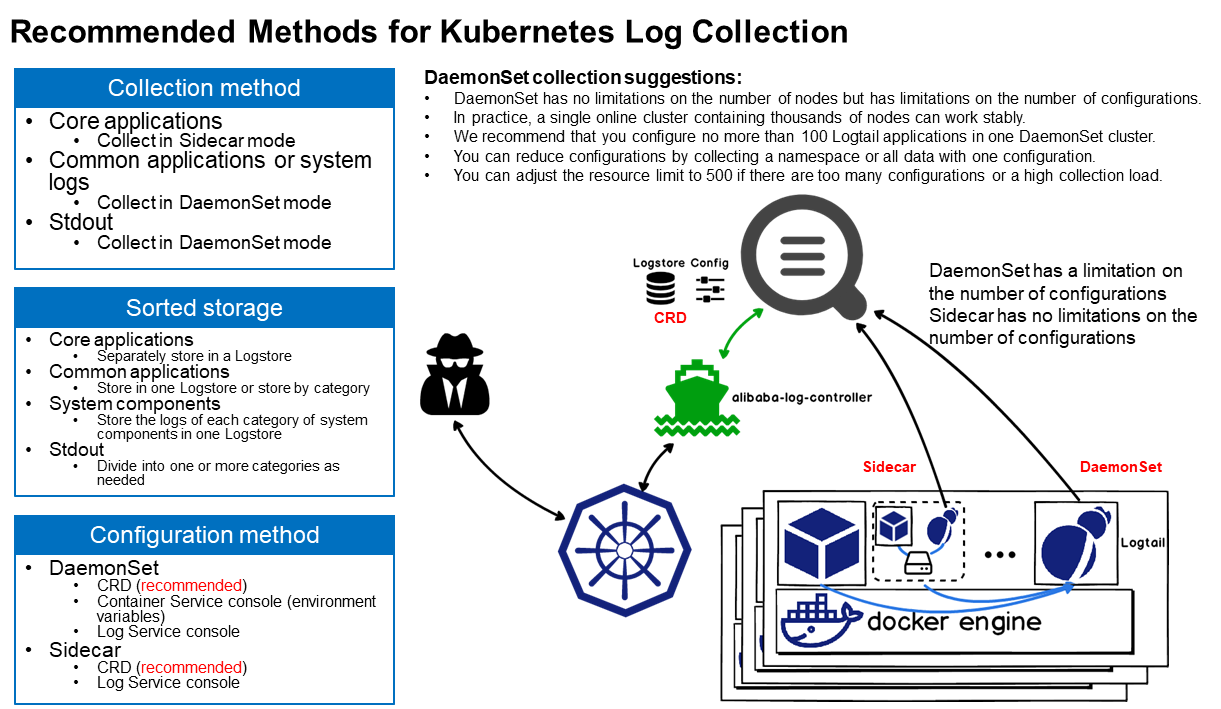
In practical application scenarios, DaemonSet is used alone or in combination with Sidecar. DaemonSet benefits you with high resource utilization. All DaemonSet Logtail components share global configurations. Single Logtail can only support a limited number of configurations. Therefore, DaemonSet cannot support clusters with a large number of applications. Recommended configuration is shown in the preceding figure. The core ideas are:
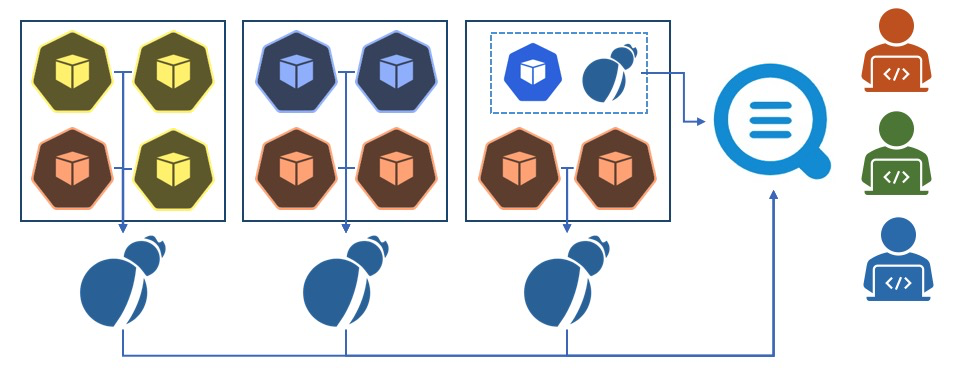
The vast majority of Kubernetes clusters are small- and medium-sized ones without a definition. Generally, a small- or medium-sized Kubernetes cluster contains less than 500 applications and less than 1,000 nodes. Such a cluster does not have a clearly defined Kubernetes platform O&M team. Since there are not many applications, DaemonSet is sufficient to support all collection configurations.
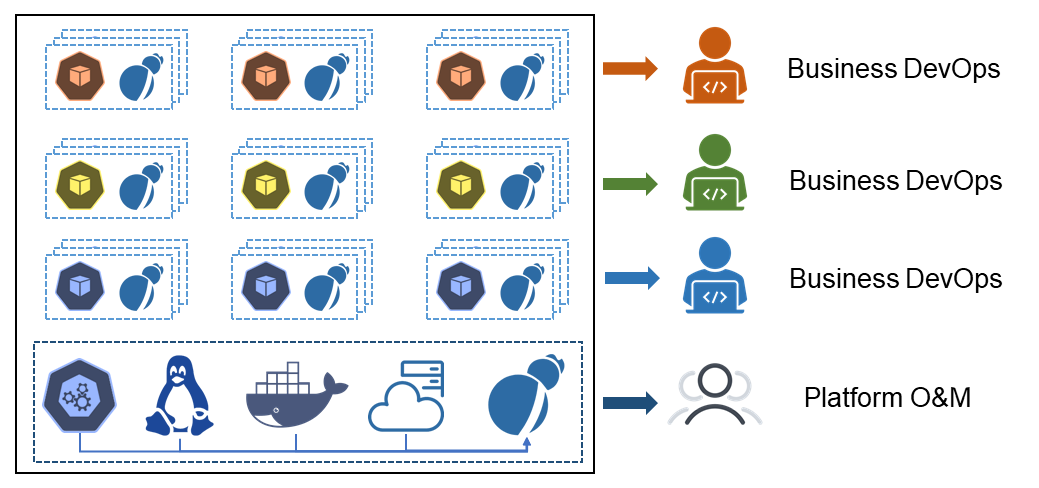
Some large and ultra-large clusters are used as PaaS platforms that host more than 1,000 businesses and more than 1,000 nodes. They have dedicated Kubernetes platform O&M teams. Since the number of applications is unlimited in this scenario, DaemonSet alone cannot support all the configurations. Therefore, you must use the Sidecar mode. The overall plan is:
The first article of this blog series is available here.

672 posts | 56 followers
FollowDavidZhang - December 30, 2020
Alibaba Cloud Community - February 20, 2024
Alibaba Container Service - July 16, 2019
Alibaba Cloud Native - November 6, 2024
Alibaba Container Service - October 13, 2022
Alibaba Cloud Blockchain Service Team - January 17, 2019

672 posts | 56 followers
Follow Simple Log Service
An all-in-one service for log-type data
Learn More Managed Service for Prometheus
Multi-source metrics are aggregated to monitor the status of your business and services in real time.
Learn More Container Service for Kubernetes
Alibaba Cloud Container Service for Kubernetes is a fully managed cloud container management service that supports native Kubernetes and integrates with other Alibaba Cloud products.
Learn More Container Compute Service (ACS)
A cloud computing service that provides container compute resources that comply with the container specifications of Kubernetes
Learn MoreMore Posts by Alibaba Cloud Native Community