By Zhongyan
With the continuous evolution of observability technologies, most enterprises have widely adopted application performance monitoring (APM), tracing, and logging solutions to enhance their business monitoring capabilities. This trend is particularly evident in the Internet industry, in which user experience directly affects service reputation and determines the service market. As a result, Real User Monitoring (RUM) is increasingly valued. However, experience issues such as application black screens and slow page loading caused by backend service failures such as backend interface delays may occur. In this case, effectively integrating RUM, APM data, and trace contexts for troubleshooting and impact assessment has become a significant challenge.
The key to overcoming this challenge is to enable end-to-end tracing from client to server by using RUM as the natural starting point for user monitoring. This article describes solutions to build end-to-end tracing and provides best practices for integrating RUM into end-to-end tracing.
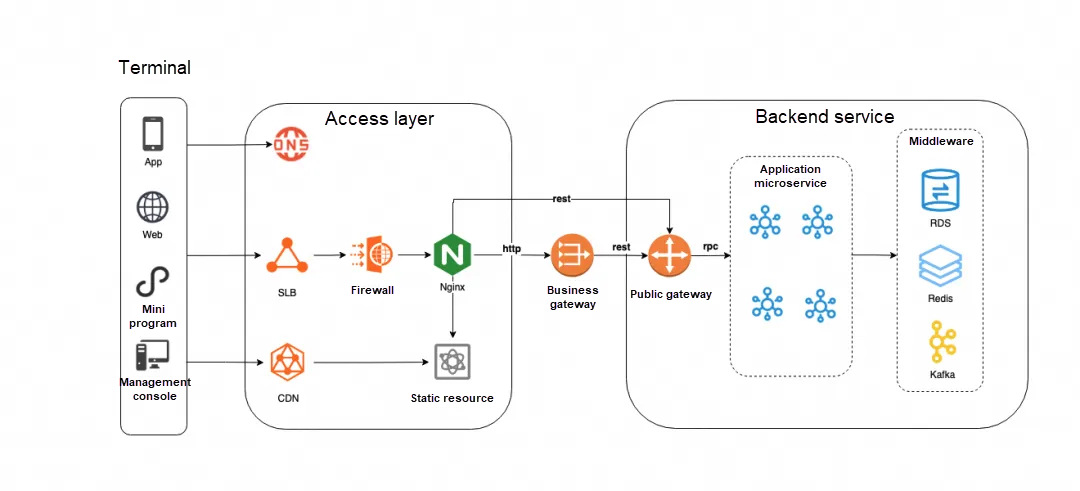
A typical Internet application generally consists of multiple components such as the frontend, including web applications, mini programs, and Android and iOS apps, the gateway proxy layer, including Application Load Balancer (ALB), Microservices Engine (MSE), Ingresses, and NGINX, the backend services deployed in Java, Go, and Python, and the middleware such as databases, messaging systems, and caching. When you enable end-to-end tracing for an application that involves frontend and backend development, middleware, and O&M teams, the following challenges may be posed:
1) Different tracing tools support different mainstream languages and frameworks. This poses challenges in multi-terminal scenarios.
| Supported language | |
|---|---|
| OpenTelemetry | Includes Java, Python, Go, JavaScript, .NET, Ruby, PHP, Erlang, Swift, Rust, and C++ |
| SkyWalking | Includes Java, .NET, Node.js, PHP, Python, Go, Ruby, Lua, and OAP |
| Zipkin | Includes Java,Node.js, Ruby, Go, Scala, and Python |
| Jaeger | Includes Java, Python, Go, C++, C#, and Node.js |
2) The collaboration of frontend and backend developers, middleware teams, and O&M personnel to implement end-to-end tracing in the production environment generates high integration costs.
3) Difficulties arise in integrating RUM and APM-based monitoring data and logging for troubleshooting and fault definition into end-to-end tracing.
Major tracing analysis systems such as OpenTelemetry, Zipkin, Jaeger, and SkyWalking support different trace propagation protocols to enable end-to-end tracing:
• OpenTelemetry: W3C
• SkyWalking: sw8 (SkyWalking V3)
• ZipKin: B3 single-header and multi-header
• Jaeger: Jaeger
Compatibility issues may occur between different trace propagation protocols. For example, the trace propagation protocols supported by OpenTelemetry and SkyWalking are incompatible. In addition, the trace propagation protocols supported by different vendors and open source projects vary. The following table describes whether trace propagation protocols are supported by specific tracing analysis projects.
| W3C | B3 single-header and multi-header | Jaeger | OpenTracing | sw8 | |
|---|---|---|---|---|---|
| OpenTelemetry | ✓ | ✓ | ✓ | ✓ | ✗ |
| SkyWalking | ✗ | ✗ | ✗ | ✗ | ✓ |
| Zipkin | ✗ | ✓ | ✗ | ✗ | ✗ |
| Jaeger | ✓ | ✓ | ✓ | ✗ | ✗ |
In most cases, the following requirements must be met to enable end-to-end tracing: the backend systems must use the same or compatible trace propagation protocols, the required SDKs for the frontend applications must be installed, and trace data must be propagated throughout the middleware components, including at the gateway proxy level.
A significant trend in the development of the observability industry in recent years is the continuous integration of standardization and open source ecology. OpenTelemetry and W3C Trace Context are representative projects of this trend. The following sections describe the OpenTelemetry and W3C-based end-to-end tracing solutions from the following dimensions: trace propagation scenarios, trace propagation protocols, and cross-protocol compatibility.
OpenTelemetry uses propagators to propagate trace contexts in different environments and protocols. This ensures that complete traces can be tracked in a distributed system. Trace contexts can be propagated within or across processes. The core mechanism is to include required tracing information in the headers of specific formats. The following section describes how trace contexts are propagated in different scenarios:
• Single-thread scenarios: All operations are performed on the same thread in a single-thread environment. Therefore, you can store the information about the active span by using a local variable, such as the ThreadLocal variable in Java. When a new operation starts, the span within the current scope can be used as the parent span to propagate trace contexts.
• Multi-thread or asynchronous scenarios: In a multi-thread asynchronous programming scenario, you must explicitly carry the active span context when you submit a task or make asynchronous calls. For example, you can call the context.with(currentSpan) operation of OpenTelemetry to create a new context, associate the context with the active span, and perform operations within the scope of this context. This ensures that trace context is correctly propagated and applied during asynchronous execution.
• Scenarios in which the HTTP protocol is used: The trace contexts are generally encoded in the HTTP request headers. For example, the W3C Trace Context standard uses the traceparent and tracestate headers to propagate trace contexts. When a request is sent from a client, the trace context is automatically injected into the HTTP headers. After the server receives the request, the server parses the headers by using the corresponding propagators and decides whether to restore or pass the trace context.
• Scenarios in which the remote procedure call (RPC) and other custom protocols are used: The mechanism for using other protocols, such as gRPC and MQTT, is similar to that of using the HTTP protocol. The trace contexts are included in the headers or metadata fields supported by the used protocol. OpenTelemetry provides a variety of propagators such as Jaeger, B3, and W3C baggage. You can select an appropriate propagator to serialize or deserialize trace contexts based on the requirements of the protocol that you use.
• Message queue scenarios: Information such as the trace ID and span ID is generally sent together with the messages as attributes or metadata of the messages. The receiver can extract the information from the messages and restore the trace contexts.
• Database scenarios: The underlying protocols of mainstream databases, such as MySQL and PostgreSQL, do not provide extension mechanisms for trace propagation. As a result, most tracing tools, including OpenTelemetry, rely on client-side instrumentation to record key information, such as time consumption and SQL execution, on the application side.
The following section describes W3C Trace Context, which is the most widely used protocol standard around the world. W3C Trace Context is a specification developed by W3C. This protocol aims to standardize the propagation format of trace information in distributed tracing systems. In addition to HTTP protocol scenarios, W3C Trace Context also applies to binary protocols and message-related scenarios. The standards for using W3C Trace Context in non-HTTP scenarios are still in the draft stage. For more information, visit the official website of W3C.

The W3C Trace Context standard defines two HTTP headers for trace context propagation: traceparent and tracestate.
1. traceparent: uses the Augmented Backus-Naur Form (ABNF) notation and is composed of four fields.
traceparent: {version}-{trace-id}-{parent-id}-{trace-flags}• version: a 2-digit hexadecimal number that indicates the trace context version. Example: 00.
• trace-id: a 32-digit hexadecimal number that indicates the unique ID of the whole trace. Example:ec95e5a118ce450eac82ab9ec530b287.
• parent-id: a 16-digit hexadecimal number that indicates the unique ID of the current request or operation. Example: a7be58f9cd8dd80d.
• trace-flags: a 2-digit hexadecimal number that indicates the flags used to control tracing-related behaviors such as indicating whether a trace is sampled and setting the tracing level. Example: 01.
2. tracestate: an extension of the traceparent field. The tracestate field carries additional trace context information that may be required for different services. The tracestate field is the companion header of the traceparent field.
tracestate: {vendor1Key}={vendor1Value},{vendor2Key}={vendor2Value},...| Propagator | Protocol standard |
|---|---|
| tracecontext | W3C Trace Context |
| baggage | W3C Baggage |
| b3 | B3 |
| b3multi | B3 multi-header |
| jaeger | Jaeger |
| opentracing | OpenTracing |
| xray | AWS X-Ray |
OpenTelemetry supports most trace propagation protocols except sw8, provides built-in propagators of specific cloud vendors, and supports custom propagators. You can combine different propagators or implement your custom propagator based on the text map propagator of OpenTelemetry.
RUM is the natural starting point for end-to-end tracing because RUM tracks the behaviors of a user from the moment the user initiates a request. After RUM generates a trace ID, the trace context is injected into the HTTP headers and is propagated to the backend systems. The trace context is then passed within the backend systems after the backend systems initialize the trace context based on the trace propagation protocol.
| Protocol | HTTP request header format | References |
|---|---|---|
| tracecontext | traceparent: {version}-{trace-id}-{parent-id}-{trace-flags}tracestate: rum={version}&{appType}&{pid}&{sessionId} | Trace Context |
| b3 | b3: {TraceId}-{SpanId}-{SamplingState}-{ParentSpanId} | b3-propagation |
| b3multi | X-B3-TraceId: {TraceId}X-B3-SpanId: {SpanId}X-B3-ParentSpanId: {ParentSpanId}X-B3-Sampled: {SamplingState} | b3-propagation |
| jaeger | uber-trace-id: {trace-id}:{span-id}:{parent-span-id}:{flags} | Client Libraries |
| sw8 | sw8: {sample}-{trace-id}-{segment-id}-{0}-{service}-{instance}-{endpoint}-{peer} | SkyWalking protocols for cross-process trace propagation |
Compared with installing SDKs for open source protocols on the application side, integrating RUM into tracing has the following benefits:
• The errors, delays, and session data monitored by RUM can be used in conjunction with trace data to implement end-to-end analysis. For example, if a user initiates a request that takes an extended period of time to execute on the application side, but the time consumption displayed in the backend is not long. In this case, RUM can be used along with backend trace data for troubleshooting. In this example, the extended time may be due to delays at the DNS and networking layers.
• You do not need to install SDKs for open source protocols on the application side or report the trace data of the application. If your application has multiple backend domain names that support different protocols, you can use RUM to specify the corresponding protocol for each domain name. This way, the application can be monitored by only integrating RUM. This reduces integration costs.
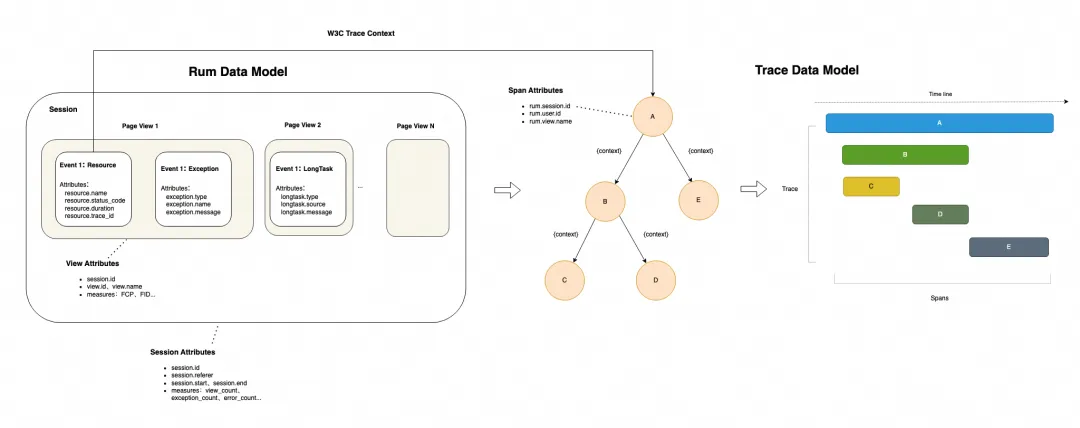
The data models of mainstream RUM open source projects and cloud vendors take users and sessions as the core. RUM records page loading, resource requests of frontend users, and abnormal data such as request errors, JS errors, crashes, stuttering, and custom errors in the form of event. The resource requests include requests by calling API operations and requests of static resources. You can call API operations to associate RUM data with backend trace data to obtain end-to-end trace data from frontend clients to backend services. The event-based RUM data models can be transformed into span-based trace data models.
| RUM field | OpenTelemetry span field |
|---|---|
| rum.resource.trace_id | traceId |
| rum.resource.trace.carrier in the W3C traceparent specification | spanId |
| rum.resource.name | spanName |
| rum.resource.timestamp | startTime |
| rum.resource.duration | duration |
| rum.resource.net.ip | ip |
| rum.resource.status_code | spanStatus |
| rum.resource.trace.carrier in the W3C tracestate specification | tracestate |
| rum.resource.ip and rum.sessionid | resource |
| rum.user.id, rum.session.id, and rum.view.name | attributes |
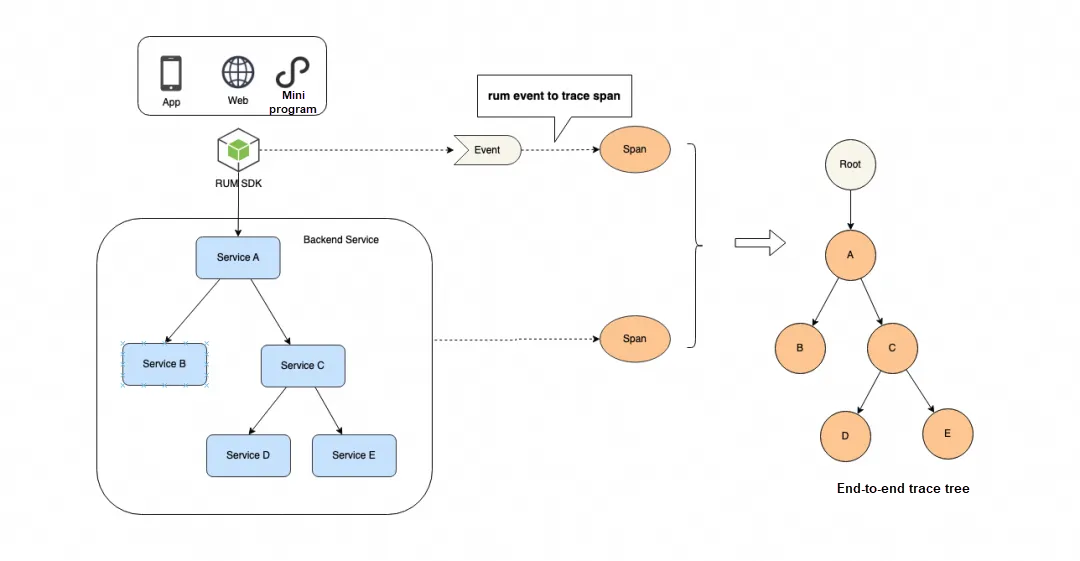
To transform RUM events to spans, you must import an OpenRUM SDK to your application. After RUM generates a trace context, the trace context is propagated to the data receiving side. The RUM events are then transformed to spans. The RUM-related data, such as the users, sessions, and views are injected into the span attributes. This way, RUM is integrated into end-to-end tracing to facilitate error identification and impact assessment during online troubleshooting.
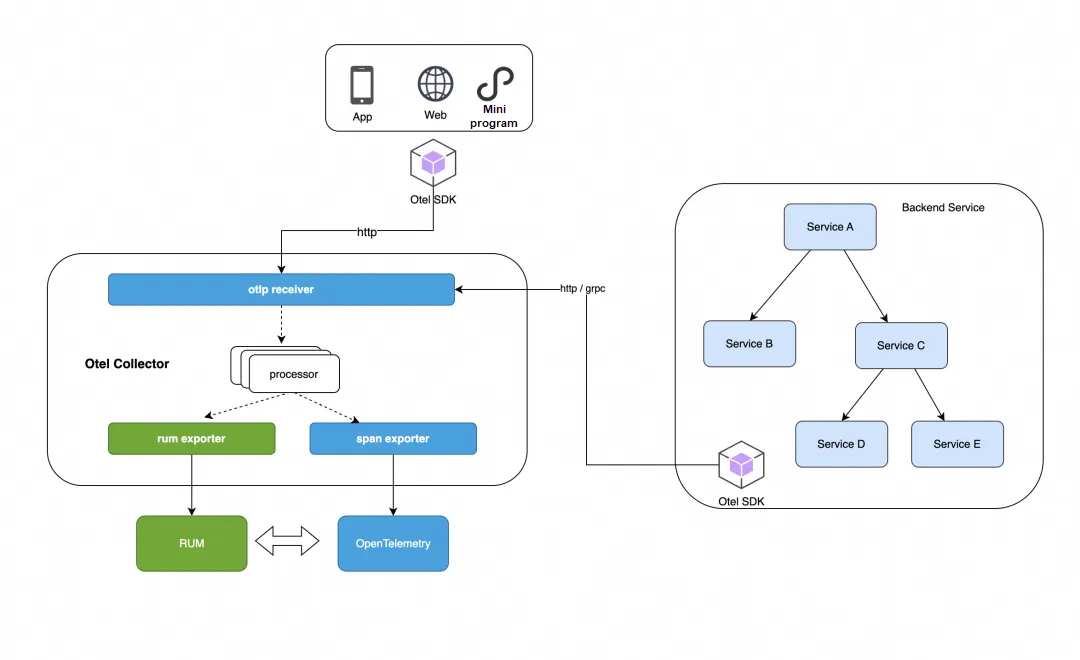
To transform spans to RUM events, you must import an OpenTelemetry SDK to your application, implement a custom RUM exporter in the OpenTelemetry Collector based on the extension mechanism, and then transform the spans reported by the OpenTelemetry SDK to RUM events. Alternatively, you can import an OpenRUM SDK and an OpenTelemetry SDK to your application and use the span processors provided by the OpenTelemetry SDK to perform extensions. This solution is used by the open source RUM project Sentry.
However, a RUM data model must meet specific requirements to implement this solution unless RUM data models are officially supported by OpenTelemetry. The proposal to add RUM as an observability tool to OpenTelemetry has been submitted to OpenTelemetry. For more information, see Proposal: Supporting Real User Monitoring Events in OpenTelemetry on GitHub.
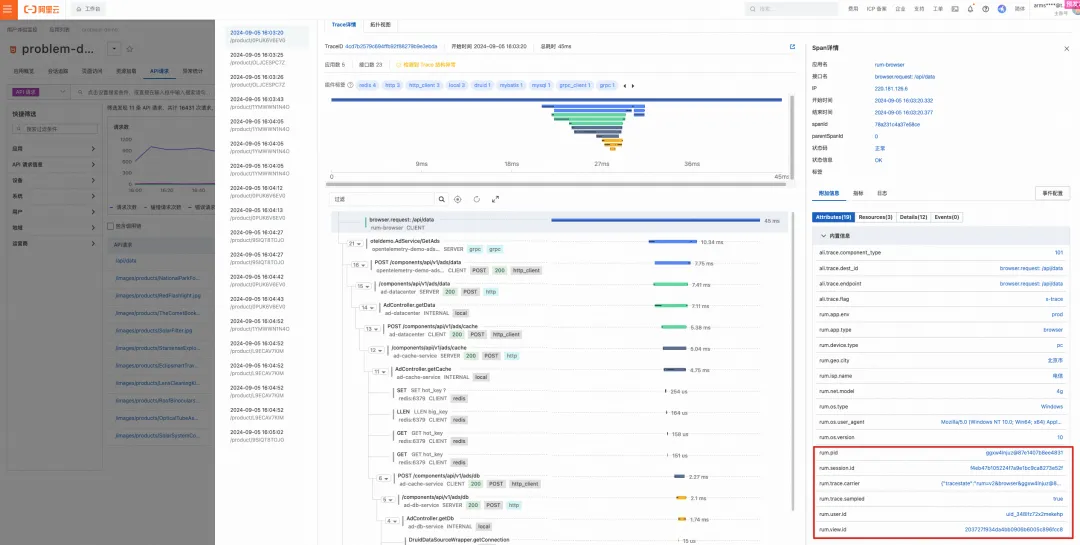
One of the most intuitive use cases in which RUM is integrated into tracing is end-to-end insight, which allows you to efficiently identify the root cause of a fault without the need to go to the corresponding service module or troubleshooting page. This feature is more valuable for large teams that separate roles and responsibilities.
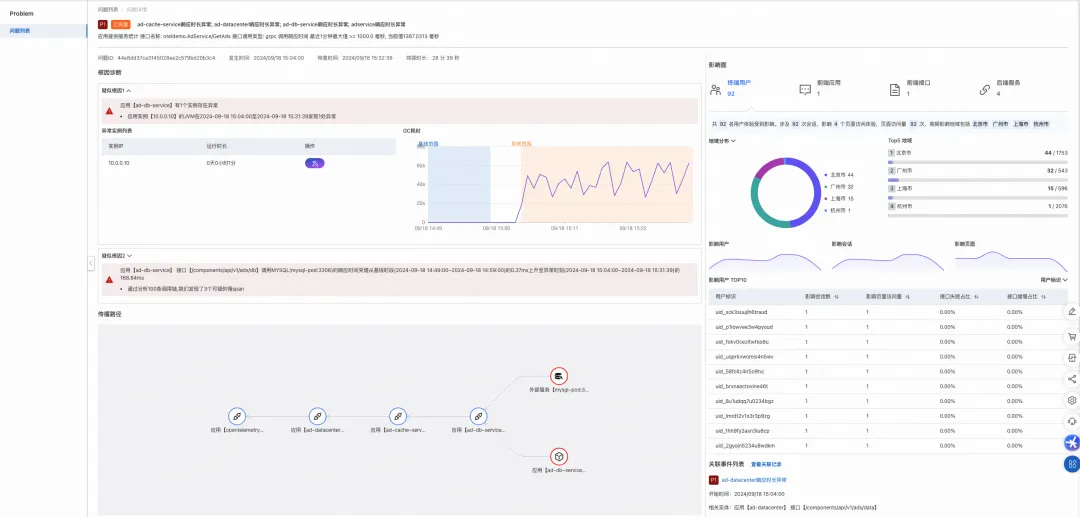
Another important use case is impact analysis. If an error occurs in the backend systems, all operations performed on the client side are recorded. In addition, requests that are affected by the error can be identified based on the trace data. This way, the impact of the error, such as the affected clients, terminals, vendors, and regions, can be accurately identified. In specific scenarios, this feature helps you determine the priority of processing online problems.
This article describes the solutions to build end-to-end tracing based on OpenTelemetry and the W3C protocol. This article also provides best practices of integrating RUM into end-to-end tracing. You can refer to this article when you deploy applications in the production environment. In addition to using RUM-integrated end-to-end tracing in the preceding end-to-end insight scenarios for root cause identification and the impact analysis scenarios, you can also use the replay feature of RUM to simulate errors that are difficult to simulate in the production environment. This facilitates troubleshooting online and optimizes user experience.
[1] https://opentelemetry.io/docs/
[2] https://www.w3.org/TR/trace-context/
[3] https://w3c.github.io/trace-context-protocols-registry/
[4] https://docs.google.com/document/d/16Vsdh-DM72AfMg_FIt9yT9ExEWF4A_vRbQ3jRNBe09w/edit?pli=1
[5] https://develop.sentry.dev/sdk/telemetry/traces/opentelemetry/#step-1-implement-the-sentryspanprocessor-on-your-sdk
Best Practices for Generating a Unit Test by Using Tongyi Lingma to Simplify Unit Testing

673 posts | 56 followers
FollowAlibaba Cloud Native Community - January 20, 2026
Alibaba Cloud Native Community - November 27, 2025
Alibaba Container Service - November 15, 2024
Alibaba Cloud Native Community - January 19, 2026
5544031433091282 - April 7, 2025
Anna Chat APP - August 12, 2024

673 posts | 56 followers
Follow Managed Service for OpenTelemetry
Allows developers to quickly identify root causes and analyze performance bottlenecks for distributed applications.
Learn More Simple Log Service
An all-in-one service for log-type data
Learn More Cloud-Native Applications Management Solution
Accelerate and secure the development, deployment, and management of containerized applications cost-effectively.
Learn More Edge Network Acceleration
Establish high-speed dedicated networks for enterprises quickly
Learn MoreMore Posts by Alibaba Cloud Native Community