By Yuanyi
In recent years, Kubernetes has been the preferred container-based orchestration platform for cloud native transformation. More and more development and O&M have been focused on Kubernetes, and ensuring the stability and availability of Kubernetes has become a basic requirement. The key to achieving this is to effectively monitor Kubernetes clusters and ensure good observability of clusters. This article describes the comprehensive monitoring and analysis of Kubernetes.
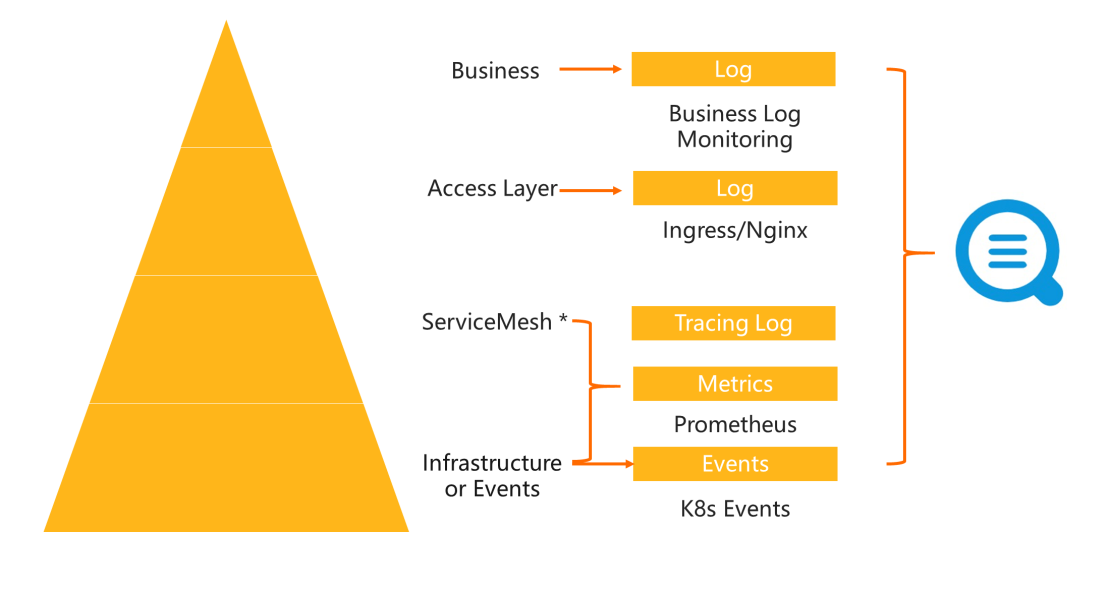
Kubernetes monitoring can be divided into four layers as shown in the image above: infrastructure monitoring, service mesh monitoring, access layer monitoring, and business monitoring. The lower a layer is, the wider the monitoring coverage is, and some upper-layer monitoring also may be involved. For example, you can monitor the status of business containers by viewing Kubernetes events, to implement some business monitoring. Relevant metrics can also better reflect the normal operation of business. For example, ingress logs of the access layer can directly indicate key metrics of the current service such as success rate and latency. The more focused the monitoring is, the higher the value is.
The implementation order usually is from lower layers to upper layers. The underlying layer monitoring is relatively fixed. Log Service provides some standard monitoring templates, which are less complex and can be used directly. However, the upper layer monitoring generally relies on the log and monitoring data output from business owners. The data formats of different technology stacks vary with manufacturers and much customization is required in implementation.
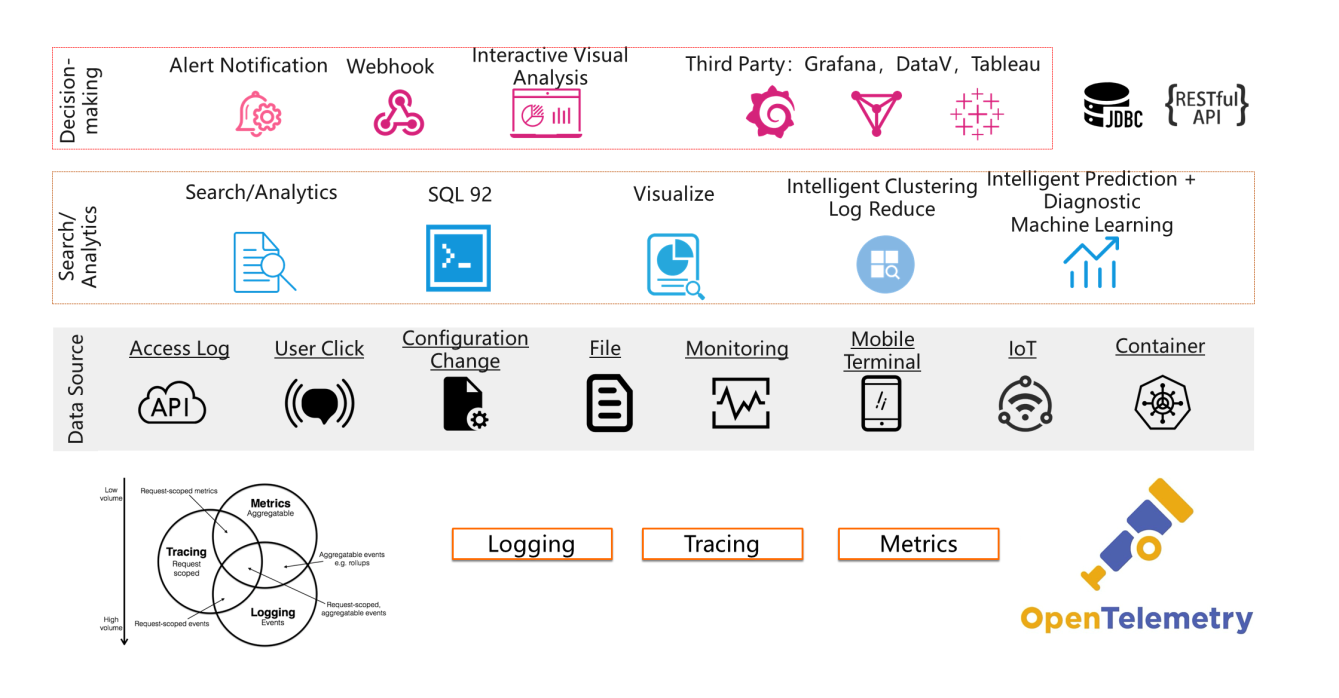
The preceding monitoring architecture involves many data sources and formats, such as hardware, operating systems, Kubernetes system components, service mesh, ingress, and business pods. The following data formats are used: logging, metric, and tracing data. A complete set of monitoring systems require the help of Log Service.
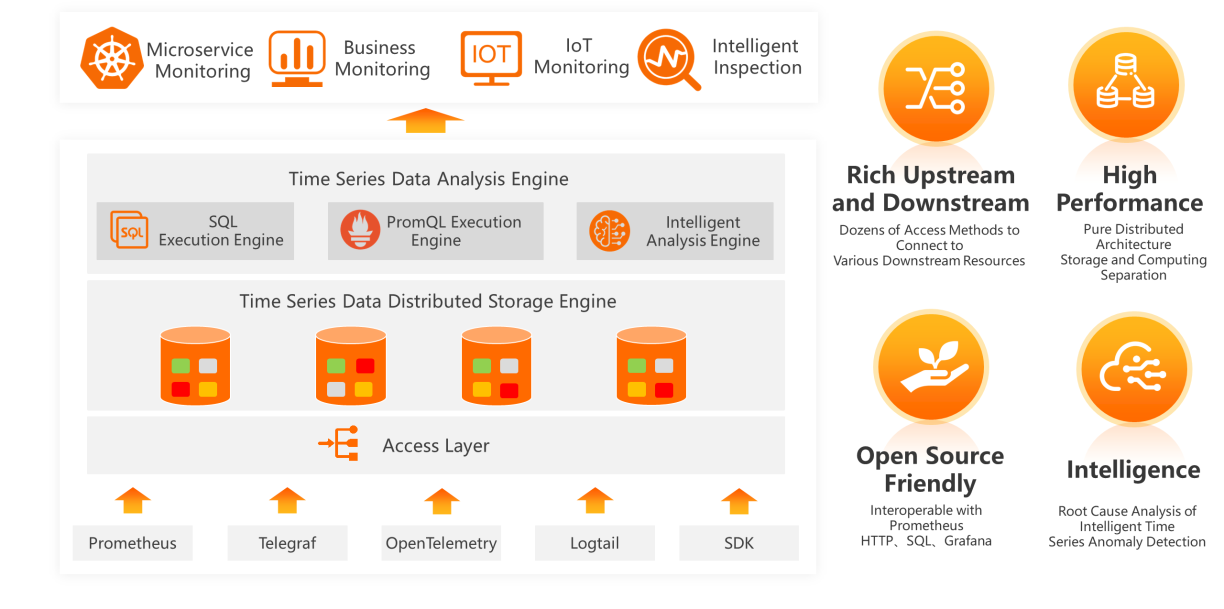
Log Service provides a storage and query engine for logging, metric, and tracing data, and supports various analysis, visualization, and alerting methods. In addition, Log Service provides APIs for all functions and is featured by high customization. The DevOps data mid-end provided by Log Service allows you to quickly tailor a Kubernetes monitoring solution.
Log Service provides monitoring templates for the infrastructure, service mesh, and access layers of Kubernetes. You can use these templates to quickly deploy monitoring solutions. The following sections describe how to deploy these monitoring templates.
Kubernetes is the first and most popular CNCF project after graduation, while Prometheus is the second CNCF project after graduation and the most popular CNCF project besides Kubernetes. Prometheus has become a de-facto standard for cloud-native monitoring. If the first step of enabling cloud native is to build a Kubernetes environment, then Prometheus is the first step to implement cloud-native monitoring.
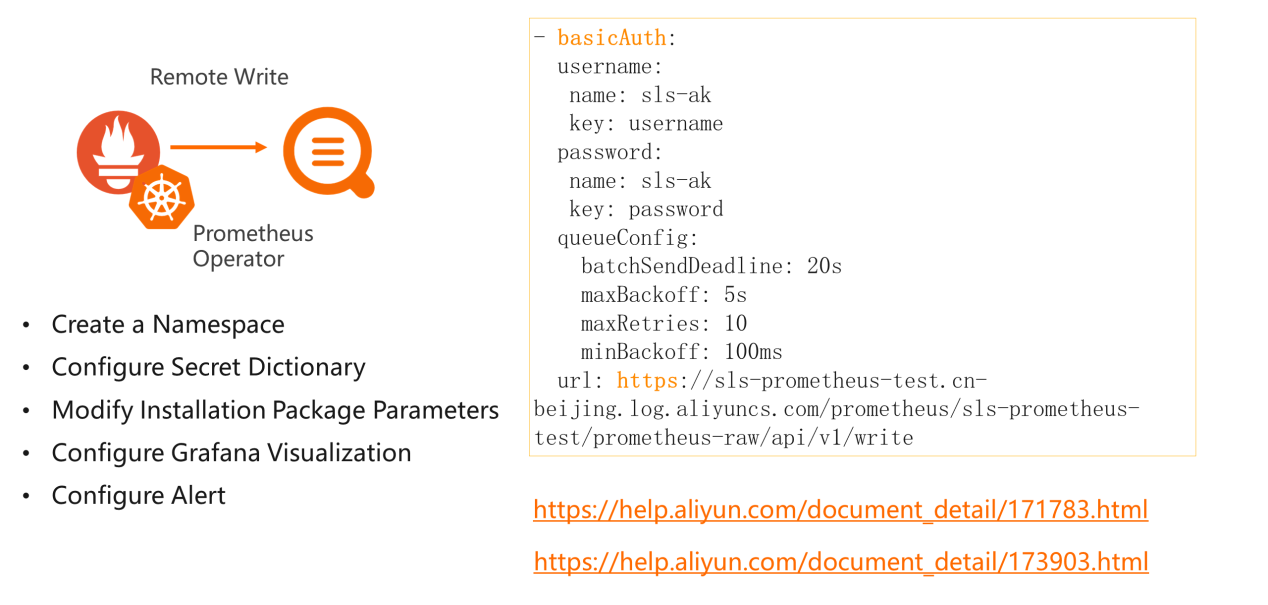
It is very simple to deploy Prometheus on Kubernetes. Only one Prometheus operator is requirement in deployment. The built-in Prometheus operator has been available in the Alibaba Cloud Kubernetes application market. You can directly install the Prometheus operator. For more information, see Collect Kubernetes Monitoring Data with Prometheus. The deployment procedure:
Kubernetes introduces events for you to better understand the internal status of Kubernetes. When resources in Kubernetes change, events are recorded in the API server. You can view these events by calling the API or running the kubectl command.
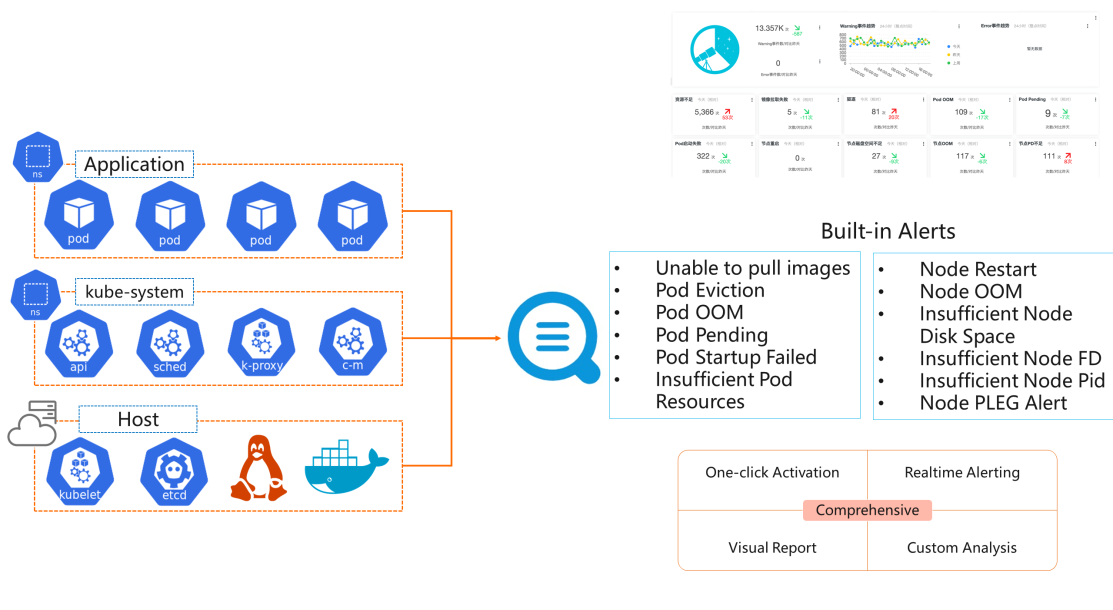
Kubernetes events specify the occurrence time, components, severity (normal, warning, error), type, and details. These events allows you to know the entire lifecycle (deployment, scheduling, running, and stop) of applications and notice ongoing exceptions in the system. Each component defines the type of events that it can trigger in the source code, such as event source code of the Kubelet.
To simplify the use of Kubernetes events, Alibaba Cloud Container Service for Kubernetes and Log Service together launch the Kubernetes event center, which allows Kubernetes events to be collected to Log Service in real time. The event monitoring and alerting metrics that Alibaba Cloud engineers have accumulated during many years of Kubernetes O&M are contained in the event center. You can use the O&M experience directly.
The event center is easy to deploy. By default, the event center is selected when Alibaba Cloud Container Service for Kubernetes is activated. Then the event center is automatically created. If you do not select the install event center check box, you can visit the Alibaba Cloud Kubernetes application market and install ack-node-problem-detector. For more information, see Create and Use the Kubernetes Event Center. Then the event center is automatically enabled.
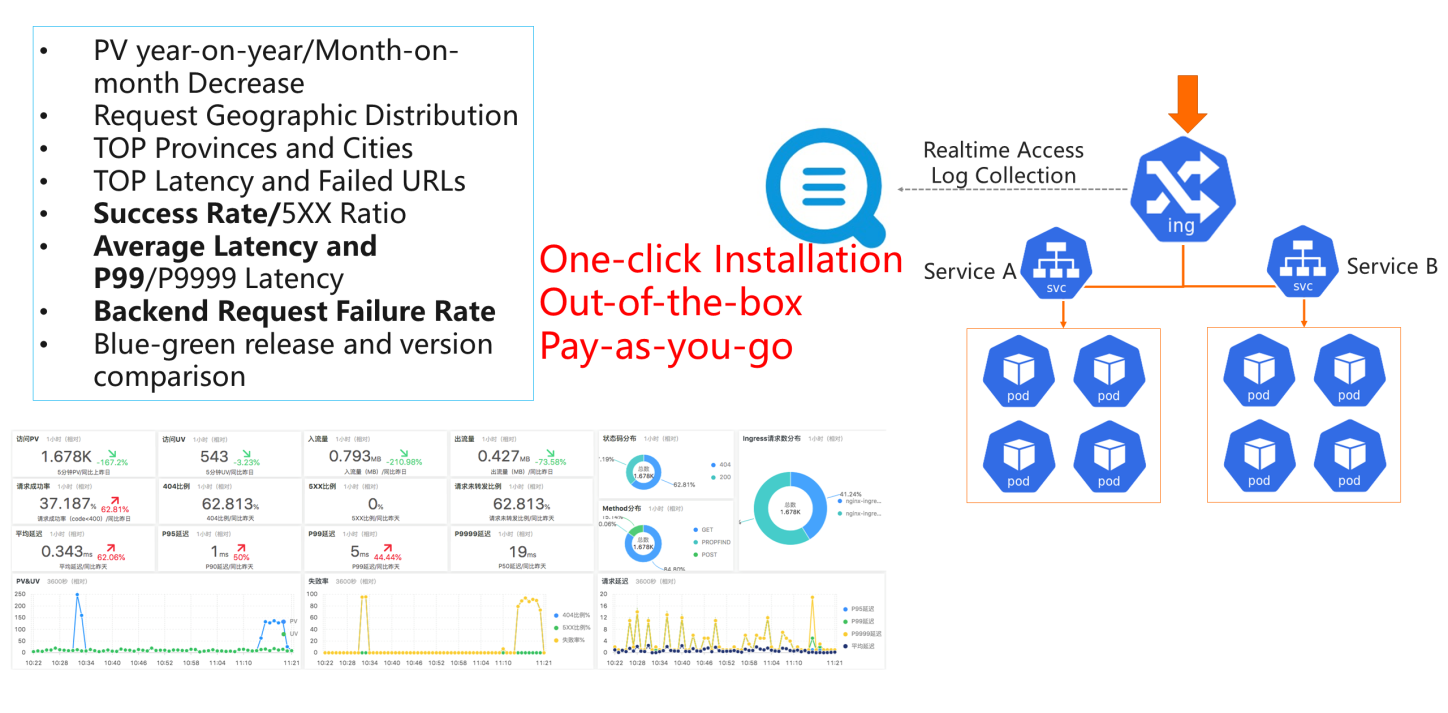
In Kubernetes, components expose services, such as NodePort, LoadBalancer, and Ingress. The ingress mainly provides HTTP (Layer 7) routing, which has more advantages over TCP (Layer 4) load balancing: more flexible routing rules, canary, blue-green, and A/B test release methods, support for Log Service, logging, monitoring, and custom scaling. The ingress is currently the main exposure method for HTTP and HTTPS services in Kubernetes.
In Kubernetes, an ingress is just an API resource declaration. To implement an ingress, you must install the corresponding ingress controller, which defines the ingress and forwards traffic to the corresponding services. Many ingress controllers now are available. For more information, see Ingress controller documentation. Popular ingress controllers include Nginx, Traefik, Istio, and Kong. Nginx Ingress Controller is the most popular one in China.
The ingress log analysis and monitoring solution requires the construction of multiple modules (collection agent, data queuing, indexing, visualization, and alerting lamp). This involves heavy workload. To simplify the use of ingress log analysis and monitoring, Alibaba Cloud Container Service for Kubernetes becomes interoperable with Log Service. For more information, see official documentation. A YAML resource can be used to deploy a complete ingress log solution, including log collection, analysis, and visualization.
The ingress monitoring solution is easy to deploy. By default, ingress monitoring is selected when Alibaba Cloud Container Service for Kubernetes is activated. Then the ingress monitoring solution is automatically created. If you do not select the install ingress monitoring check box, you must use a YAML resource as specified in Documentation. Ingress monitoring provides monitoring information in various dimensions in seconds, including PV, UV, geographic distribution, success rate, average latency, and P99 or P9999 latency. In addition, blue-green version comparison is supported to compare the key metrics of old and new phased release versions.
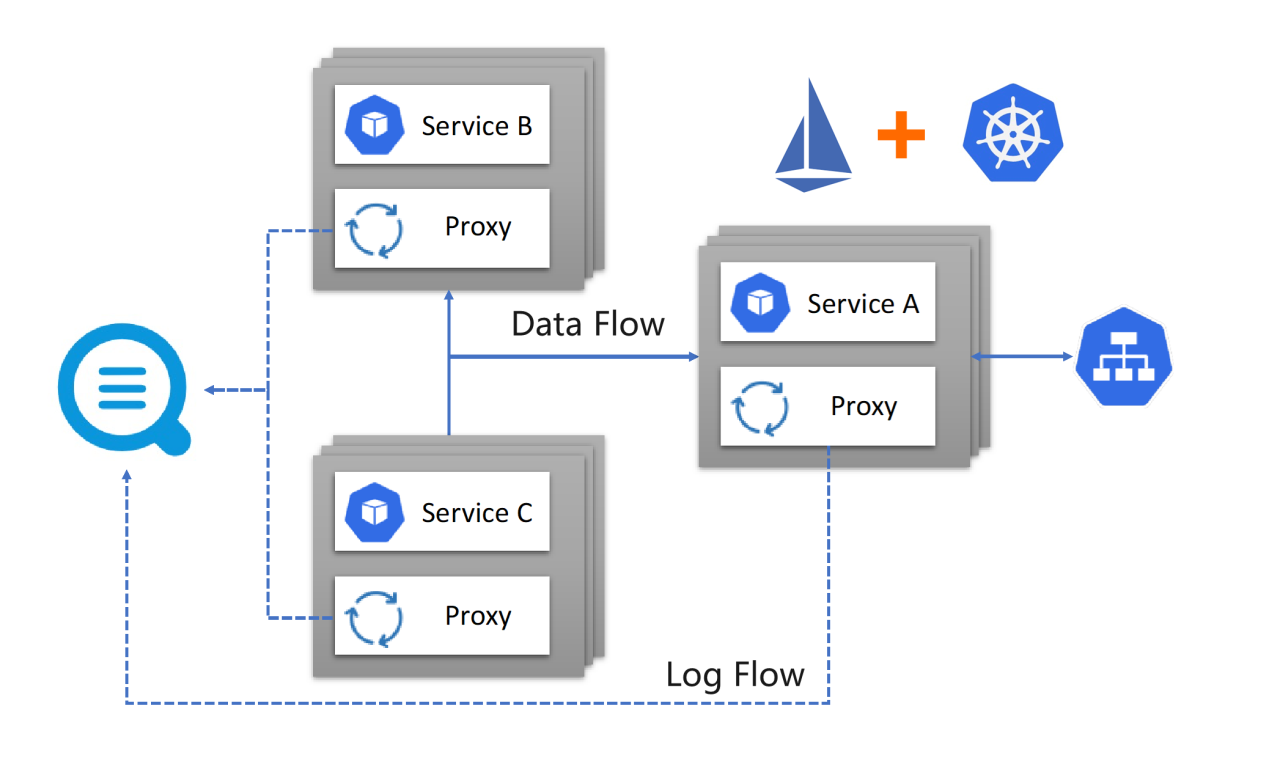
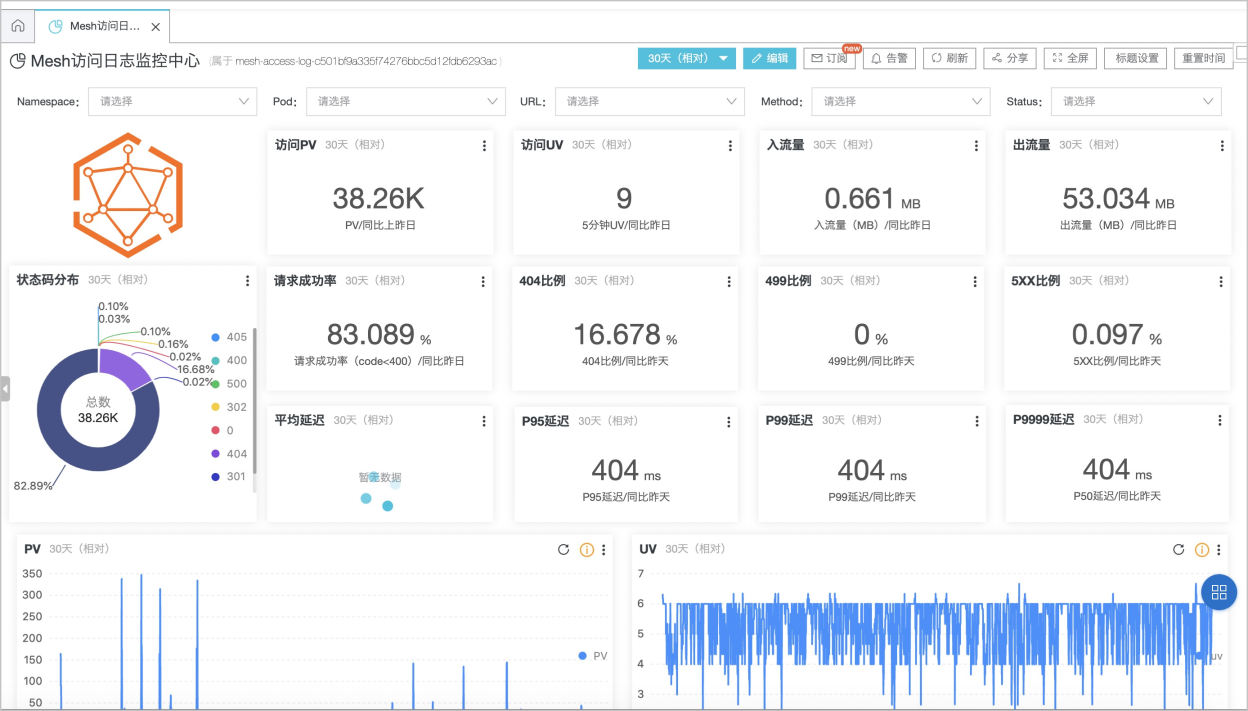
More and more enterprises use service mesh, and Istio has become the mainstream trend. Log Service can directly interoperate with Alibaba Cloud Service Mesh (ASM). Similar to ingress, you can select or manually deploy a YAML resource in the console to install Log Service. For more information, see Collect Data Plane Access Logs with Log Service.
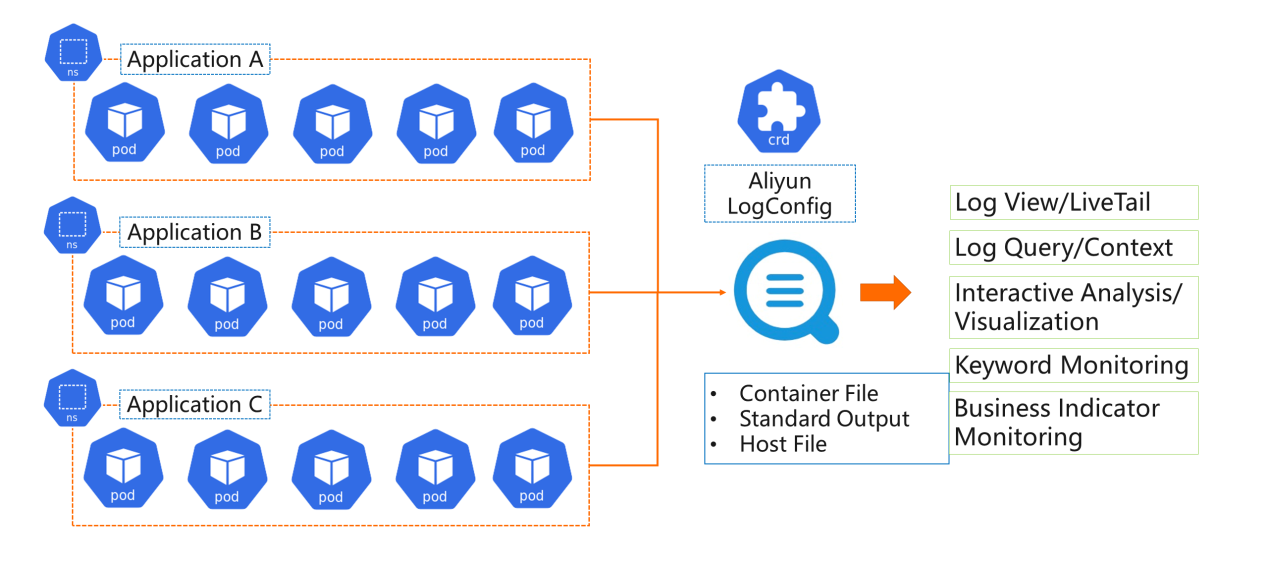
Log analysis and monitoring is the best way to monitor business in Kubernetes. Compared with traditional log collection methods, log collection in Kubernetes is more complex and requires consideration of issues such as dynamics, multi-objective, and multi-log format. Common log collection programs rarely run stably. Kubernetes logs can be collected in a very stable manner by using Logtail provided by Log Service. Kubernetes logs support the simple CRD-based operator extension method. You can deploy a YAML resource to specify data sources and storage destinations for log collection. Logs can be stored in several ways such as in stdout, files, hosts, and journals. For more information about the advantages and features, see Best Practices of Kubernetes Log Collection.
The most common method in Kubernetes is to store logs in both stdout and files. CRD can be used to collect logs. For more information, see the following articles:
Log Service supports multiple log viewing, analysis, visualization, and monitoring methods. We recommend that you use the following features:
Kubernetes provides powerful features that greatly simplify service release and O&M management. However, you must configure the monitoring scheme separately for Kubernetes because an orchestration layer is added. The best choice is to deploy a complete set of bottom-up monitoring systems. By using the templates and features provided by Log Service, you can quickly tailor Kubernetes monitoring solutions for your business scenarios.
Cloud-Native Prometheus Solution: High Performance, High Availability, and Zero O&M
A Unified Solution for Observability - Make SLS Compatible with OpenTelemetry
12 posts | 1 followers
FollowAlibaba Clouder - March 2, 2021
Hologres - July 16, 2021
Alibaba Developer - June 30, 2020
Neel_Shah - October 27, 2025
Neel_Shah - June 24, 2025
Alibaba Clouder - June 10, 2020
12 posts | 1 followers
Follow Managed Service for Grafana
Managed Service for Grafana displays a large amount of data in real time to provide an overview of business and O&M monitoring.
Learn More Bastionhost
A unified, efficient, and secure platform that provides cloud-based O&M, access control, and operation audit.
Learn More Simple Log Service
An all-in-one service for log-type data
Learn More Quick BI
A new generation of business Intelligence services on the cloud
Learn MoreMore Posts by DavidZhang