By Wei Bin, CTO of Puxiang Communication Technology
If you have seen an Elasticsearch log, it was probably similar to the example below:
[2018-06-30T17:57:23,848][WARN ][o.e.m.j.JvmGcMonitorService] [qoo--eS] [gc][228384] overhead, spent [2.2s] collecting in the last [2.3s]
[2018-06-30T17:57:29,020][INFO ][o.e.m.j.JvmGcMonitorService] [qoo--eS] [gc][old][228385][160772] duration [5s], collections [1]/[5.1s], total [5s]/[4.4d], memory [945.4mb]->[958.5mb]/[1007.3mb], all_pools {[young] [87.8mb]->[100.9mb]/[133.1mb]}{[survivor] [0b]->[0b]/[16.6mb]}{[old] [857.6mb]->[857.6mb]/[857.6mb]}
Based on the keyword [gc], you may have guessed that the logs are related to garbage collection (GC). However, do you understand the meaning of each part? This article will help you better understand the specifics.
First, let's take a quick look at each part:
Note: If you are already familiar with GC, you can skip the following section.
GC stands for garbage collection or garbage collector.
If you write a program in C language, you have to manually run the malloc and free commands to request and release the memory required to store the data. If you forget to release the memory, memory leakage may occur. In other words, useless data may occupy precious memory resources. However, if you write a program in Java, you do not have to explicitly request or release memory resources, because a Java virtual machine (JVM) can automatically manage memory resources. Most importantly, the JVM provides the GC feature to independently release the memory occupied by useless data, which is also called garbage.
The main reason we need to study GC is that stop-the-world (STW) occurs during GC. When STW occurs, all user threads stop working. If the STW problem lasts for a long time, the availability and real-time performance of the application will suffer greatly.
GC mainly resolves the following problems:
Let's answer each question one by one.
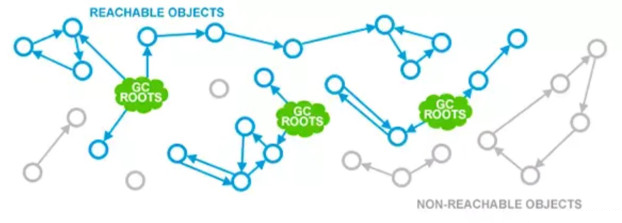
Garbage refers to objects that are no longer used or referenced. In Java, objects are all created on the heap. In this article, we assume that objects are only created on the heap by default. To find garbage, you need to determine whether an object is referenced. You can use one of the following methods:
Method 1 is simple, direct, and efficient, but inaccurate. In particular, method 1 is useless for garbage objects that are mutually referenced.
Method 2 is widely used at present. As the starting points of the GC process, GC roots are critical in this method. However, we do not have the space to provide a detailed description.
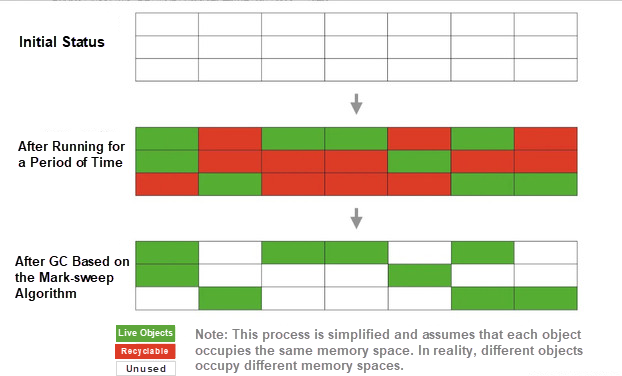
After I find garbage, how can I recycle it? This seems to be a silly question. Can't I just collect the garbage and throw it away? The corresponding operation on the program directly marks the space occupied by these objects as idle, right? Now, let's look at the basic recycling algorithm, the mark-sweep algorithm.
This algorithm is very simple. The system marks the garbage by using the reachability analysis method, and then recycles the garbage space. However, a significant problem occurred after a period of time: A large number of fragments appear in the memory, but the system fails to allocate the requested memory to a large object. As a result, an out-of-memory (OOM) error occurs and the large number of memory fragments must be maintained by using a data structure such as a chain table. This increases the marking and clearance costs and reduces the efficiency. The following figure shows the results of this algorithm.
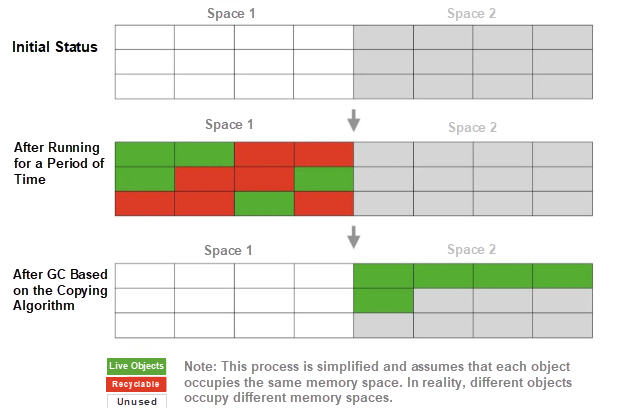
To resolve the efficiency problem of the preceding algorithm, a copying algorithm has been proposed. The copying algorithm splits the memory into two parts. Only one part of the memory is used at a time. When this part is insufficient, GC is triggered and live objects are copied to the other part of the memory. This process repeats cyclically. This algorithm is efficient because the system does not need to maintain any chain table during resource allocation, but only needs to move the pointer backward. However, the biggest problem with this algorithm is that many memory resources are wasted.
After all, the memory usage is only 50%.
Despite its low memory usage, this algorithm is very efficient when Java objects are very short-lived. According to IBM Research, up to 98% of Java objects live for less than one day. This means that a majority of the memory resources are recycled during each GC. In this case, only a small amount of data needs to be copied. Therefore, the execution efficiency is very high.
This algorithm resolves the memory fragmentation problem of the first algorithm. As shown in the following figure, it compacts all the memory resources in the recycling phase.
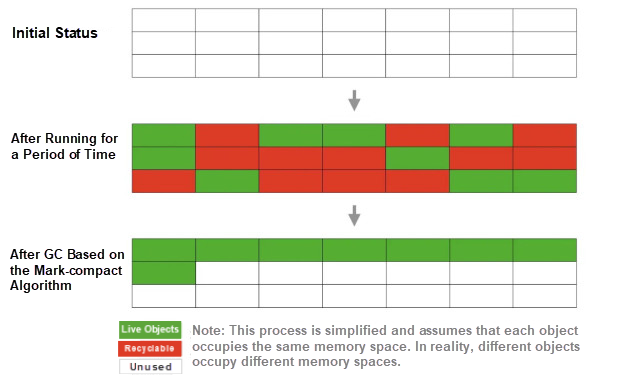
However, the addition of the compacting phase increases the GC time.
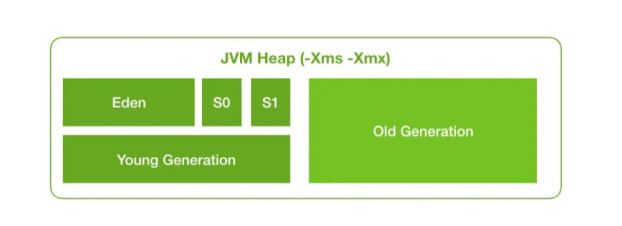
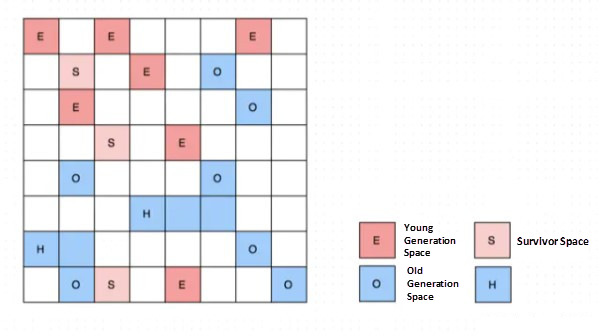
Since most Java objects are short-lived, we divide the memory into a young generation and old generation. The former stores short-lived objects while the latter stores long-lived objects. Of course, the long-lived objects are also promoted from short-lived objects. Then, we can use different recycling algorithms for the two types of objects. For example, the copying algorithm may be efficient for the young generation while the mark-sweep or mark-compact algorithm is better suited to the old generation. The generation collection algorithm is also the most commonly used. The following figure shows the division of the JVM heap by generation. The young generation is generally divided into eden, survivor 0 (S0), and survivor 1 (S1) spaces, so that the copying algorithm can be used efficiently.
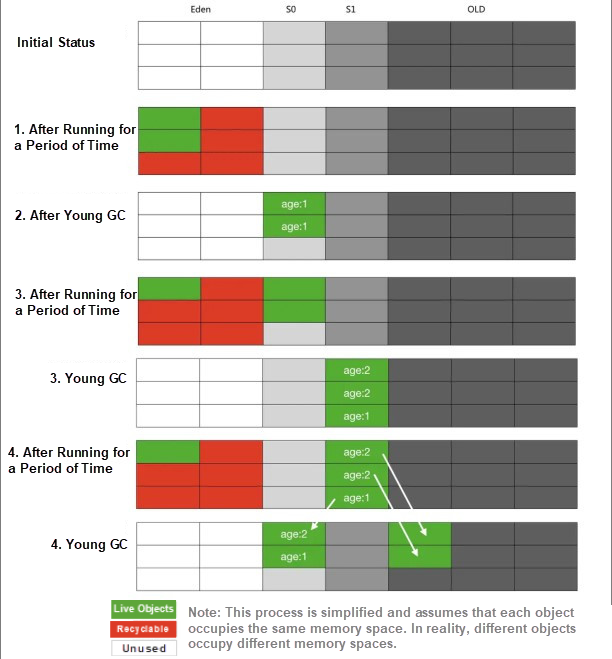
The following figure shows an example of the GC process after the memory is divided by generation.
The GC algorithms introduced above are implemented as garbage collectors, and we actually use them. The latest GC mechanisms usually use the generation collection algorithm. The following figure briefly summarizes the different GCs used in young and old generations.
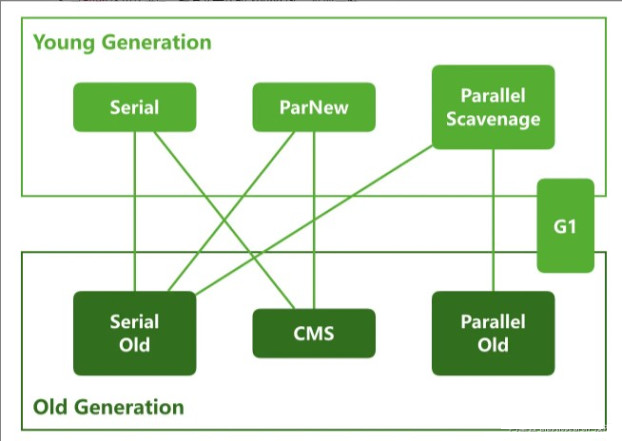
As shown in the preceding figure, different GCs are used in young and old generations. Actually, the GCs connected in each line can be used in combination. These GCs can be classified into the following categories based on how they work:
Let's take a brief look at how different GCs operate.
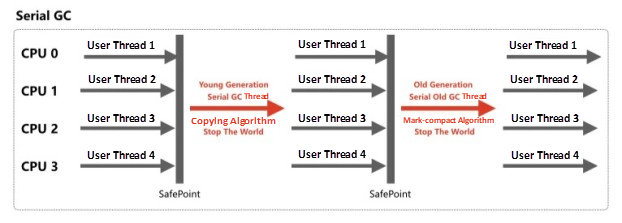
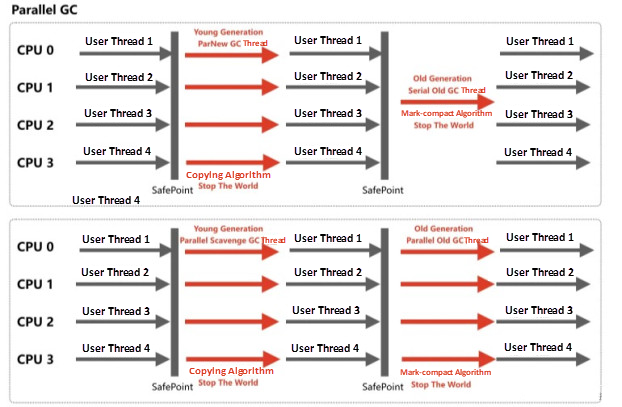
Serial GC threads run in the young generation while serial old GC threads run in the old generation. The following figure shows the general execution process.
ParNew and Parallel Scavenge GC threads run in the young generation while parallel old GC threads run in the old generation. The following figure shows the general execution process. In this mode, GC threads run in parallel and therefore the efficiency is higher than that in the serial GC mode.
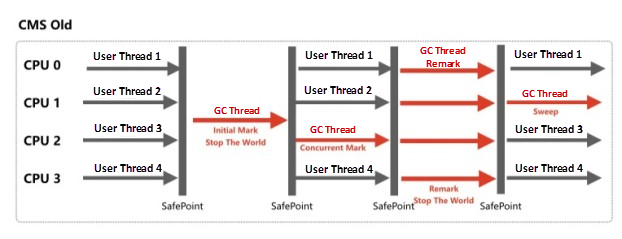
Currently, concurrent GC threads only run in the old generation. Concurrent mark-sweep (CMS) GCs are the most popular at the moment. The execution of CMS GCs is divided into multiple stages. User threads must be stopped only in some stages. We do not have space to go into detail here. If you are interested, you can read some relevant articles on your own. The following figure shows the general execution process of CMS GCs in the old generation.
Currently, garbage first garbage collectors (G1 GCs) and Z garbage collectors (ZGCs) are the most advanced GCs. Their operating mechanisms are different from those of all the preceding types of GCs. G1 GCs and ZGCs also adopt the generation collection algorithm, but they further divide the heap into multiple spaces. Details are not described here. If you are interested, see the references at the end of this article.
CMS GC is configured for Elasticsearch by default. ParNew GCs are used in the young generation and CMS GCs are used in the old generation. You can see the following configurations in config/jvm.options:
## GC configuration
-XX:+UseConcMarkSweepGC
-XX:CMSInitiatingOccupancyFraction=75
-XX:+UseCMSInitiatingOccupancyOnlyNow that we know how to find and recycle garbage. When should we recycle garbage? Simply put, garbage is recycled based on the following rules:
Now that we have a better understanding of GC, we can return to the questions posed at the beginning of this article.
[2018-06-30T17:57:23,848][WARN ][o.e.m.j.JvmGcMonitorService] [qoo--eS] [gc][228384] overhead, spent [2.2s] collecting in the last [2.3s]The GC spent 2.2s on garbage collection in the last 2.3s. The garbage collection process seems to have taken an excessively long time. Pay close attention to this.
[2018-06-30T17:57:29,020][INFO ][o.e.m.j.JvmGcMonitorService] [qoo--eS] [gc][old][228385][160772] duration [5s], collections [1]/[5.1s], total [5s]/[4.4d], memory [945.4mb]->[958.5mb]/[1007.3mb], all_pools {[young] [87.8mb]->[100.9mb]/[133.1mb]}{[survivor] [0b]->[0b]/[16.6mb]}{[old] [857.6mb]->[857.6mb]/[857.6mb]}Let's discuss the specifics of each item. I believe that with the preceding basic knowledge of GC, you will easily understand the explanations here.
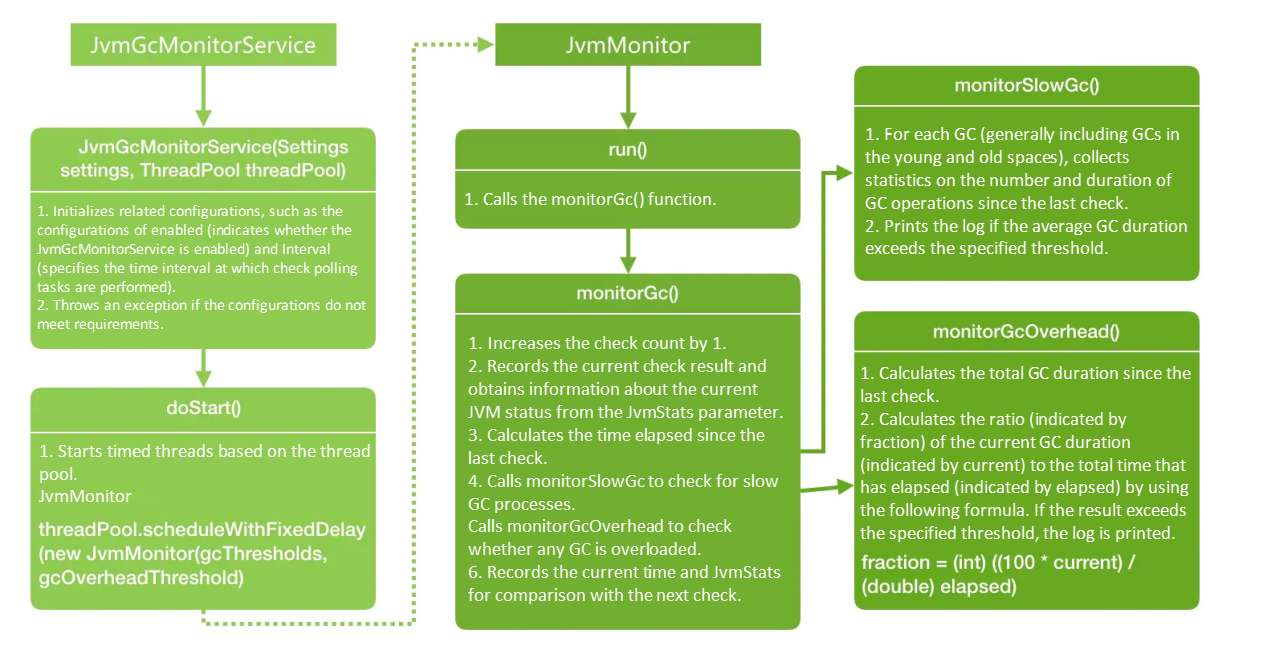
As you can see from the logs, the logs are output by the JvmGcMonitorService class. You can quickly find the class by searching the source code in /Users/rockybean/code/elasticsearch/core/src/main/java/org/elasticsearch/monitor/jvm/JvmGcMonitorService.java. We will not discuss the source code in detail here. The following figure shows the general execution process of the class.
The source code also defines the log format, as shown in the following sample code.
private static final String SLOW_GC_LOG_MESSAGE =
"[gc][{}][{}][{}] duration [{}], collections [{}]/[{}], total [{}]/[{}], memory [{}]->[{}]/[{}], all_pools {}";
private static final String OVERHEAD_LOG_MESSAGE = "[gc][{}] overhead, spent [{}] collecting in the last [{}]";
You may find that the GCs in the output log are only divided by young and old spaces because Elasticsearch encapsulates GC names into the org.elasticsearch.monitor.jvm.GCNames class. The following sample code is relevant to the encapsulation.
public static String getByMemoryPoolName(String poolName, String defaultName) {
        if ("Eden Space".equals(poolName) || "PS Eden Space".equals(poolName) || "Par Eden Space".equals(poolName) || "G1 Eden Space".equals(poolName)) {
            return YOUNG;
        }
        if ("Survivor Space".equals(poolName) || "PS Survivor Space".equals(poolName) || "Par Survivor Space".equals(poolName) || "G1 Survivor Space".equals(poolName)) {
            return SURVIVOR;
        }
        if ("Tenured Gen".equals(poolName) || "PS Old Gen".equals(poolName) || "CMS Old Gen".equals(poolName) || "G1 Old Gen".equals(poolName)) {
            return OLD;
        }
        return defaultName;
    }
    public static String getByGcName(String gcName, String defaultName) {
        if ("Copy".equals(gcName) || "PS Scavenge".equals(gcName) || "ParNew".equals(gcName) || "G1 Young Generation".equals(gcName)) {
            return YOUNG;
        }
        if ("MarkSweepCompact".equals(gcName) || "PS MarkSweep".equals(gcName) || "ConcurrentMarkSweep".equals(gcName) || "G1 Old Generation".equals(gcName)) {
            return OLD;
        }
        return defaultName;
    }
In the preceding code, you can see the names of the different GC algorithms that we mentioned in the first section.
Now we have finished describing the source code. To learn more, you can search for more relevant information online.
You can find many articles about GC on the Internet. This article starts with basic knowledge about GC so that beginners can easily get started and understand the GC output. I hope this article helps you better understand GC logs in Elasticsearch.
Wei Bin, CTO of Puxiang Communication Technology, is an open-source software advocate. He was the first Elastic certified engineer in China and the initiator of the community projects Elastic Daily and Elastic Talk. Wei Bin was awarded the 2019 Annual Partner Architect - Special Contribution Award by Elastic China. Wei Bin has rich practical experiences in open-source software such as Elasticsearch, Kibana, Beats, Logstash, and Grafana. He provides consulting and training services for customers in many industries, including retail, finance, insurance, securities, and technology. He helps customers identify the roles of open-source software in their business, implement open-source software from scratch, and scale it out to produce business value.
Declaration: This article is adapted from "Do You Understand the GC Logs in Elasticsearch Logs?" under the authorization of the author Wei Bin. We reserve the right to investigate unauthorized use.
Allocate Indexes to Hot and Warm Nodes in Elasticsearch through Shard Filtering
Data Geek - August 7, 2024
Alibaba Cloud Community - August 20, 2024
Apache Flink Community China - November 6, 2020
OpenAnolis - January 26, 2026
Alibaba Cloud Community - May 9, 2024
Alibaba Clouder - January 15, 2019
 Big Data Consulting for Data Technology Solution
Alibaba Cloud provides big data consulting services to help enterprises leverage advanced data technology.
Learn More Big Data Consulting Services for Retail Solution
Alibaba Cloud experts provide retailers with a lightweight and customized big data consulting service to help you assess your big data maturity and plan your big data journey.
Learn More Alibaba Cloud Elasticsearch
Alibaba Cloud Elasticsearch helps users easy to build AI-powered search applications seamlessly integrated with large language models, and featuring for the enterprise: robust access control, security monitoring, and automatic updates.
Learn More Bastionhost
A unified, efficient, and secure platform that provides cloud-based O&M, access control, and operation audit.
Learn MoreMore Posts by Data Geek