There are many tools in the market that facilitate data visualization and exploration. I had the opportunity to personally try several of these tools for my projects. Out of all these tools, I found Kibana to be the most pleasing and convenient to use. I have used Kibana together with ElasticSearch. You can easily set up your own Elastic (ELK) stack on Alibaba Cloud Container Service.
In this blog, I will share with you five features, which I believe is the differentiator between Kibana and other similar tools. Read on to learn about the five features of Kibana that you should know.
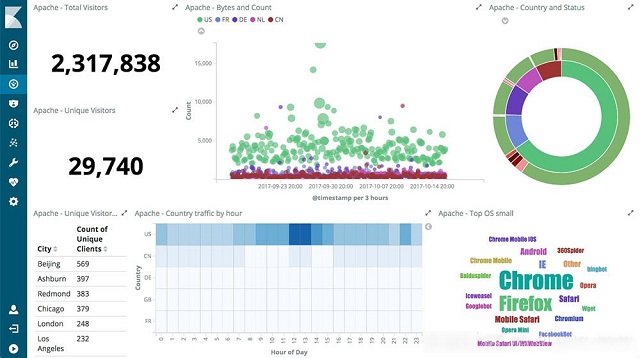
Alibaba Cloud has integrated Kibana with ElasticSearch, which allows users to easily use Kibana to check, analyze, and store the data in ElasticSearch. Kibana includes several classic features like bar, line, pie, and ring charts, allowing users to make full use of ElasticSearch’s aggregation functionality. Furthermore, the Dashboard functions can compile a variety of visual components into a large screen. As we can see from the below figure, Kibana can perform statistical analysis on access logs for network applications.
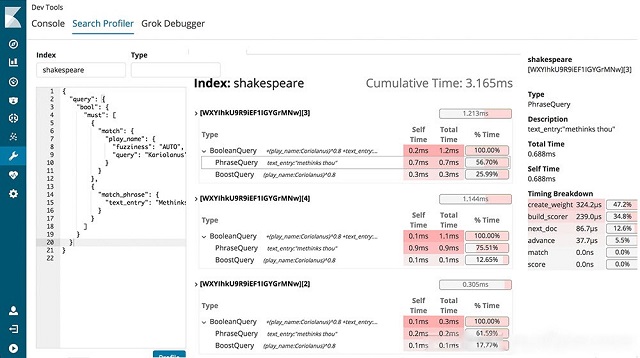
With Kibana’s development tools, you can skip entering commands in the terminal and jump straight to processing the ElasticSearch data. Compared to similar kinds of open source software, Search Profiler makes it easier to check the amount of time taken for search requests. Furthermore, creating a complicated Grok pattern in Logstash settings makes using Grok Debugger much simpler. The below figure shows the functionality available in Search Profiler.
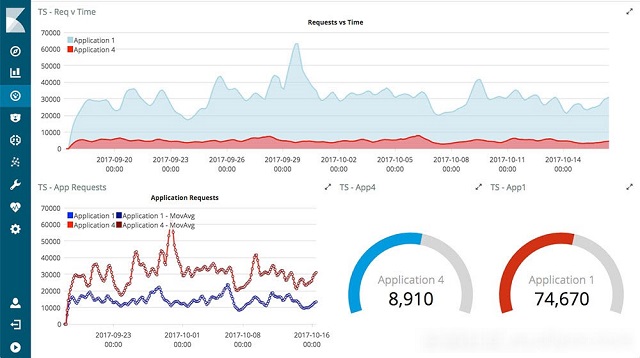
You can use Timelion to perform advanced chronological analysis on your ElasticSearch data. Additionally, you can also use powerful and simple functions to expressively describe, search, transform, and visualize data.
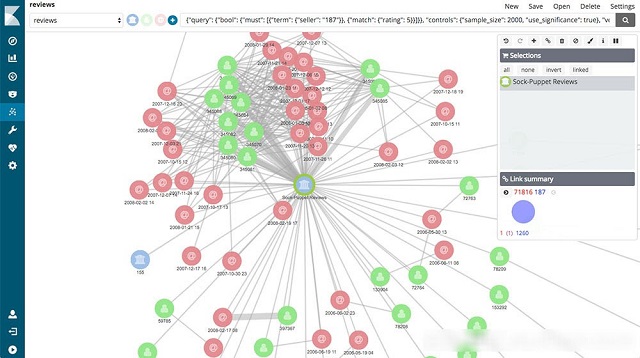
A single line in a graph could be related to thousands or even tens of thousands of documents, such as transactions between two bank accounts. Kibana lets you look at these relationships intuitively. You can use any of the data maps, timelines, pie charts, or original document visualizations to retrieve more detailed information. You can click on a graph made up of networked entities and interact with the image to check the strength of a relationship. Moreover, you can even customize colors and image shapes.
Kibana can visualize special geographic data or use Elastic Maps Service to allow you to achieve custom visualization of locational data.
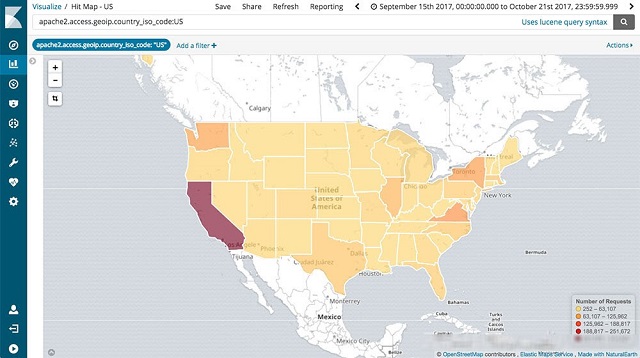
In this article, I shared five features of Kibana, along with several images that illustrate its capabilities and offerings. I strongly believe that with features such as data map analysis, time series data query, and powerful and convenient tools make it the best data visualization tool out there! Check out the Alibaba Cloud Container Service and build your own Elastic (ELK) stack today!
Hello World - Introducing the All-New Alibaba Cloud Community Blog

2,593 posts | 792 followers
FollowAlibaba Cloud Native - July 10, 2024
Alibaba Clouder - August 5, 2019
Alibaba Cloud Indonesia - May 11, 2023
Alibaba Clouder - July 3, 2019
Data Geek - August 6, 2024
Data Geek - August 28, 2023

2,593 posts | 792 followers
Follow Big Data Consulting for Data Technology Solution
Alibaba Cloud provides big data consulting services to help enterprises leverage advanced data technology.
Learn More Big Data Consulting Services for Retail Solution
Alibaba Cloud experts provide retailers with a lightweight and customized big data consulting service to help you assess your big data maturity and plan your big data journey.
Learn More Quick BI
A new generation of business Intelligence services on the cloud
Learn More ApsaraDB for HBase
ApsaraDB for HBase is a NoSQL database engine that is highly optimized and 100% compatible with the community edition of HBase.
Learn MoreMore Posts by Alibaba Clouder
Raja_KT March 15, 2019 at 11:57 am
In conjunction with Hadoop, Big data, it gives better views and services...