On the Overview page of the Secure Access Service Edge (SASE) console, you can view various statistics, including the number of online terminals of users, working hours, application access, and bandwidth consumption. This gives you an overview of user working patterns and bandwidth usage.
View statistics of terminals and accounts
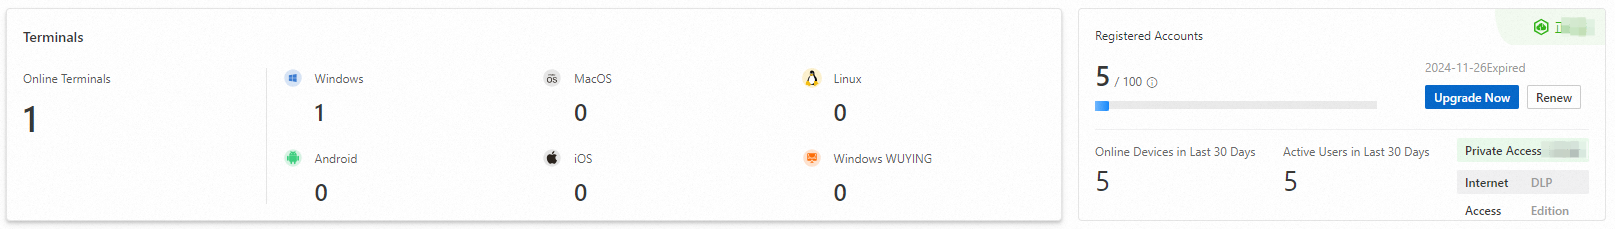
The number in the Online Terminals section indicates the current number of online terminals of users.
You can check whether the account quota that you purchased meets your business requirements based on the numbers in the Registered Accounts and Active Users in Last 30 Days sections. For more information, see Upgrade and downgrade.
SASE records the number of accounts that are used to log on to the SASE client in the last 30 days, which helps maximize the account quota based on the business requirements of your enterprise.
You can determine whether SASE needs to be renewed based on its expiration date. For more information, see Renewal.
View the access data of office applications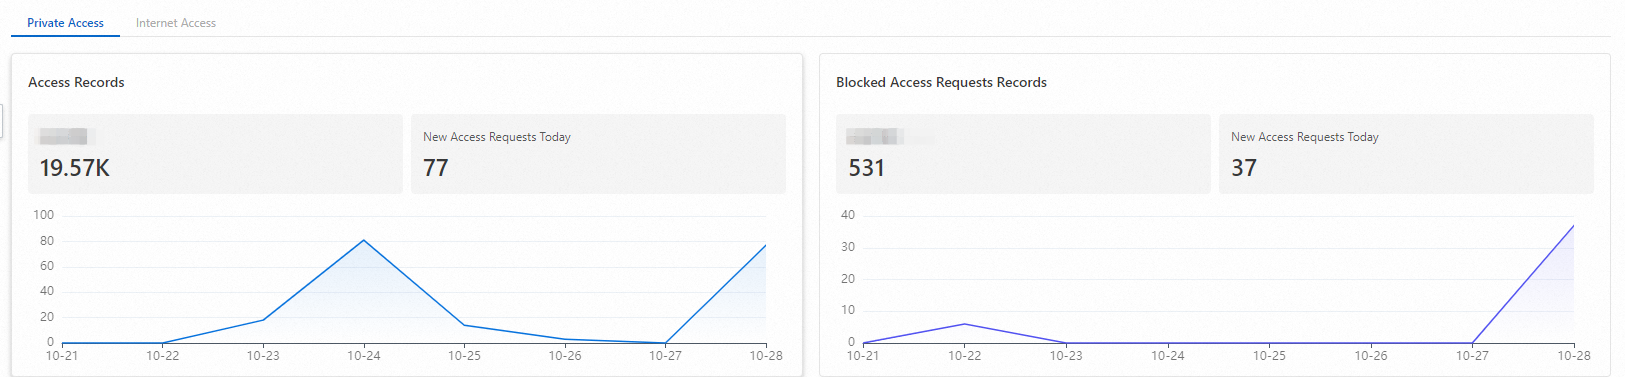
In the Access Records and Blocked Access Requests Records sections, you can view the access data of office applications over the last seven days.
View working hours
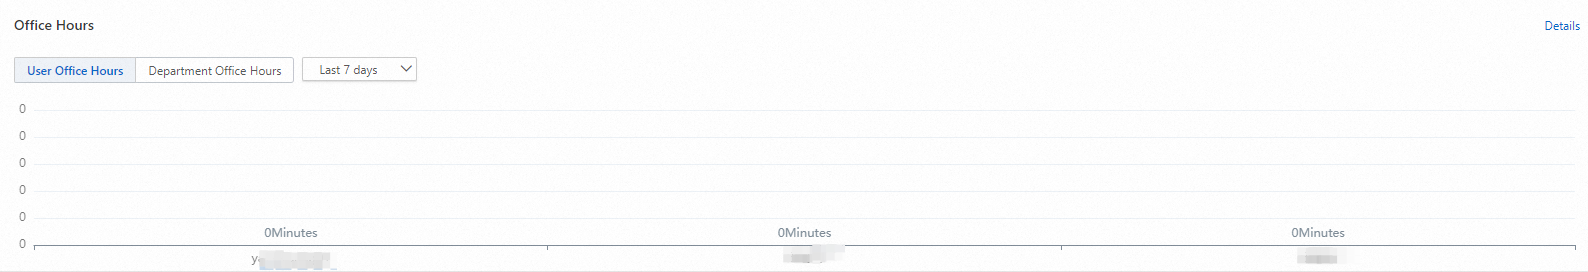
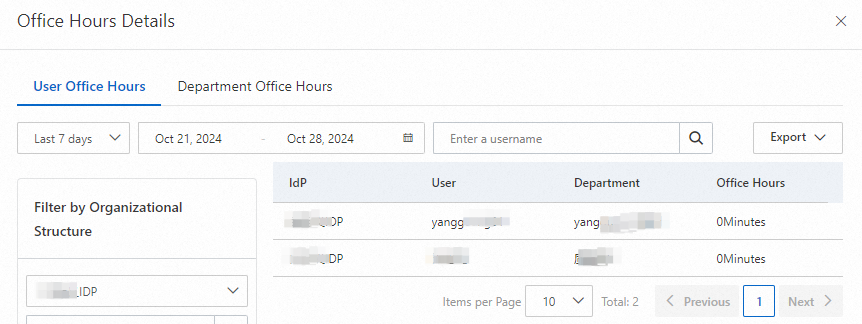
In the Office Hours section, you can view the working hours by user and by department. Working hours indicate the duration for which a user is connected to the SASE client. You can click Details to view finer-grained information about working hours.
View the application access data of users
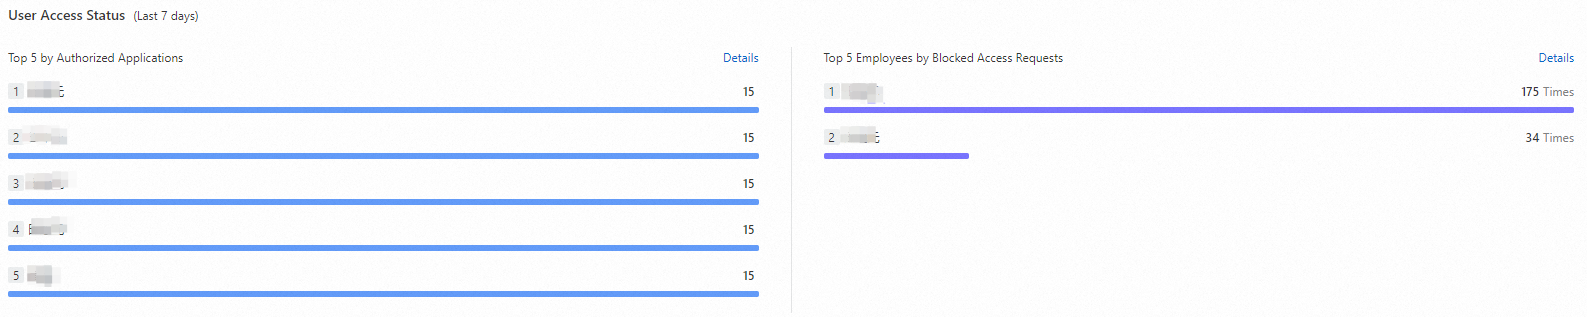
In the User Access Status section, you can view the top five users who have the most authorized applications and the top five users with the most blocked application access requests. You can click Details to view more information about user access.
View the access data of applications
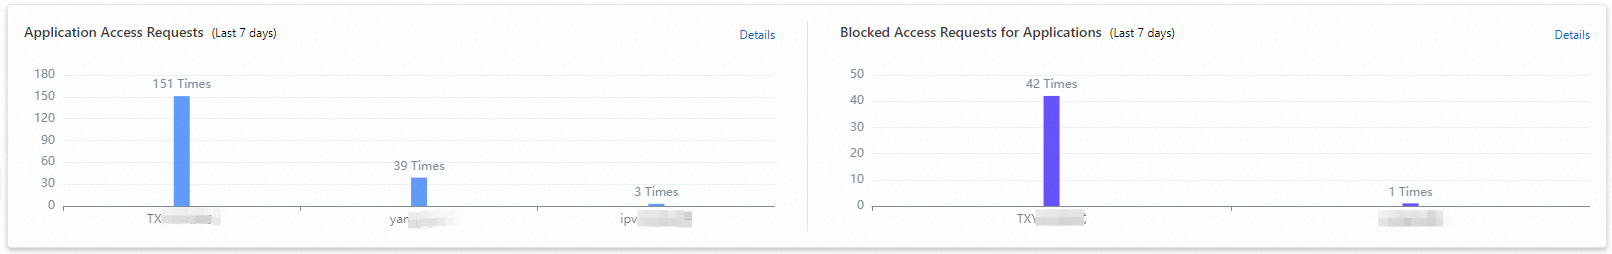
In the Application Access Requests and Blocked Access Requests for Applications sections, you can view the applications that are frequently used by users.
You can click Details to view more information about the access data of applications.
View bandwidth statistics
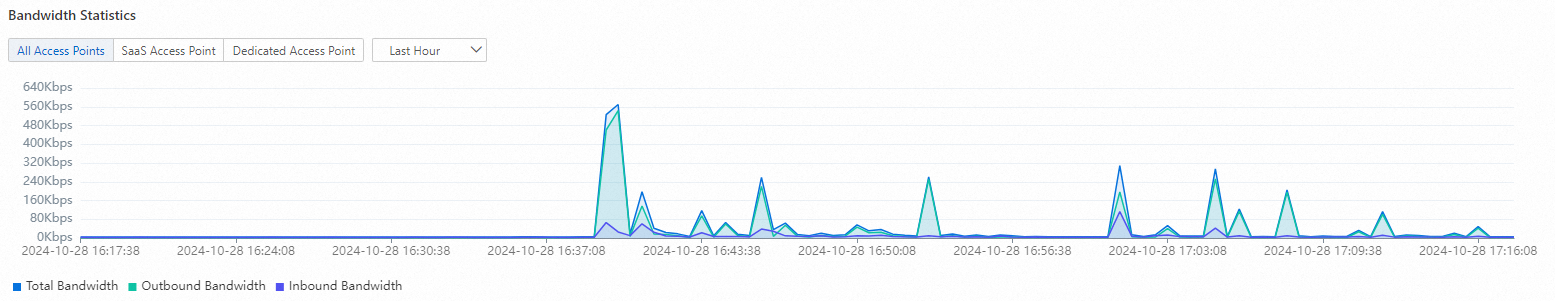
Traffic flow diagram

Total Bandwidth: the sum of the inbound bandwidth and outbound bandwidth that are generated by the private access and data loss prevention features
Outbound Bandwidth: the sum of the traffic generated by SASE when it sends requests to the origin server and the traffic generated by SASE when SASE sends responses to the SASE client
Inbound Bandwidth: the sum of the traffic generated by the SASE client when it sends requests to SASE and the traffic generated by the origin server when the origin server sends responses to SASE
You can check the bandwidth consumption and evaluate whether the bandwidth needs to be increased. The bandwidth is provisioned based on the account quota that you purchased. For more information, see Upgrade and downgrade.
Analyze private access traffic
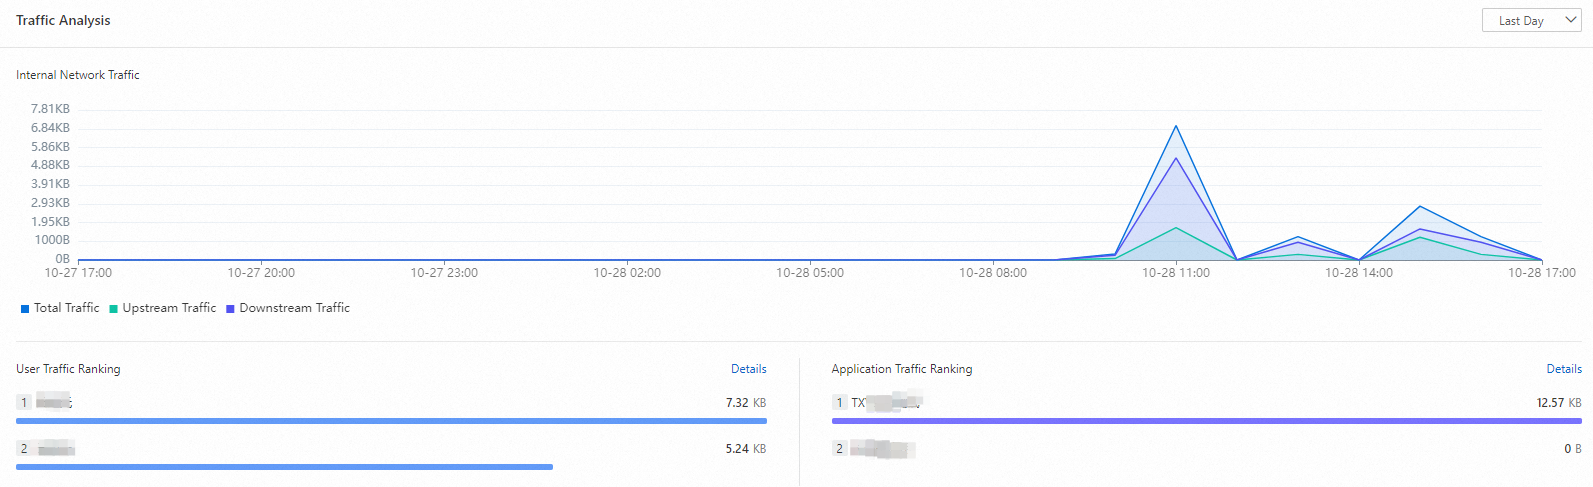
In the Internal Network Traffic section, you can view the private access traffic that is processed by SASE and analyze the traffic data by user and by application. This facilitates decision-making.
You can click Details to view more information about the traffic data of users and applications.
References
For more information about the SASE editions, see Billing overview.
For more information about terminal registration, see View the terminal list.
For more information about software configurations, see Manage software.