Slow page loading degrades user experience and is difficult to troubleshoot -- each user's load time varies by region, network, browser, and carrier, making the problem hard to reproduce. Most browser monitoring tools rely on the PerformanceTiming object, which captures only the full-page load time and excludes individual static resources like scripts, stylesheets, and images. Without resource-level visibility, you cannot pinpoint performance bottlenecks.
Application Real-Time Monitoring Service (ARMS) Browser Monitoring solves this with slow session tracing: a resource-level waterfall chart that replays exactly how a page loaded for a specific user session. This guide walks through enabling resource reporting, identifying slow sessions, and reading the waterfall chart to find the root cause.
Prerequisites
A web application connected to ARMS Browser Monitoring. See Implement browser monitoring by using CDN.
Enable Page Resources Reporting selected during setup.
ImportantThe ARMS Browser Monitoring SDK does not report static resource data by default. Slow session tracing requires this option. Without it, the waterfall chart has no resource-level data to display.
How it works
When page resource reporting is enabled, the ARMS Browser Monitoring SDK captures timing data for every static resource loaded on the page. Slow sessions automatically appear in the Slow Page Session Trace (TOP20) list on the Page Speed page. Selecting a session opens a waterfall chart that visualizes how each resource loaded and where time was spent.
Identify slow-loading pages
Two methods are available: start from aggregate page speed metrics to find problem pages, or search session traces directly when you already know which user or session to investigate.
Method 1: Start from page speed metrics
Log on to the ARMS console. In the left-side navigation pane, choose .
On the Browser Monitoring page, select a region in the top navigation bar and click the name of the target application.
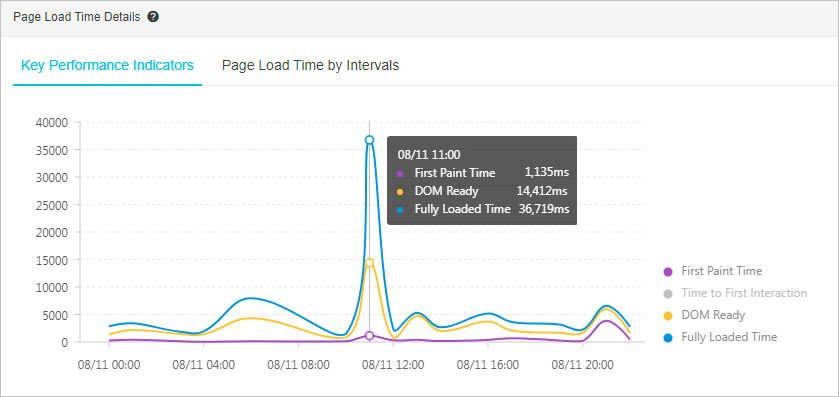
In the left-side navigation pane, choose . The Page Speed page shows page load metrics over time. Look for spikes in load time that indicate performance degradation. For example, the page is completely loaded in 36.7s at 11:00. For details about these metrics, see Page loading speed.
Scroll down to the Slow Page Session Trace (TOP20) section. The list shows the 20 slowest sessions within the selected time range. Each entry shows the page URL, session time, and total load duration. In this example, a session is loaded in 36.72s at 11:36:46, which causes the spike in the page loading time.
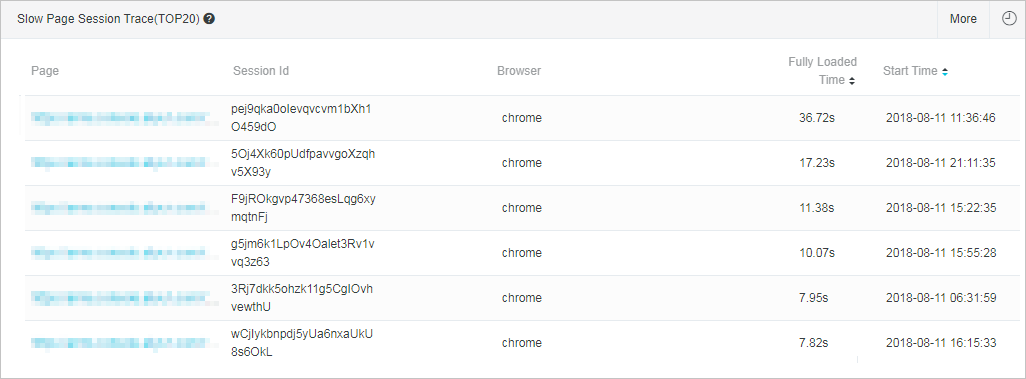
Click a page name in the Page column to open the Slow Loading Details page.
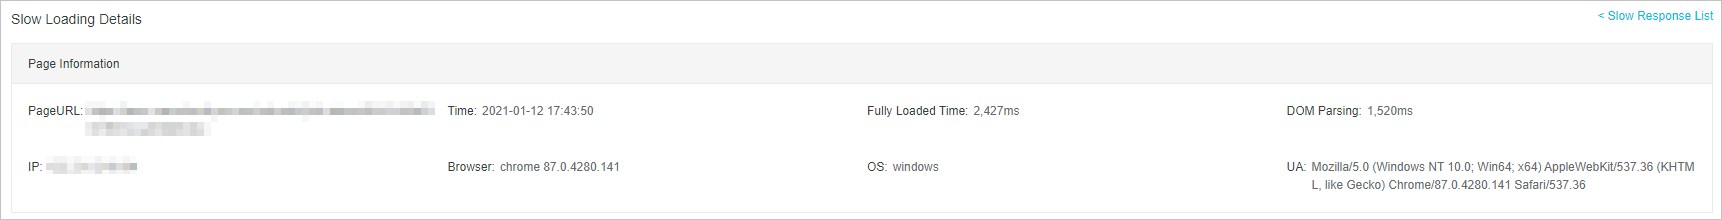
Review the session details:
Page Information (upper section): Shows the client IP address, browser, and operating system for this session. Use this to determine whether the issue is specific to a particular browser, region, or device.
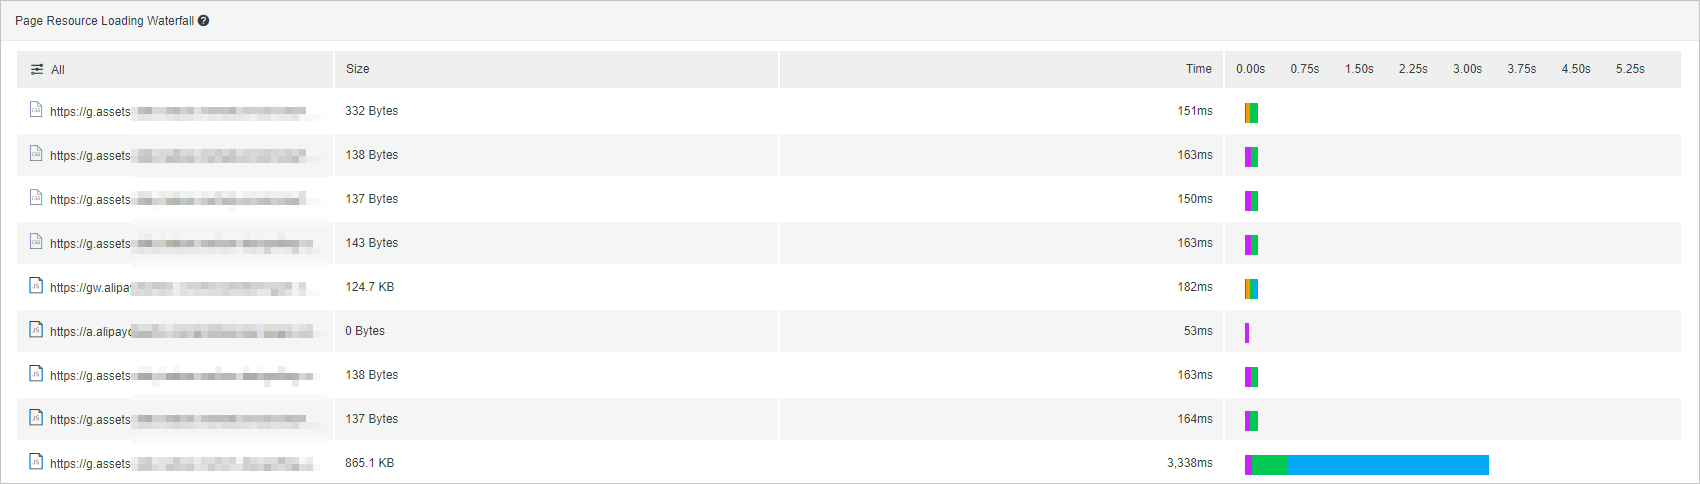
Page Resource Loading Waterfall (lower section): Displays a waterfall chart of every static resource loaded during the session. Each bar represents one resource and shows its timing breakdown.
Method 2: Search session traces directly
Use this method when you already have a specific username, user ID, or session ID to investigate.
Log on to the ARMS console. In the left-side navigation pane, choose .
On the Browser Monitoring page, select a region in the top navigation bar and click the name of the target application.
In the left-side navigation pane, choose .
In the Session List section, filter sessions by username, user ID, or session ID to locate the target session.
Click the session name to open the Session Tracking Details page and review the waterfall chart.
For more details about session tracing, see Slow session tracing.
Read the waterfall chart
The waterfall chart is the primary diagnostic tool. Each horizontal bar represents a single resource -- a JavaScript file, CSS file, image, or font. The bar's position on the timeline shows when loading started, and its length shows how long it took.
Resource timing phases
Each bar in the waterfall chart can be broken down into timing phases. Understanding these phases helps you identify whether a bottleneck is network-related, server-related, or bandwidth-related.
| Phase | What it measures | Diagnosis |
|---|---|---|
| DNS lookup | Time to resolve the domain name to an IP address | High values indicate DNS resolution issues. Consider using DNS prefetching or a faster DNS provider. |
| TCP connection | Time to establish a TCP connection with the server | High values suggest network latency. Check whether a closer CDN edge node is available. |
| SSL/TLS handshake | Time spent on the TLS handshake for HTTPS connections | High values may indicate the need for TLS session resumption or upgrading to TLS 1.3. |
| Time to first byte (TTFB) | Time from sending the request to receiving the first byte of the response | High values point to slow server-side processing. Investigate backend API performance. |
| Content download | Time to download the full response body | High values indicate large resource size or low bandwidth. Consider compression or reducing resource size. |
Common waterfall patterns
| Pattern | What it means | Likely fix |
|---|---|---|
| Long bar early in the timeline | A blocking resource delays everything after it | Defer or async-load the resource |
| Many bars stacking sequentially | Resources load one at a time instead of in parallel | Check for render-blocking resources or HTTP/1.1 connection limits |
| One resource much longer than others | A single large or slow resource | Compress the resource, use a CDN, or optimize server response time |
| Long gap before a resource starts | The browser waits for a prerequisite to finish | Review dependency chains and loading order |
| Multiple bars with long DNS/connection phases | Repeated connection setup to many different domains | Reduce the number of third-party domains or use connection preloading |
| Large download phase on specific resources | Uncompressed or oversized resources | Enable gzip/Brotli compression, optimize images, or minify JavaScript and CSS |
Diagnostic checklist
After opening the waterfall chart, check for these common issues:
Uncompressed text resources: JavaScript, CSS, and HTML files served without gzip or Brotli compression.
Oversized resources: Individual resources that could be optimized (minified, compressed, or split).
Poor cache utilization: Resources loaded repeatedly without browser caching. Check
Cache-Controlheaders.Slow third-party resources: External scripts (analytics, ads, social widgets) that block page rendering.
Render-blocking resources: CSS or synchronous JavaScript in the
<head>that delays first paint.
What's next
Set up alerts: Create alert rules to get notified when page load times exceed a threshold, instead of discovering issues after the fact. See Create and manage a Browser Monitoring alert rule.