The slow session tracing feature of Application Real-Time Monitoring Service (ARMS) provides a performance waterfall chart of static resource loading during the page loading process. You can view the status of page resource loading based on page performance data. This allows you to identify and handle performance bottlenecks at the earliest opportunity.
Prerequisites
- Your application is connected to ARMS frontend monitoring. For more information, see Browser monitoring overview.
- The configuration of the ARMS frontend monitoring SDK is modified.
By default, the SDK does not report data about static resources loaded on a page. To obtain such data and enable slow session tracing, set the sendResource parameter to true in the
configfile of the SDK. The following code shows an example of the SDK configuration:<script> !(function(c,b,d,a){c[a]||(c[a]={});c[a].config={pid:"atc889zkcf@8cc3f6354******",imgUrl:"https://arms-retcode.aliyuncs.com/r.png?",sendResource:true}; with(b)with(body)with(insertBefore(createElement("script"),firstChild))setAttribute("crossorigin","",src=d) })(window,document,"https://retcode.alicdn.com/retcode/bl.js","__bl"); </script> - The application is redeployed.
After the application is redeployed, when an onload event on the page is triggered, the data about static resources loaded on the current page is reported. Then, you can identify issues of slow page loading by using the ARMS frontend monitoring feature.
Go to the Session Traces page
- Log on to the ARMS console. In the left-side navigation pane, choose .
- On the Browser Monitoring page, select a region in the top navigation bar and click the name of the application that you want to manage.
- In the left-side navigation pane, choose .
Use case: Identify the page performance bottleneck
The following example shows how to identify the page performance bottleneck
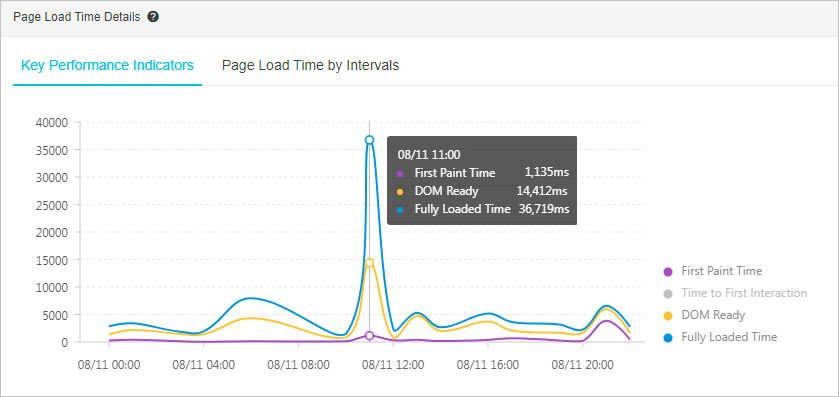
- In the left-side navigation pane, choose . The result is shown in the following figure. The loading time of the full page reaches 36.7s at 11:00.

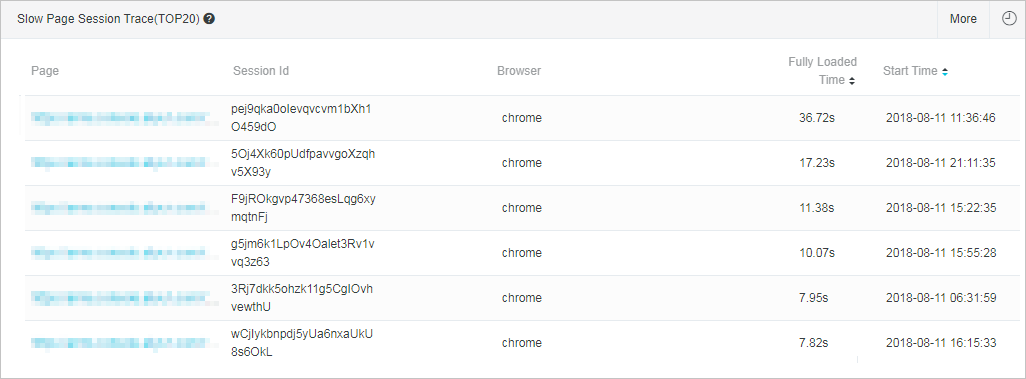
- On the Page Speed page, drag the right-side scroll bar to go to the Slow Page Session Trace (TOP20) section. This section lists the top 20 sessions with the lowest page loading speed within the specified period of time.
To change the specified time period, you can click the clock icon in the upper-right corner of this section and select a value.
The page loading speed of a session reaches 36.72s at 11:36:46, as shown in the following figure. This access is the direct cause of the sharp increase in the page loading time.

- In the Slow Page Session Trace(TOP20) section, click the name of the relevant page in the Page column.
On the Slow Loading Details page, you can view a waterfall chart of static resource loading. This helps you identify the performance bottleneck.

- In the Page Information section in the upper part of the Slow Loading Details page, view the access information such as the client IP address, browser, and operating system. This helps you further identify the cause and troubleshoot the bottleneck. For example, you can determine whether the bottleneck is caused by the network condition.

Another method to identify the performance bottleneck
In addition to the Page Speed page, you can also identify the performance bottleneck on the Session Traces page.
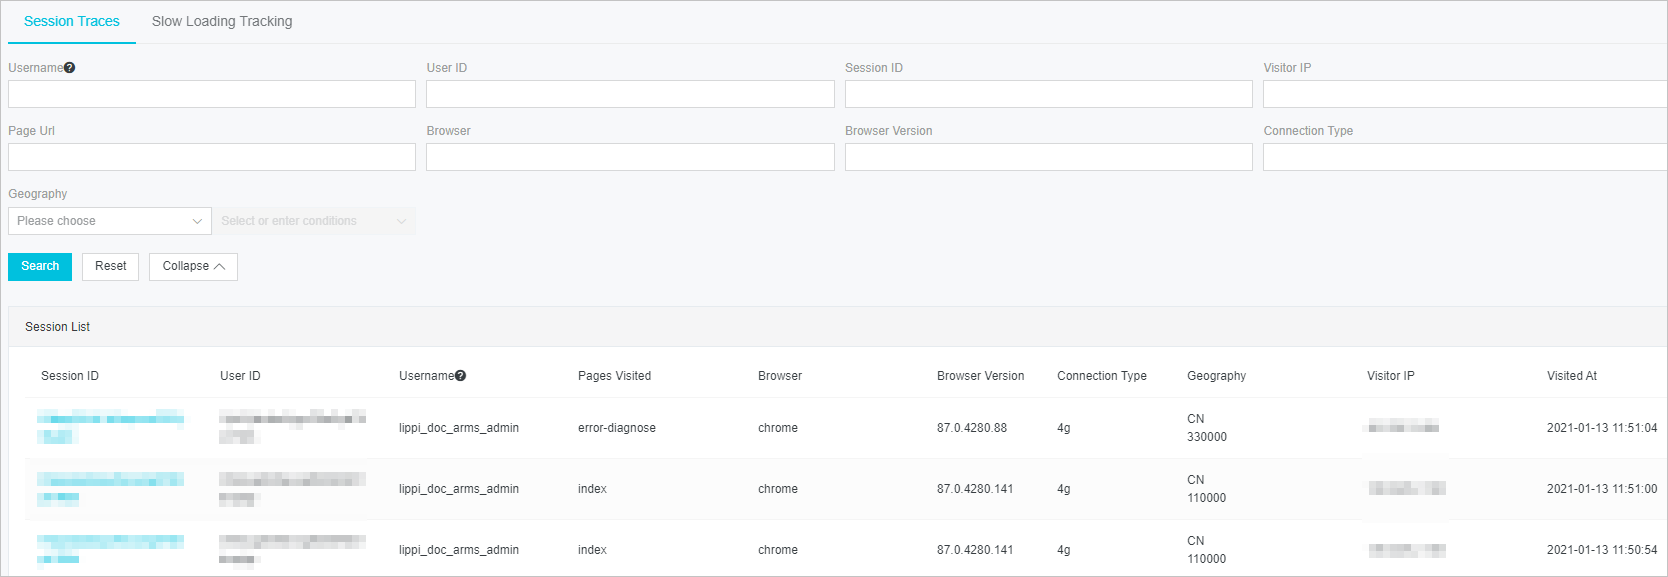
- In the left-side navigation pane, choose Session Traces. On the Session Traces page, view all the sessions of your application. You can filter sessions based on conditions such as the username, user ID, session ID, IP address, page URL, browser, browser version, network connection type, and region.

- In the Session ID column, click the ID of the session whose details you want to view. On the Session Details page, you can view the session overview and session traces. For more information, see Session tracing.
FAQ
- Why the value of the
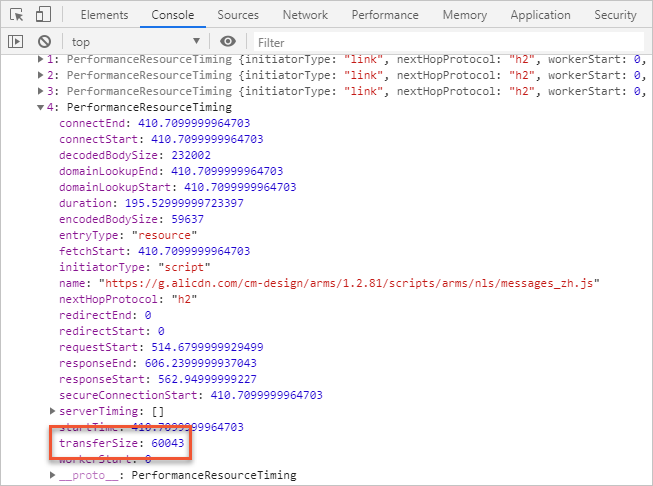
Sizeparameter is 0 on the waterfall chart of resource loading?The size is obtained by the PerformanceResourceTiming.transferSize interface. The read-only attribute of the transferSize parameter indicates the size of the extracted resource in eight bits. If resources are obtained from the on-premises cache or are cross-origin resources, the returned value of this parameter is 0.
Open the Chrome browser, press F12 to open the developer tool panel. When Disable cache on the Network tab is not selected, the value of the transferSize parameter is 0.

Solution
Select Disable cache. Then, the value of thetransferSizeparameter is displayed.
- Why the value of the
Timeparameter is 0 on the waterfall chart of resource loading?The time is obtained by the PerformanceResourceTiming.duration method.
On the waterfall chart of static resource loading, the value of theTimeparameter is sometimes 0. The reason is that the request hits a long cache that is controlled by themax-agemethod.Solution
Open the Chrome browser and press F12 to open the developer tool panel. Clear Disable cache on the Network tab and refresh the page. Then, the network access time is displayed.
- Why the returned value for the Time parameter is 0?
The value of many time-related parameters returned by an API request may be 0. The reason is that the point in time for obtaining cross-origin resources is 0 due to the same-origin policy. The following attributes are involved:
- redirectStart
- redirectEnd
- domainLookupStart
- domainLookupEnd
- connectStart
- connectEnd
- secureConnectionStart
- requestStart
- responseStart
Solution
Add
Timing-Allow-Originconfiguration, such asTiming-Allow-Origin:*, to the resource response header. - In which time range does the waterfall chart of API loading show the API loading status?
The following information shows the beginning and end of the time range on the waterfall chart of API loading:
- Beginning: the point in time when the page starts to load
- End: the point in time when the page is fully loaded plus 1 minute
The waterfall chart of API loading shows the overall status of the requested API during page loading.
- Why is the response time on the waterfall chart of API loading different from that on the waterfall chart of page resource loading?
The response time on the waterfall chart of API loading is several milliseconds longer than that on the waterfall chart of page resource loading, because the two values are obtained in different ways. The response time on the waterfall chart of API loading is calculated from the point in time when the API sends a request to the point in time when data is returned. The API response time on the waterfall chart of page resource loading is obtained by calling the
performance.getEntriesByType('resource')method that is provided by the browser.The several-millisecond difference does not affect the troubleshooting of performance bottlenecks.
- When is the beginning of the timeline on the waterfall chart of API loading?
The beginning of the timeline on the waterfall chart of API loading is the difference between the point in time when the API sends a request and the point in time when the value of the fetchStart parameter of the page is returned. This timeline displays when the API sends the request during page loading and its response time.