Application Real-Time Monitoring Service (ARMS) browser monitoring captures performance metrics, JavaScript errors, and API call data from real users. Adding a CDN-hosted script snippet to your HTML page is the fastest way to start collecting data. For the npm approach, see Install the browser monitoring agent by using npm.
Prerequisites
Before you begin, make sure that you have:
An Alibaba Cloud account with ARMS activated
A web application where you can edit the HTML source
(Optional)
sdk.rum.aliyuncs.comandarms-retcode.aliyuncs.comadded to your Content Security Policy (CSP) allowlist, if your application enforces CSP
Step 1: Create an application in the ARMS console
Log on to the ARMS console.
In the left-side navigation pane, choose Browser Monitoring > Browser Monitoring. In the top navigation bar, select a region.
On the Browser Monitoring page, click Create Application Site in the upper-right corner.
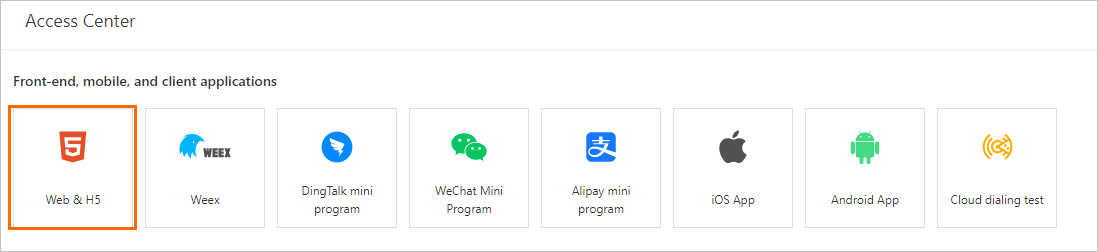
In the Frontend, Mobile, and Client Applications section of the Integration Center panel, click Web & H5.
In the Create an application step of the Integrate Web & H5 panel, enter a name for your application.
Step 2: Configure SDK extensions
In the Configuration items for the SDK extension step of the Integrate Web & H5 panel, select the options that match your monitoring needs. The console generates the agent code snippet based on your selections.
| Option | Description |
|---|---|
| Disable Automatic API Reporting | Stops automatic API success rate tracking. You must manually call __bl.api() to report the API success rate. |
| Enable Automatic SPA Resolution | Monitors the hashchange event and automatically reports page views (PVs). Select this option for single-page applications (SPAs). |
| Enable FMP Collection | Collects First Meaningful Paint (FMP) timing data. |
| Enable Page Resource Reporting | Reports static resources loaded on the page when the onload event fires. |
| Associated with Application Monitoring | Links API requests with ARMS Application Monitoring for end-to-end tracing. |
| Enable User Behavior Backtracking | Records user behavior traces that you can view in JS Error Diagnosis. |
| Enable Console Tracking | Traces user behavior in the console. The behavior can be error, warn, log, or info. |
Enabling Enable Console Tracking affects the path of the Console panel.
Step 3: Add the agent to your page
Choose one of the following CDN loading methods. Each has different trade-offs between page load performance and monitoring coverage.
| Method | Best for | Trade-off |
|---|---|---|
| Asynchronous loading | Page load speed is the priority | Cannot capture JavaScript errors or resource loading errors that occur before the SDK finishes initializing |
| Synchronous loading | Full error coverage from page load start | Blocks page rendering until the SDK finishes loading |
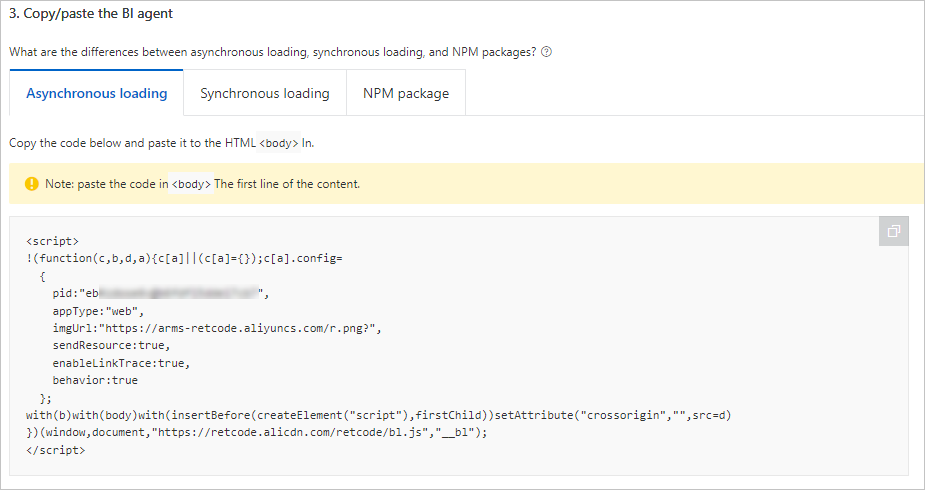
Asynchronous loading (recommended for performance)
The browser loads the SDK asynchronously without blocking page rendering.
Copy the generated snippet from the console and paste it as the first element inside the <body> tag of your HTML page, then restart your application.
HTML example:
<!DOCTYPE html>
<html>
<head>
<meta charset="utf-8" />
<meta http-equiv="x-ua-compatible" content="ie=edge,chrome=1" />
<meta name="viewport" content="width=device-width" />
<title>ARMS</title>
</head>
<body>
<script>
!(function (c, b, d, a) {
c[a] || (c[a] = {})
c[a].config = {
pid: '<your-pid>',
appType: 'web',
imgUrl: 'https://arms-retcode.aliyuncs.com/r.png?',
sendResource: true,
enableLinkTrace: true,
behavior: true,
useFmp: true,
enableSPA: true,
}
with (b)
with (body)
with (insertBefore(createElement('script'), firstChild))
setAttribute('crossorigin', '', (src = d))
})(window, document, 'https://sdk.rum.aliyuncs.com/v1/bl.js', '__bl')
</script>
<div id="app"></div>
</body>
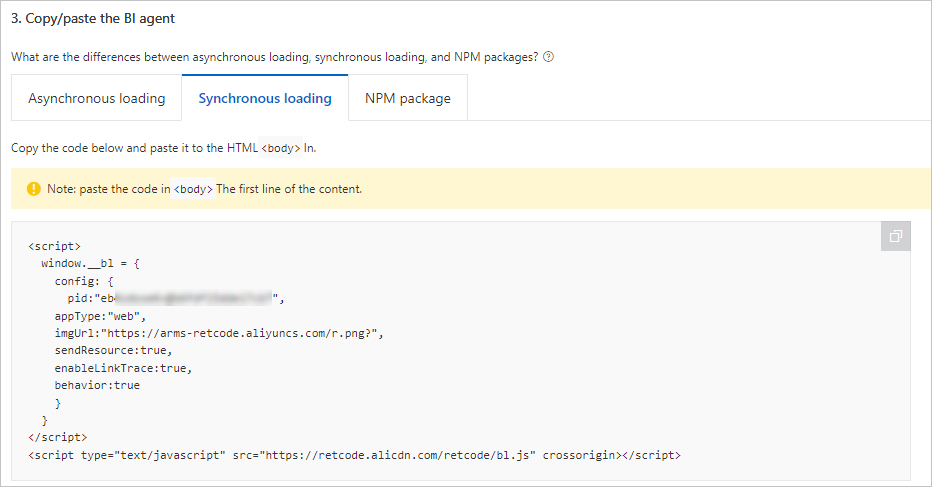
</html>Synchronous loading (recommended for full error coverage)
The browser blocks page rendering until the SDK finishes loading. Use this method to capture every JavaScript error and resource loading error from the start of the page lifecycle.
Copy the generated snippet from the console and paste it as the first element inside the <body> tag of your HTML page, then restart your application.
npm package
You can also install the browser monitoring agent by using npm.
Run the following command to install the npm package:
npm install alife-logger --saveRun the following command to initialize the npm package:
   const BrowserLogger = require('alife-logger');
   const __bl = BrowserLogger.singleton({pid:"b590lhguqs@8cc3f63543d****",appType:"web",imgUrl:"https://arms-retcode.aliyuncs.com/r.png?",sendResource:true,behavior:true,enableLinkTrace:true,enableConsole:true});
For details, see Install the browser monitoring agent by using npm.
Set a custom UID
By default, the SDK automatically generates a user ID (UID) to track unique visitors (UVs). This UID is updated every six months.
To associate monitoring data with your own user identifiers, such as login IDs, add the uid property to the config object:
uid: 'xxx' // Replace with your user identifier, such as a login IDExample with custom UID in the asynchronous loading snippet:
<script>
  !(function (c, b, d, a) {
    c[a] || (c[a] = {})
    c[a].config = {
      pid: '<your-pid>',
      appType: undefined,
      imgUrl: 'https://arms-retcode.aliyuncs.com/r.png?',
      uid: '<your-uid>',
    }
    with (b)
      with (body)
        with (insertBefore(createElement('script'), firstChild))
          setAttribute('crossorigin', '', (src = d))
  })(window, document, 'https://sdk.rum.aliyuncs.com/v1/bl.js', '__bl')
</script>If you change options in the SDK Extension Configuration section of the console, the generated code updates. Copy and paste the new snippet to your page.
Common SDK parameters
The following table lists frequently used parameters. Set these in the config object of the initialization snippet.
| Parameter | Type | Required | Default | Description |
|---|---|---|---|---|
pid | String | Yes | None | Unique project ID, auto-generated when you create the application site in ARMS. |
uid | String | No | Auto-generated | User identifier for tracking unique visitors. If not set, the SDK generates one and rotates it every six months. |
tag | String | No | None | Custom tag attached to every log entry. |
release | String | No | undefined | Application version string. Set this to compare monitoring data across releases. |
environment | String | No | prod | Deployment environment. Valid values: prod (production), gray (phased-release), pre (staging), daily (daily build), local (local development). |
sample | Integer | No | 1 | Sampling ratio for performance logs and successful API logs, from 1 to 100. Logs are sampled at a 1/sample ratio. For details, see Statistical metrics. |
behavior | Boolean | No | true | Records user behavior leading up to errors, useful for troubleshooting. |
enableSPA | Boolean | No | false | Listens for hashchange events and reports a new PV on each route change. Enable for SPAs. |
enableLinkTrace | Boolean | No | false | Enables front-to-back tracing, linking browser requests to server-side traces. For details, see Use the front-to-back tracing feature to diagnose API errors. |
For the full parameter list, see SDK reference.