In a microservices architecture, there are intricate dependencies between different types of services. If a problem occurs, it will be very difficult to locate the root cause. Usually, there isn't much time for root cause analysis. Locating the root cause of the problem in minimal time is the fundamental requirement of developers and operation personnel on the microservices monitoring product.
Conventional monitoring products provide three presentation forms: table, form, and dashboard. Due to their limitations, they cannot completely and intuitively provide users with the monitoring details required to quickly locate problems. Application Real-Time Monitoring Service (ARMS) launches a new feature—real-time 3D topology. This feature is a perfect solution to this problem. The ARMS 3D topology feature innovatively shows the real-time architectural hierarchy and relationships of system components in three-dimensions. It uses the ThreeJS front-end framework to create a three-dimensional monitoring space, allowing users to intuitively view the system architecture and status.
The most commonly seen interfaces of conventional monitoring products are table, form and dashboard. All these interfaces have limitations.
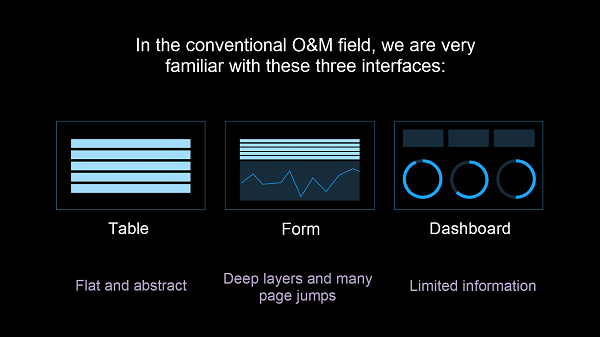
Due to limitations of these interfaces, we usually have to deal with dizzying tables and forms to locate a problem. We may easily lose ourselves in the massive amounts of data. To understand the relationships between the data, we can only rely on our experience and memory.
ARMS uses a real-time 3D approach (or the ARMS 3D topology) to present the stereoscopic view of the system. This allows users to quickly understand and trace relationships between system nodes.
First, we abstract the system from bottom up to three layers—the host layer, application layer, and the service layer. These three layers are also the focus of conventional monitoring methods. Modules in these three layers respectively represent the real host (ECS/physical machine), applications, and services of the system. The vertical connection lines represent the host's support for an application, and the attribution of service to an application.
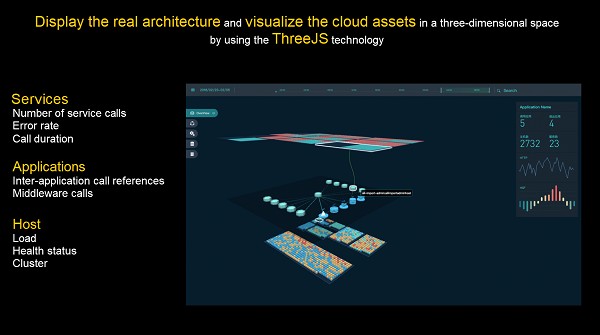
Users can both have an overview of the entire system, and zoom out or rotate a certain layer separately to view the detailed cluster and load information of the host; the interaction relationship between applications; and the number of calls and error rate of the services. Let's understand the content displayed at each layer in detail.
Contents displayed in the application layer are:
Simply put, this layer shows the applications themselves, the call references, and dependencies between the applications. When you click the application, the right panel will pop up to display the QPS, RT, and ERROR information of the application. In addition, the dynamic connection between them clearly shows the call references between different applications, the middleware used by the system, and even the health status of each host in the underlying host layer.
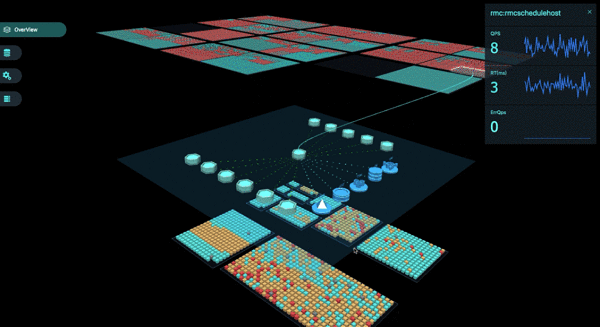
The service layer displays detailed service information provided by each application. If you place the pointer on the service, the service name appears. The colors indicate that the response time of a service exceeds the threshold (this can be configured) and requires attention.
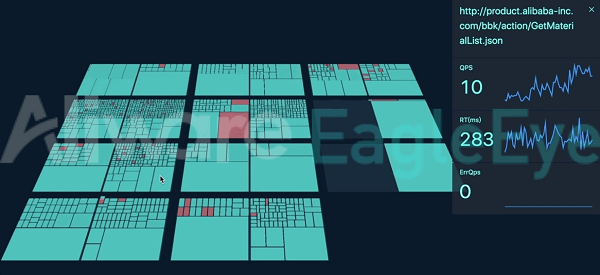
The host layer displays the host details of each application. You can click a host to see the CPU, MEM, and load information of the host. Indicators that exceed the threshold will be marked with colors. It also displays the static information of a host, such as the IDC where the host is located, the rack unit, host name, JVM, and the Tomcat version information.
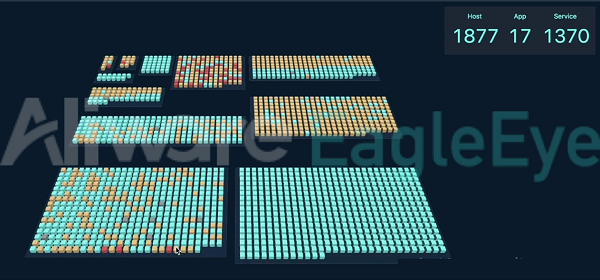
In the past, we may need a dozen page jumps from the faulty service layer to the application layer and then to the host layer. In the 3D world of ARMS 3D topology, we can complete these actions on one page. The 3D interactions—zooming in, zooming out, rotating, folding, and expanding perspectives, have replaced page jumps. No matter which machine or application you zoom in, you can quickly understand where you are in the system and the relationship with other layers. You won't lose track because of a long operating link.
Currently, the ARMS 3D topology feature is online. Users can view their system status in 3D after successful installation of the ARMS Agent, without additional operations or expenses.

The Application Real-Time Monitoring Service (ARMS) 3D topology feature provides a brand new interaction method, expands the dimensions for interacting with applications, and supports 360-degree diagnosis of performance bottlenecks and faulty nodes. These allow us to identify the applications and hosts related to a fault. This feature brings the applications closer to us.
Alibaba Cloud Hybrid Backup Recovery: Asia's First SAP-Certified Cloud Backup Product

2,599 posts | 764 followers
FollowAlibaba Clouder - November 30, 2018
Alibaba Clouder - March 5, 2021
Alibaba Cloud Native - August 14, 2024
Alibaba Cloud Native - September 12, 2024
Alibaba Cloud Native Community - February 13, 2023
Alibaba Cloud Native - March 6, 2024

2,599 posts | 764 followers
Follow Application Real-Time Monitoring Service
Build business monitoring capabilities with real time response based on frontend monitoring, application monitoring, and custom business monitoring capabilities
Learn More EDAS
EDAS
A PaaS platform for a variety of application deployment options and microservices solutions to help you monitor, diagnose, operate and maintain your applications
Learn More Simple Log Service
An all-in-one service for log-type data
Learn MoreMore Posts by Alibaba Clouder