By Bruce Wu
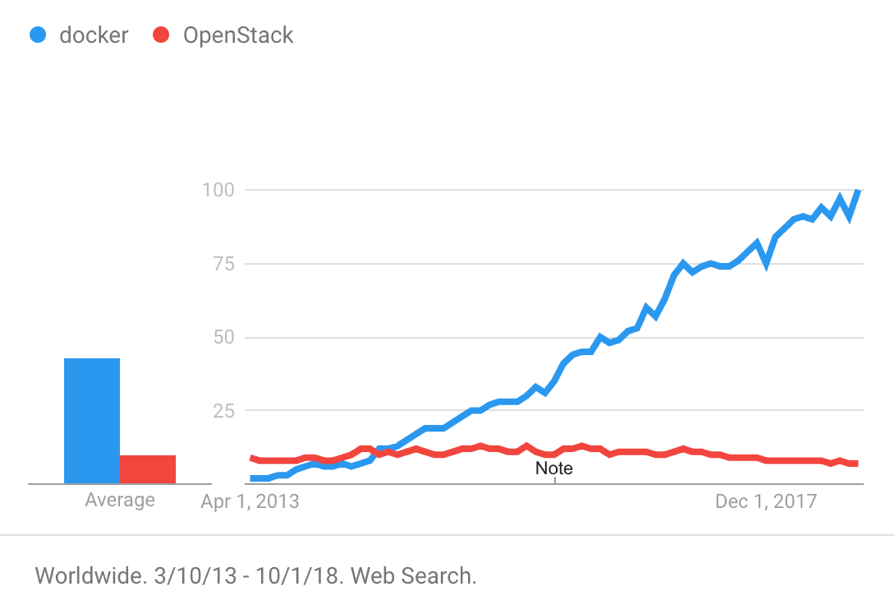
Docker, Inc. (formerly known as dotCloud, Inc) released Docker as an open source project in 2013. Then, container products represented by Docker quickly became popular around the world due to multiple features, such as their good isolation performance, high portability, low resource consumption, and rapid startup. The following figure shows the search trends for Docker and OpenStack starting from 2013.
The container technology brings about many conveniences, such as application deployment and delivery. It also brings about many challenges for log processing, such as:
This article describes some common methods and best practices for container log processing by taking Docker as an example. Concluded by the Alibaba Cloud Log Service team through hard work in the log processing field for many years, these methods and practices are:
To collect logs, you must first figure out where the logs are stored. This article shows you how to collect NGINX and Tomcat container logs.
Log files generated by NGINX are access.log and error.log. NGINX Dockerfile respectively redirect access.log and error.log to STDOUT and STDERR.
Tomcat generates multiple log files, including catalina.log, access.log, manager.log, and host-manager.log. tomcat Dockerfile does not redirect these logs to the standard output. Instead, they are stored inside the containers.
Most container logs are similar to NGINX and Tomcat container logs. We can categorize container logs into two types:
| Container log types | Description |
| Standard output | Information output through STDOUT and STDERR, including text files redirected to the standard output. |
| Text log | Logs that are stored inside the containers and are not redirected to the standard output. |
Standard output of containers is subject to unified processing of the logging driver. As shown in the following figure, different logging drivers write the standard output to different destinations.
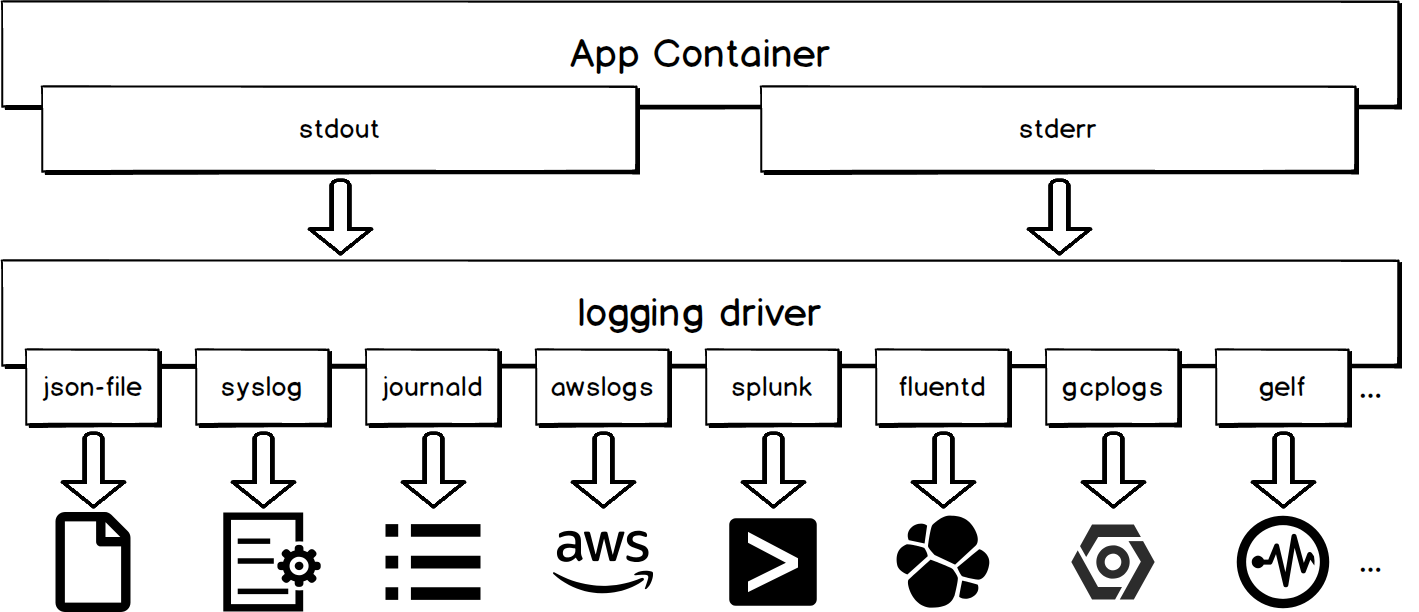
The advantage of collecting the standard output of container logs is that it is easy to use.
# You can use the following command to configure a syslog logging driver for all containers at the level of docker daemon.
dockerd -–log-driver syslog –-log-opt syslog-address=udp://1.2.3.4:1111

# You can use the following command to configure a syslog logging driver for the current container
docker run -–log-driver syslog –-log-opt syslog-address=udp://1.2.3.4:1111 alpine echo hello worldUsing logging drivers other than json-file and journald will make the docker logs API unavailable. Assume that you use portainer to manage containers on the host and use a logging driver other than json-file and journald to collect container logs. You will not be able to view the standard output of container logs through the user interface.
For containers that use logging drivers by default, you can obtain the standard output of container logs by sending the docker logs command to the docker daemon. Log collection tools that use this method include logspout and sematext-agent-docker. You can use the following command to obtain the latest five container logs starting from 2018-01-01T15:00:00.
docker logs --since "2018-01-01T15:00:00" --tail 5 <container-id>If you apply this method when there are many logs, you will significantly strain the docker daemon. As a result, the docker daemon will not be able to promptly respond to commands for creating and removing containers.
Logging drivers write container logs in Json format by default to the host file at /var/lib/docker/containers/<container-id>/<container-id>-json.log. This allows you to obtain the standard output of container logs by directly collecting the host file.
We recommend that you collect container logs by collecting the json-file files. This does not cause the docker logs API to become unavailable or affect the docker daemon. In addition, many tools provide native support for collecting host files. Filebeat and Logtail are representatives of these tools.
The simplest way to collect text log files in containers is to mount the host file directory to the directory of container logs. You can do this by using the bind mounts or volumes method when you start the container, as shown in the following figure.
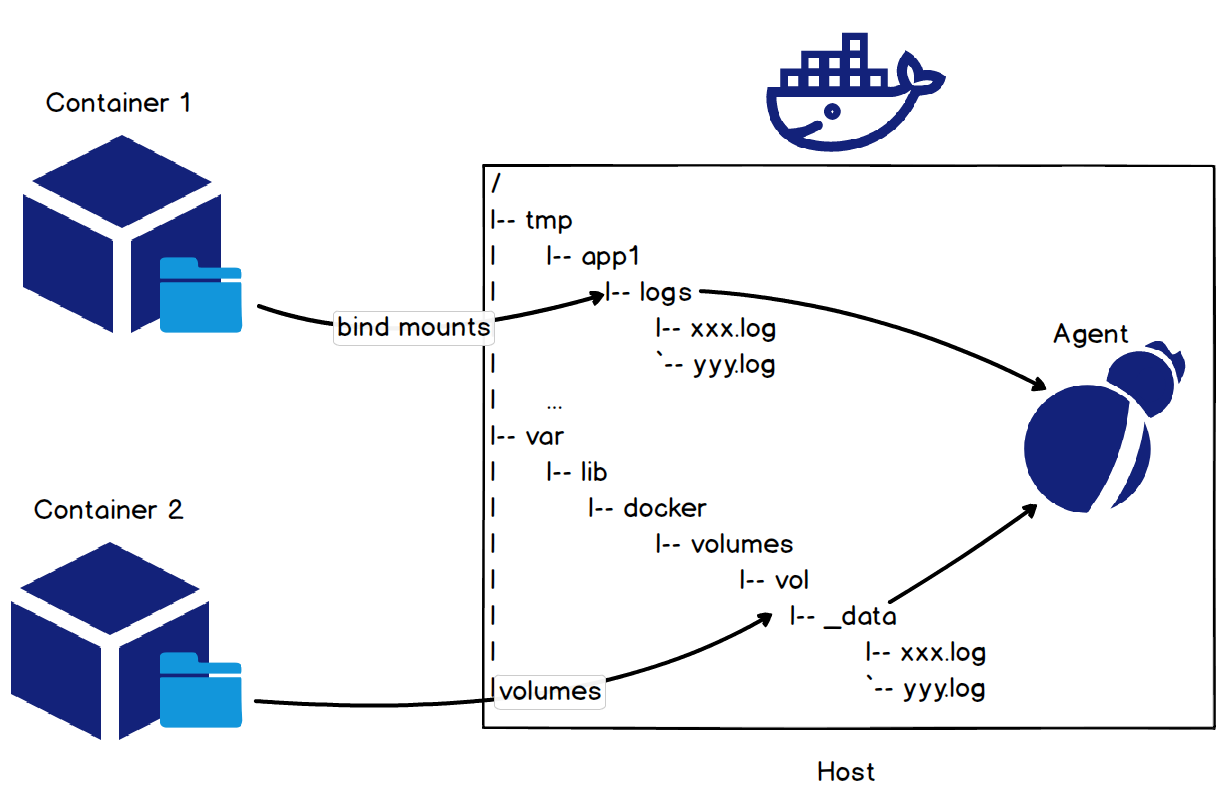
For access logs of a Tomcat container, use the command docker run -it -v /tmp/app/vol1:/usr/local/tomcat/logs tomcat to mount the host file directory /tmp/app/vol1 to the access log directory /usr/local/tomcat/logs of the container. This allows you to collect access logs of the Tomcat container by collecting logs under the host file directory /tmp/app/vol1.
Collecting container logs by mounting the host file directory is a little intrusive to the application, because this needs you to run the mounting command when you start the container. If the log collection process is transparent to users, that would be perfect. In fact, this can be achieved by calculating the mount point of the container rootfs.
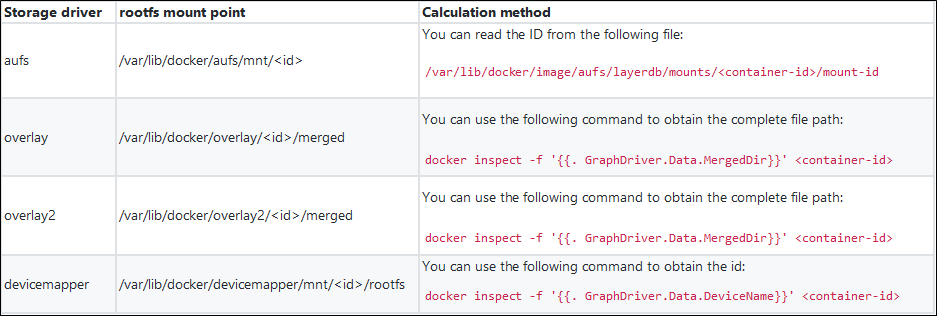
Storage driver is a concept that is closely related to the mount point of the container rootfs. During actual use, you may choose the best fit storage driver based on various factors such as the Linux version, file system type, and container I/O. We can calculate the mount point of the container rootfs based on the type of the storage driver, and then collect logs inside containers. The following table lists the rootfs mount points of some storage drivers and the calculation method.
After comprehensively comparing various container log collection methods, and summarizing and sorting user feedback and appeals, the Log Service team develops an all-in-one solution for processing container logs.
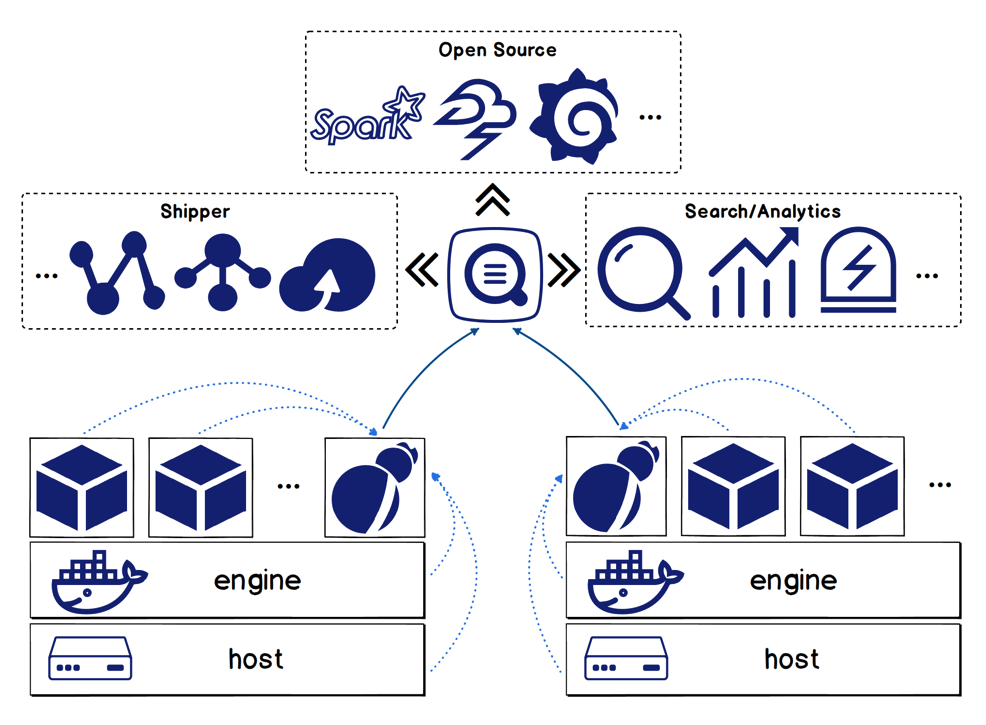
The Logtail solution has the following features:
Logtail is deeply integrated with the K8s ecosystem, and is able to conveniently collect K8s container logs. This is another features of Logtail.
Collection configuration management:
Collection modes:
For more information about the Logtail solution, see https://www.alibabacloud.com/help/doc-detail/44259.htm
After collecting logs, you need to perform query analysis and visualization of these logs. We'll take Tomcat container logs as an example to describe the powerful query, analysis, and visualization features provided by Log Service.
When container logs are collected, log identification information such as container name, container IP, and target file directory is attached to these logs. This allows you to quickly locate the target container and files based on this information when you run queries. For more information about the query feature, see Query syntax.
The Real-time analysis feature of Log Service is compatible with the SQL syntax and offers more than 200 aggregate functions. If you know how to write SQL statements, you will be able to easily write analytic statements that meet your business needs. For example:
* | SELECT request_uri, COUNT(*) as c GROUP by request_uri ORDER by c DESC LIMIT 102. You can use the following statement to query for the network traffic difference between the last 15 minutes and the last hour.
* | SELECT diff[1] AS c1, diff[2] AS c2, round(diff[1] * 100.0 / diff[2] - 100.0, 2) AS c3 FROM (select compare( flow, 3600) AS diff from (select sum(body_bytes_sent) as flow from log))This statement calculates the data volume of different periods by using the year-on-year and period-over-period comparison functions.
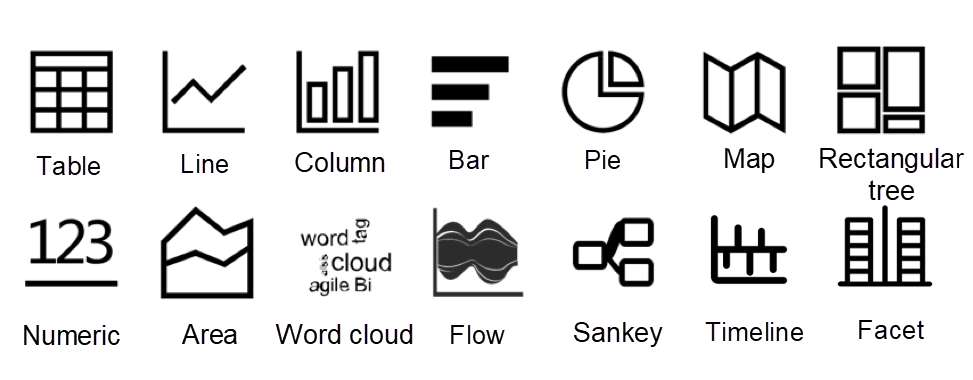
To visualize data, you can use multiple built-in charts of Log Service to visually display SQL computation result and combine multiple charts into a dashboard.
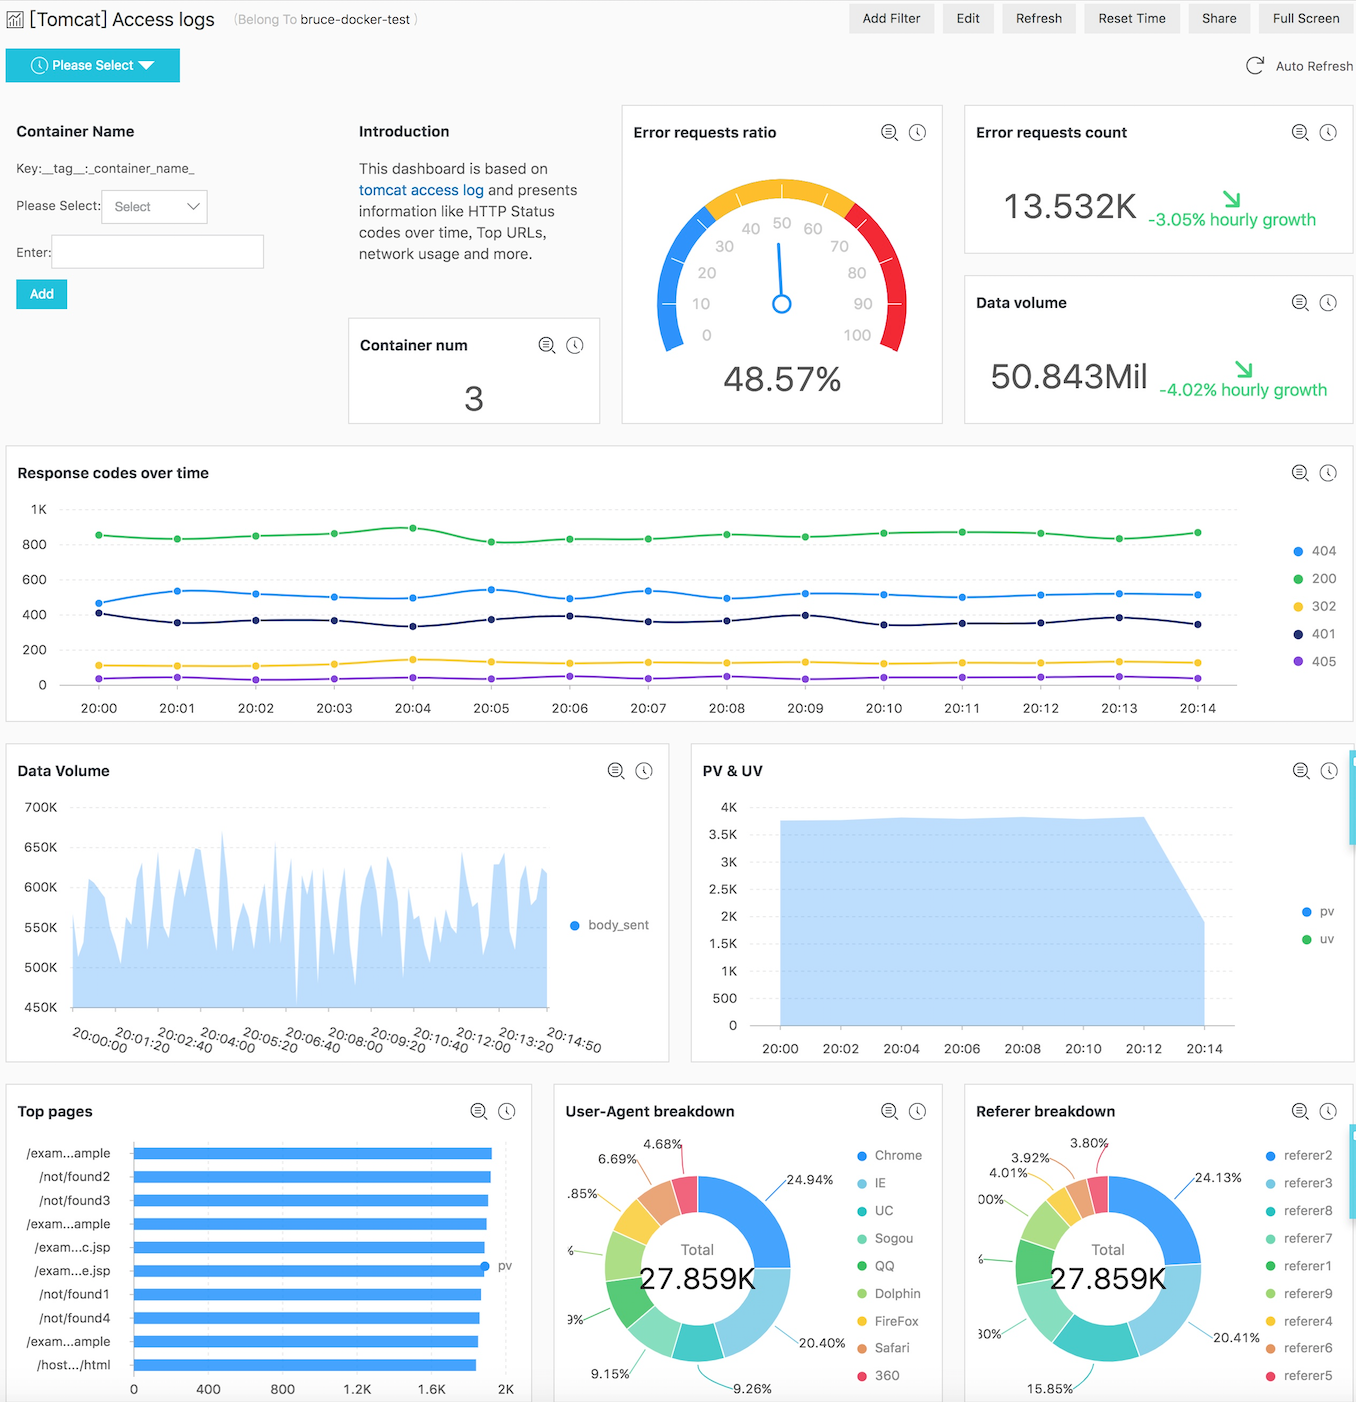
The following figure shows a dashboard for Tomcat access logs. You can see various information from this dashboard, such as the error requests ratio, data volume, and response codes over time. This dashboard presents the results of aggregated data of multiple Tomcat containers. You can also specify the container name by using the Dashboard Filter feature to view data of individual containers.
Features such as query analysis and dashboards can help us view the global information and understand the overall operation status of the system. However, to locate specific problems, we usually need context information from logs.
Context refers to clues to a problem, such as the information before and after an error in a log. The context involves two elements:
The following table shows the minimum differentiation granularity of different data sources.

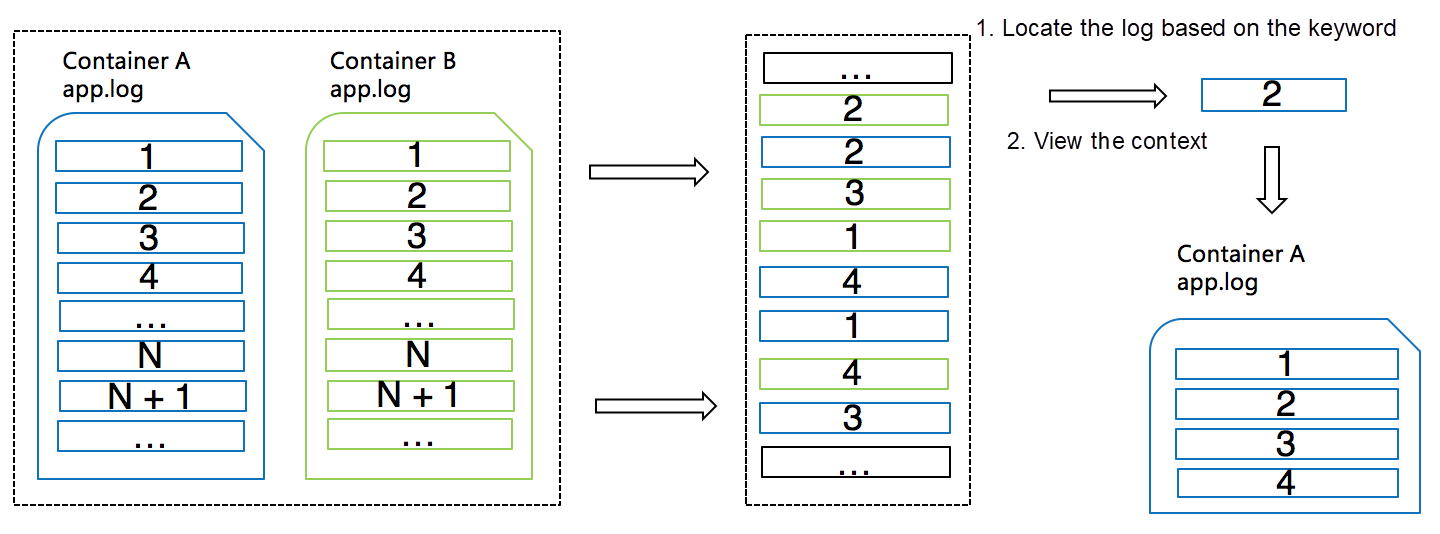
On the background of centralized log storage, neither the log collection terminal nor the server can keep the original order of logs:
Log Service effectively solves these challenges by adding some additional information to each log record, and by using the keyword query capability of the server. The following figure shows how Log Service addresses these problems.
Apart from viewing the log context, sometimes we also want to continuously monitor the container output.
The following table shows how to monitor container logs in real time by using the traditional method.
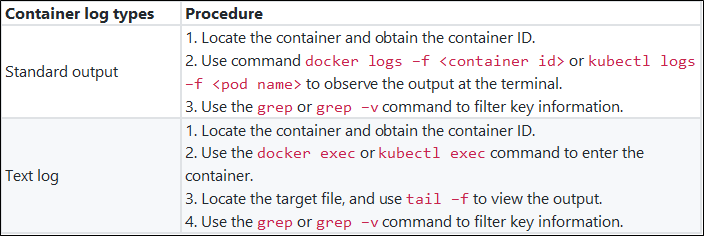
Using traditional methods to monitor container logs has the following pain points:
To address these problems, Log Service offers the LiveTail feature. Comparing with the traditional method, LiveTail has the following advantages:
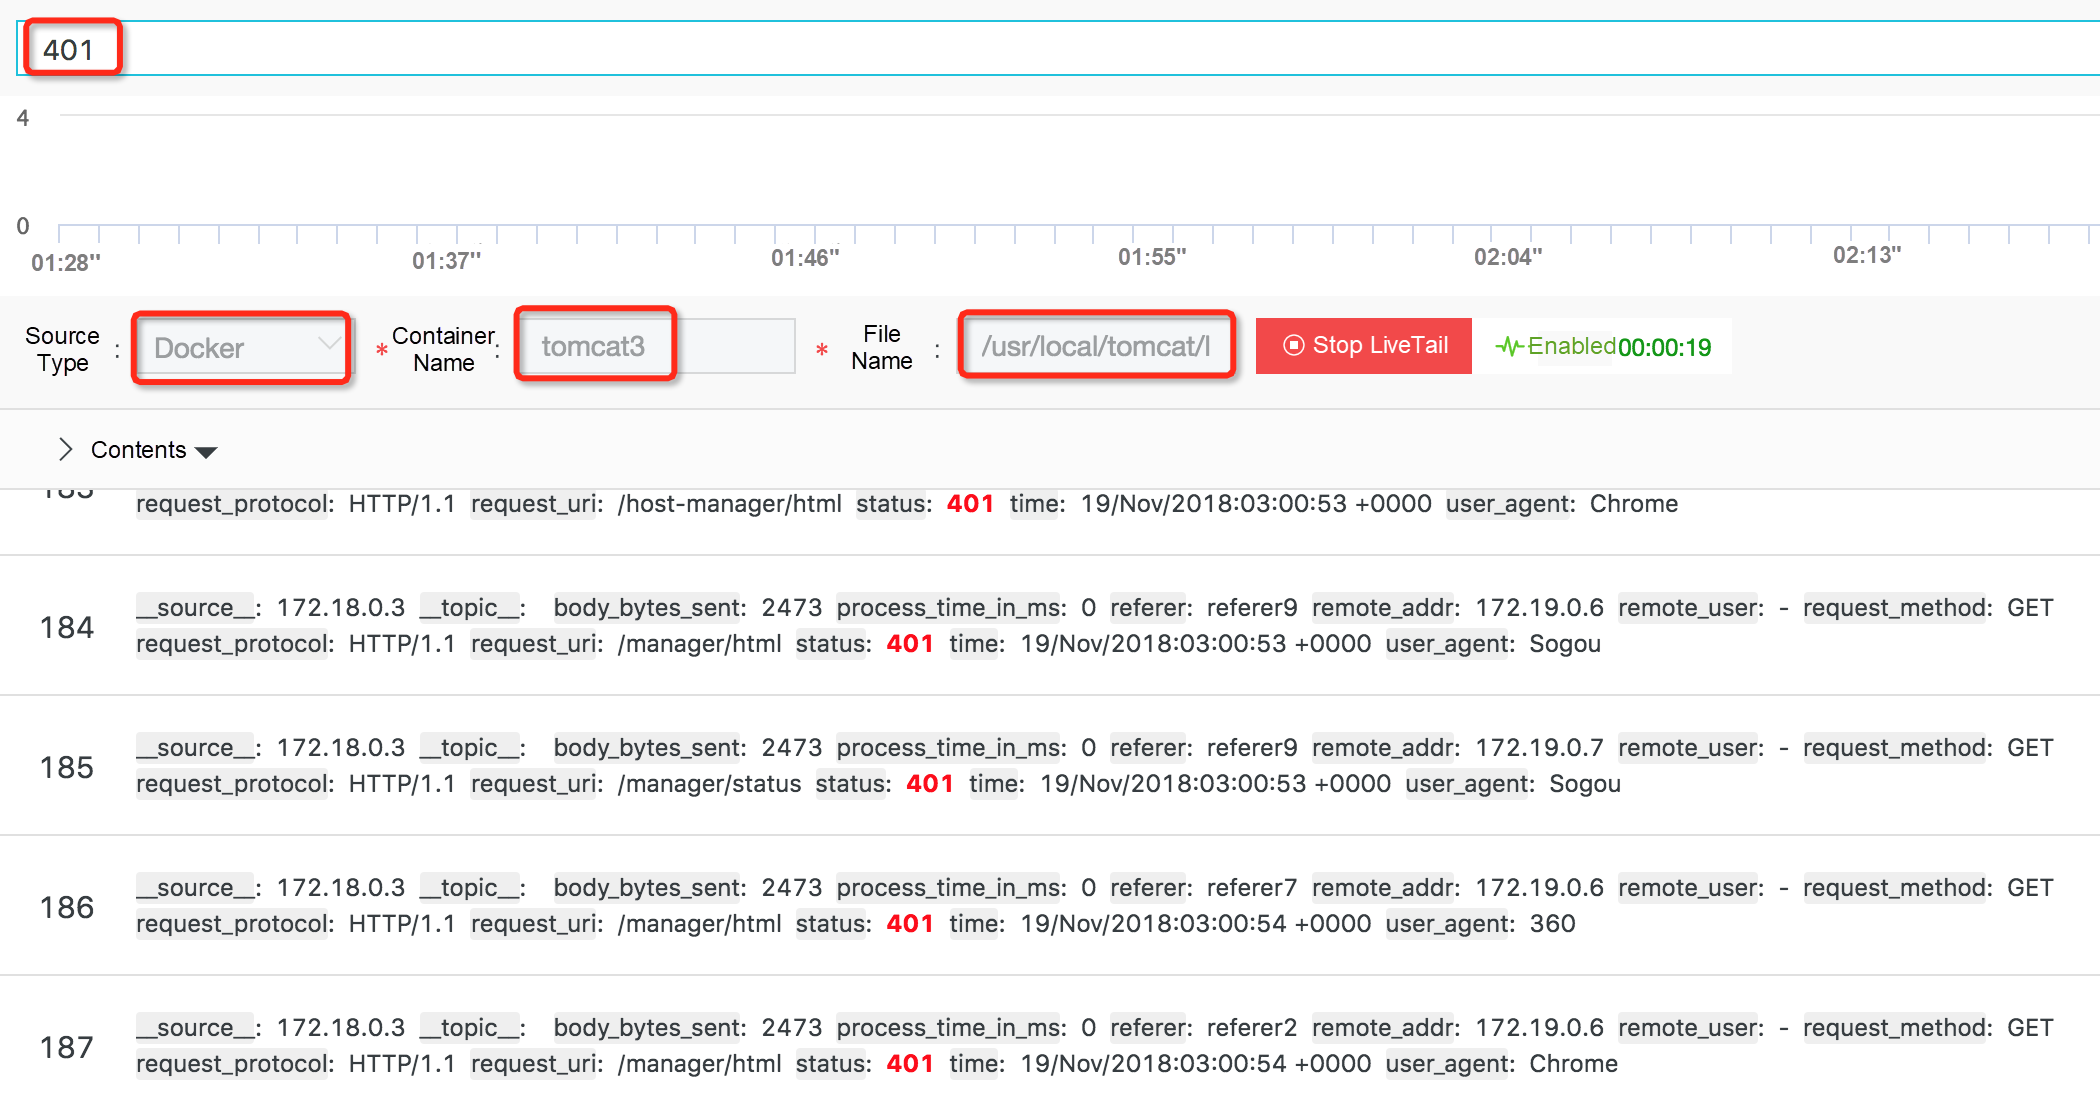
LiveTail is able to quickly locate the target container and target files by using the context query mechanism as mentioned in the previous section. Then, the client regularly sends requests to the server to pull the latest data.

57 posts | 12 followers
FollowAlibaba Clouder - August 3, 2020
Alibaba Developer - September 6, 2021
Alibaba Cloud Native - February 15, 2023
Alibaba Cloud Native Community - August 5, 2025
Alibaba Cloud Native Community - August 19, 2025
Alibaba Cloud Blockchain Service Team - August 29, 2018

57 posts | 12 followers
Follow Big Data Consulting for Data Technology Solution
Alibaba Cloud provides big data consulting services to help enterprises leverage advanced data technology.
Learn More Big Data Consulting Services for Retail Solution
Alibaba Cloud experts provide retailers with a lightweight and customized big data consulting service to help you assess your big data maturity and plan your big data journey.
Learn More Simple Log Service
An all-in-one service for log-type data
Learn More Data Lake Storage Solution
Build a Data Lake with Alibaba Cloud Object Storage Service (OSS) with 99.9999999999% (12 9s) availability, 99.995% SLA, and high scalability
Learn MoreMore Posts by Alibaba Cloud Storage