Written by Liu Xiaoguo, an advocate of the China Elasticsearch Community
Edited by Lettie and Dayu
Released by ELK Geek
This article gives a detailed description of the use of Filebeat to transfer MySQL log information to Elasticsearch.
You need to install MySQL by running the following commands:
# yum install mysql-server
# systemctl start mysqld
# systemctl status mysqld
####Use mysqladmin to set the root password#####
# mysqladmin -u root password "123456"
Next, configure an error log file and a slow query log file in my.cnf. These configurations are disabled by default and need to be manually enabled. You can also enable the temporary slow log feature by running the following commands:
# vim /etc/my.cnf
[mysqld]
log_queries_not_using_indexes = 1
slow_query_log=on
slow_query_log_file=/var/log/mysql/slow-mysql-query.log
long_query_time=0

[mysqld_safe]
log-error=/var/log/mysql/mysqld.log
Note: MySQL does not automatically create log files. Therefore, you need to manually create one. After a log file is created, grant the read and write permissions to all users. For example, run the chmod 777 slow-mysql-query.log statement.
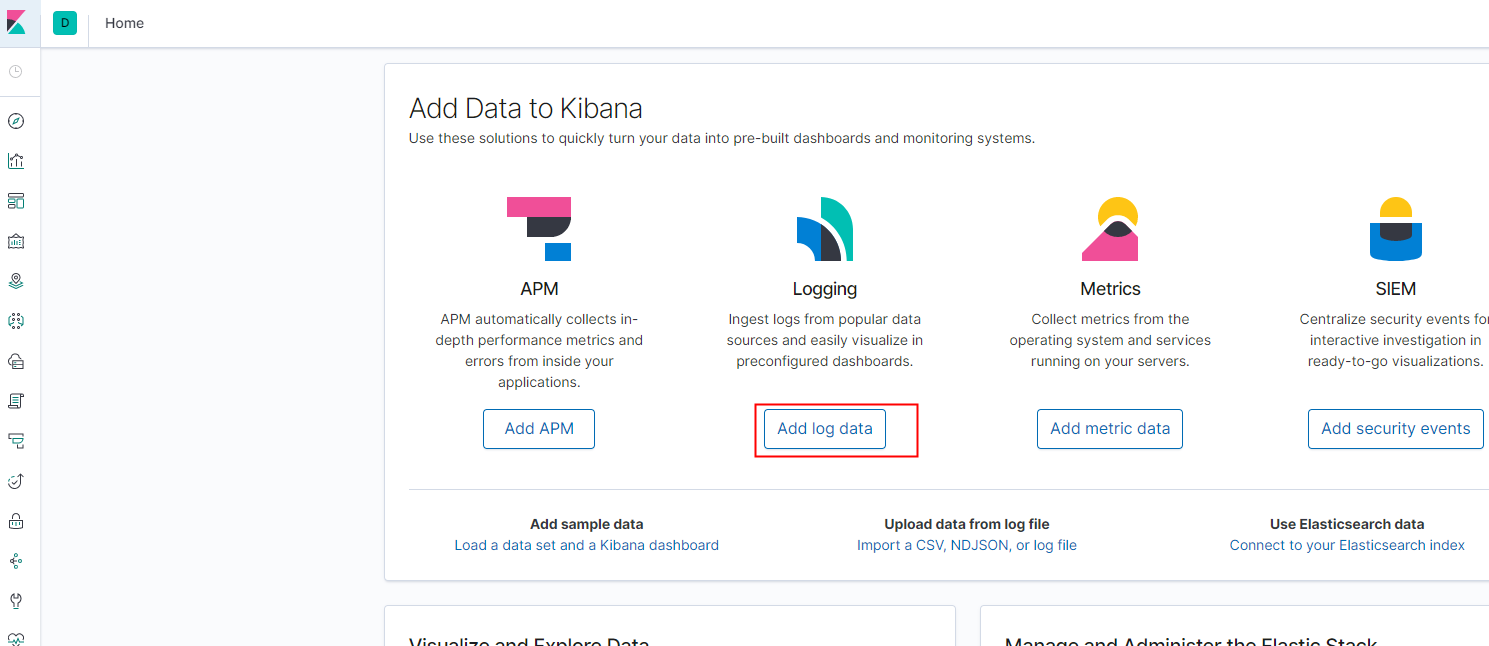
To install Filebeat on CentOS, log on to the Elasticsearch console, go to the Kibana console, click Home, and click Add log data.
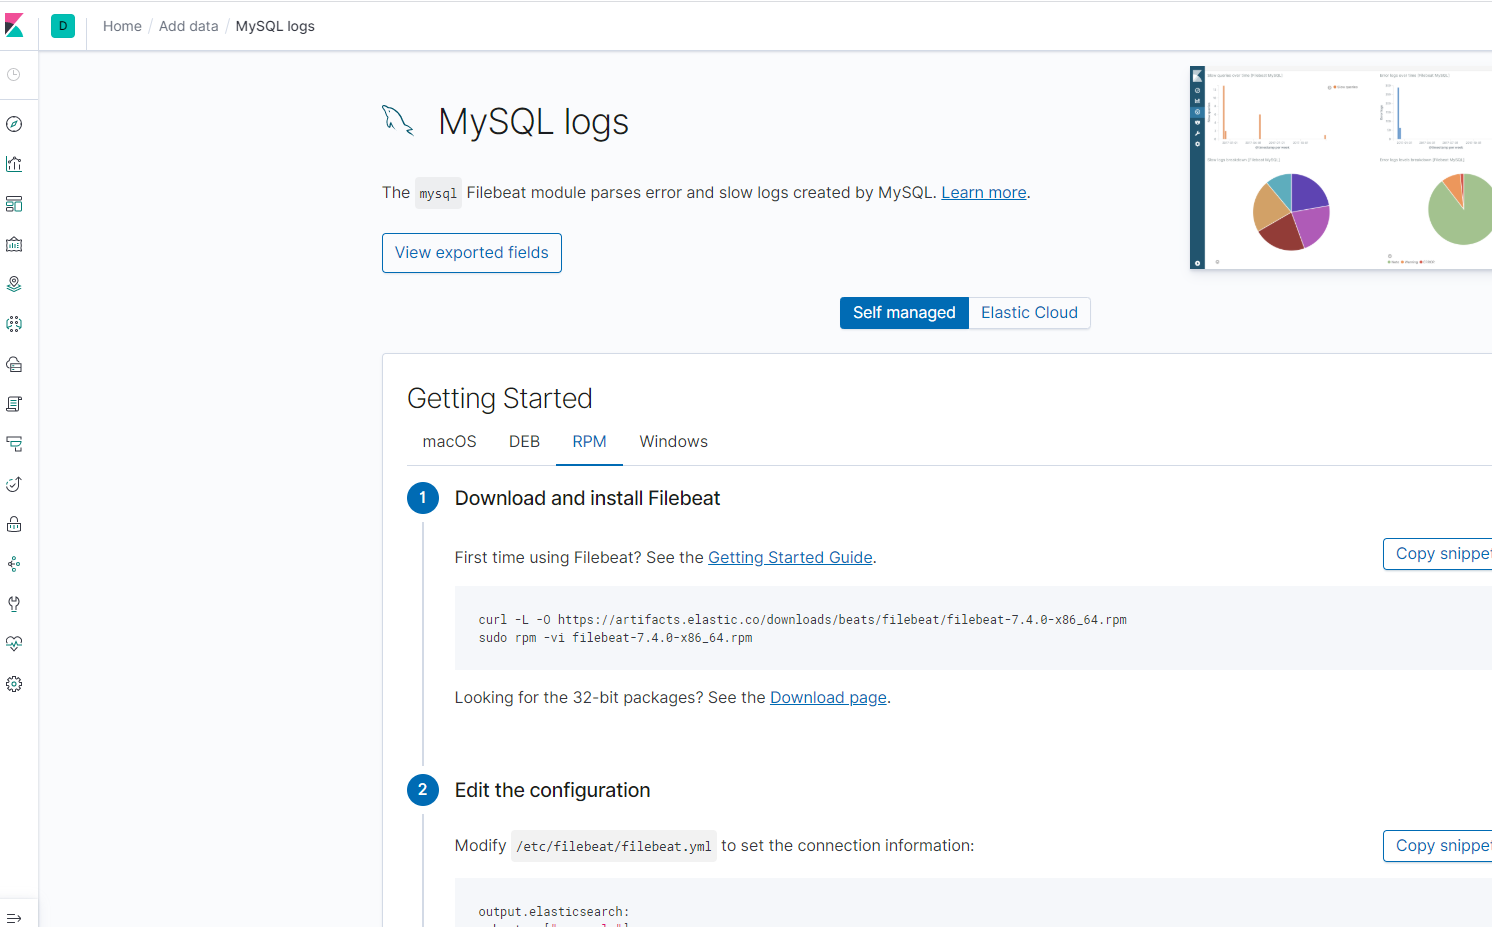
Install Filebeat and make modifications step by step according to the requirements on the page. When you modify the filebeat.yml file, consider the following steps:
filebeat.config.modules:
  # Glob pattern for configuration loading
  path: /etc/filebeat/modules.d/mysql.yml

  # Set to true to enable config reloading
  reload.enabled: true

  # Period on which files under path should be checked for changes
  reload.period: 1s
MySQL detects error logs and slow logs separately. Therefore, you need to specify the paths of your error log and slow log by using modules. The modules are dynamically loaded, so the paths are used to specify the locations of modules.
setup.kibana:

  # Kibana Host
  # Scheme and port can be left out and will be set to the default (http and 5601)
  # In case you specify and additional path, the scheme is required: http://localhost:5601/path
  # IPv6 addresses should always be defined as: https://[2001:db8::1]:5601
host: "https://es-cn-0p11111000zvqku.kibana.elasticsearch.aliyuncs.com:5601"output.elasticsearch:
# Array of hosts to connect to.
hosts: ["es-cn-0p11111000zvqku.elasticsearch.aliyuncs.com:9200"]
# Optional protocol and basic auth credentials.
#protocol: "https"
username: "elastic"
password: "elastic@333"# sudo filebeat modules enable mysql
# vim /etc/filebeat/modules.d/mysql.yml
- module: mysql
# Error logs
error:
enabled: true
var.paths: ["/var/log/mysql/mysqld.log"]
# Set custom paths for the log files. If left empty,
# Filebeat will choose the paths depending on your OS.
#var.paths:
# Slow logs
slowlog:
enabled: true
var.paths: ["/var/log/mysql/slow-mysql-query.log"]
# Set custom paths for the log files. If left empty,
# Filebeat will choose the paths depending on your OS.
#var.paths:Run the following commands to upload the dashboard, pipeline, and template information to Elasticsearch and Kibana.
# sudo filebeat setup
# sudo service filebeat startRestart and query the MySQL database, so that a slow log and an error log are generated accordingly.
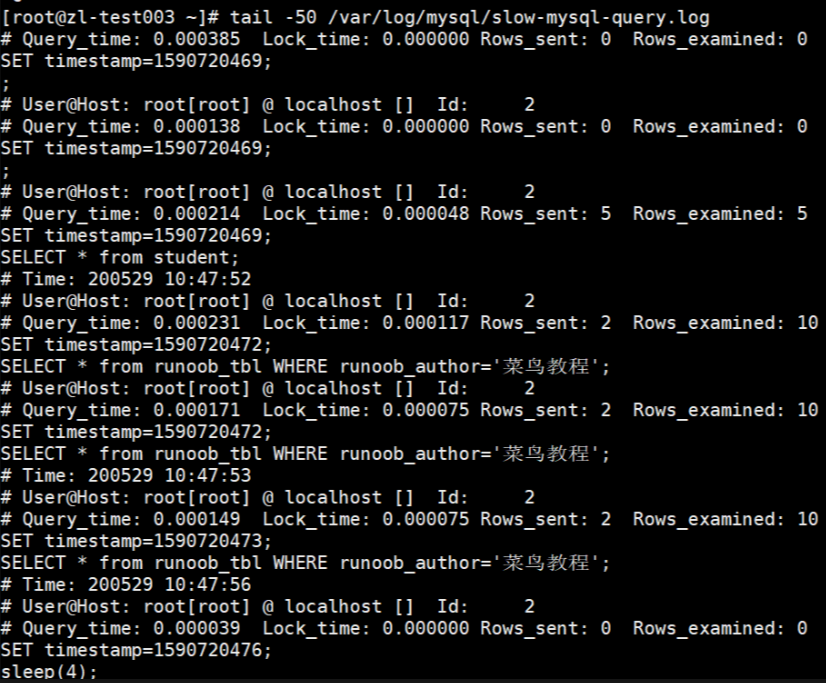
Part of the slow query log
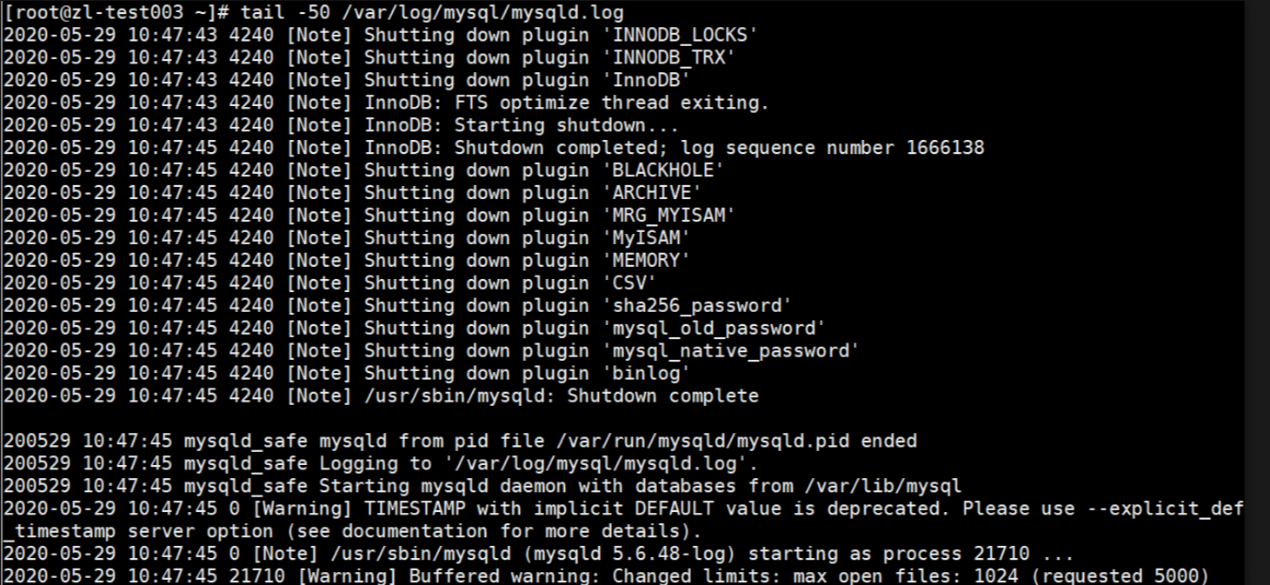
Part of the error log
Go to the Kibana dashboard [Filebeat MySQL] Overview ECS and view the collected data. Here, you can see all the information about MySQL, including the following queries and error logs.
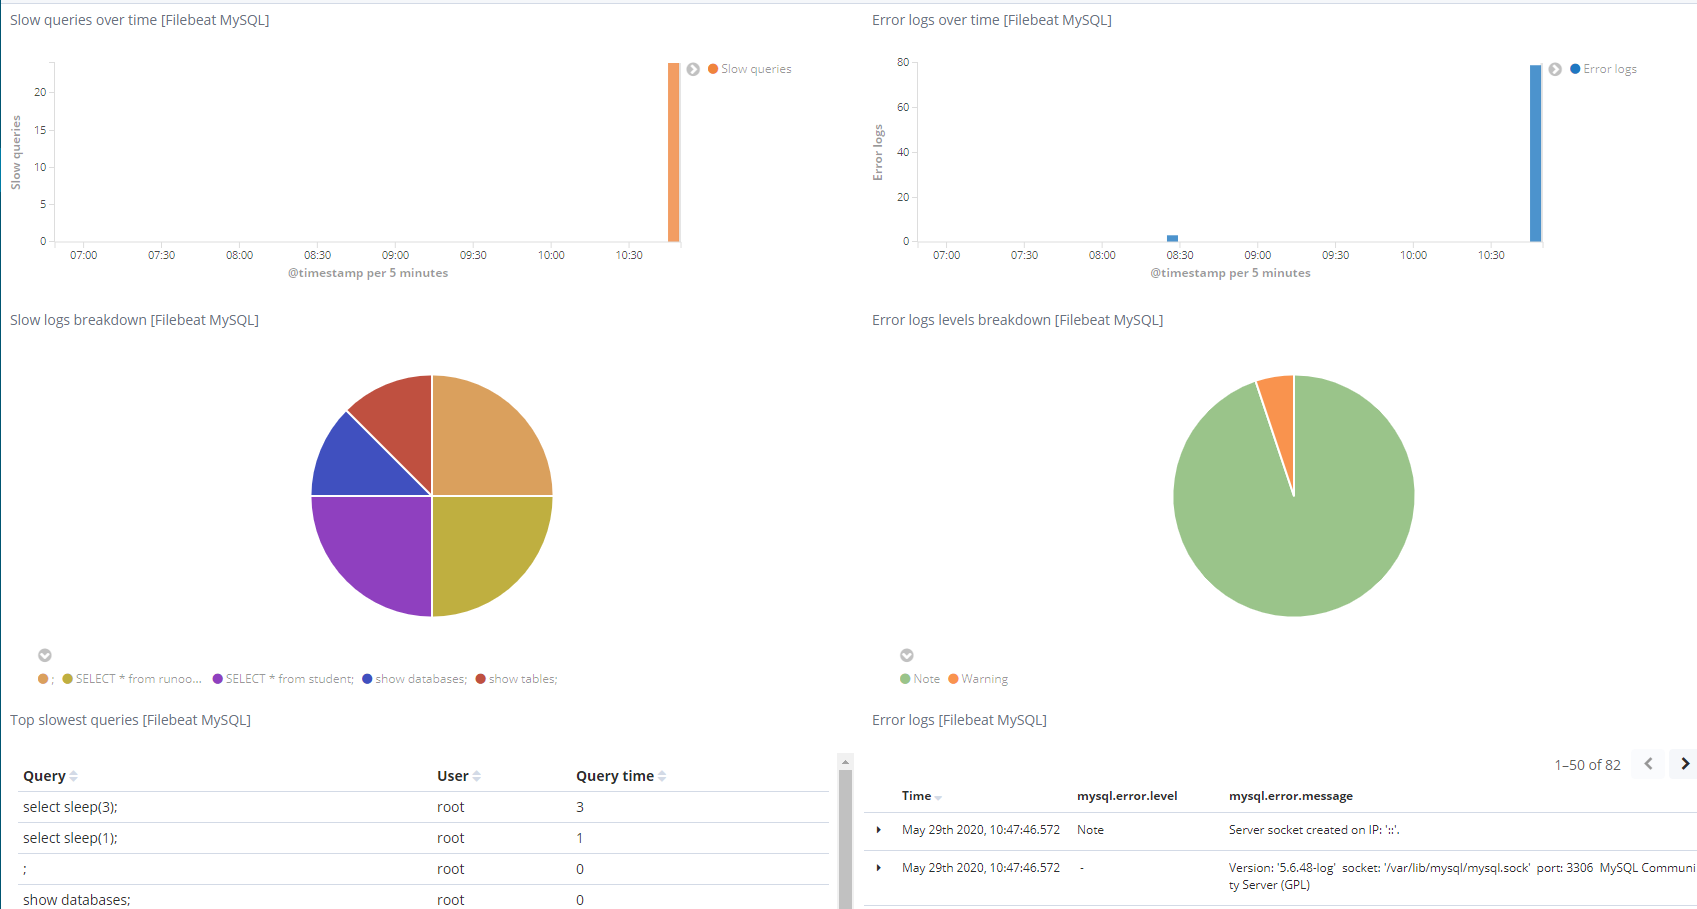
As shown in this tutorial, Filebeat is an excellent log shipping solution for MySQL databases and Elasticsearch clusters. Compared with previous versions, Filebeat 6.7.0 is very lightweight and can effectively ship log events. Filebeat supports compression and can be easily configured in a YAML file. Filebeat allows you to easily manage log files, track log registries, create custom word K segments to enable fine-grained filtering and discovery in logs, and use the Kibana visualization feature to provide immediate power for log data.
Declaration: This article is an authorized adaptation from Beats: How to Use Filebeat to Ship MySQL Logs to Elasticsearch based on Alibaba Cloud service environment.
Simplify Elasticsearch Data Analysis with Transforms Data Pivoting

2,593 posts | 793 followers
FollowData Geek - March 12, 2021
Data Geek - May 13, 2024
Alibaba Clouder - December 29, 2020
Alibaba Cloud Native Community - November 29, 2024
Alibaba Clouder - January 4, 2021
Alibaba Cloud Indonesia - August 1, 2023

2,593 posts | 793 followers
Follow Big Data Consulting for Data Technology Solution
Alibaba Cloud provides big data consulting services to help enterprises leverage advanced data technology.
Learn More Cloud Migration Solution
Secure and easy solutions for moving you workloads to the cloud
Learn More Big Data Consulting Services for Retail Solution
Alibaba Cloud experts provide retailers with a lightweight and customized big data consulting service to help you assess your big data maturity and plan your big data journey.
Learn More Alibaba Cloud Elasticsearch
Alibaba Cloud Elasticsearch helps users easy to build AI-powered search applications seamlessly integrated with large language models, and featuring for the enterprise: robust access control, security monitoring, and automatic updates.
Learn MoreMore Posts by Alibaba Clouder