By Bruce Wu
The advent of containers and serverless programming methods greatly increased the efficiency of software delivery and deployment. In the evolution of the architecture, you can see the following two changes:
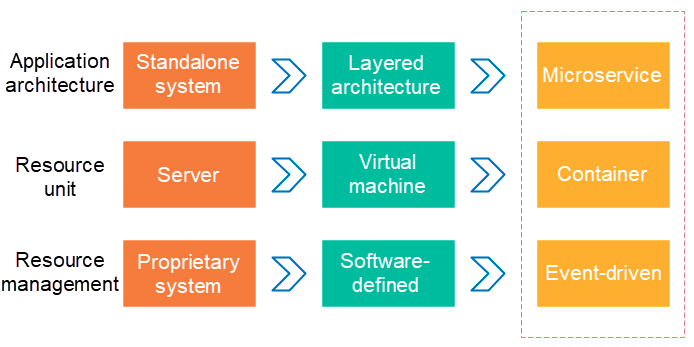
The preceding two changes show that behind the elastic and standardized architecture, the Operation & Maintenance (O&M) and diagnosis requirements are becoming more and more complex. To respond to these changes, a series of DevOps-oriented diagnostic and analysis systems have emerged, including the centralized log systems (logging), centralized measurement systems (metrics), and distributed tracing systems (tracing).
See the following characteristics of logging, metrics, and tracing:
Logging, metrics, and tracing have overlapping parts as follows.
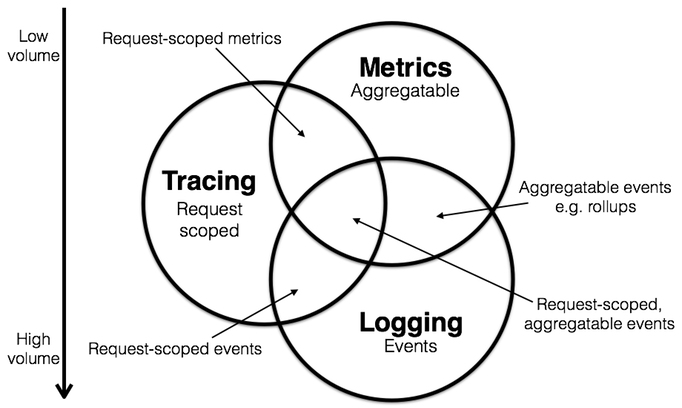
We can use this information to classify existing systems. For example, Zipkin focuses on tracing. Prometheus begins to focus on metrics and may integrate with more tracing functions over time, but has little interest in logging. Systems such as ELK and Alibaba Cloud Log Service begin to focus on logging, continuously integrate with features of other fields, and are moving toward the intersection of all three systems.
For more information, see The relationship among Metrics, tracing, and logging. Next, we will introduce tracing systems.
Tracing technology has existed since the 1990s. However, the article "Dapper, a Large-Scale Distributed Systems Tracing Infrastructure" by Google brings this field into the mainstream. The more detailed analysis of sampling is in the article "Uncertainty in Aggregate Estimates from Sampled Distributed Traces". After these articles were published, a lot of excellent tracing software programs were developed. Among them, the popular ones are as follows:
Distributed tracing systems have developed rapidly, with many variants. However, they generally have three steps: code tracking, data storage, and query display.
An example of a distributed call is given in the following figure. When the client initiates a request, it is first sent to the load balancer and then passes through the authentication service, billing service, and finally to the requested resources. Finally, the system returns a result.
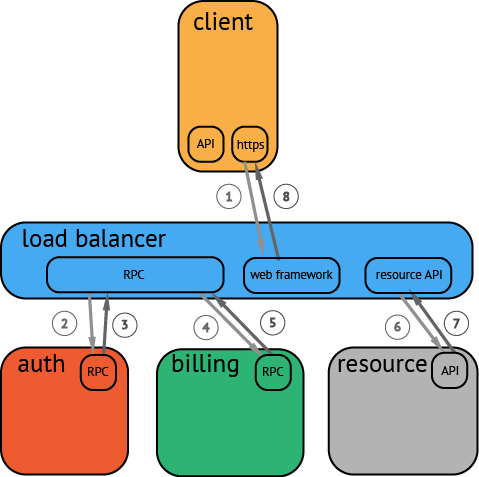
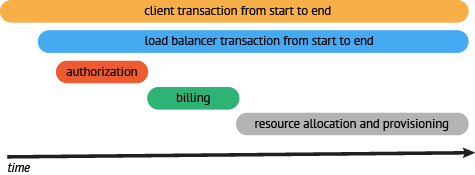
After the data is collected and stored, the distributed tracing system generally presents the traces as a timing diagram containing a timeline.
However, in the data collection process, generally you have to make great changes to switch the tracing system. This is because the system has to intrude on user code, and APIs of different systems are not compatible.
The OpenTracing specification is developed to address the problem of API incompatibility between different distributed tracing systems.
OpenTracing is a lightweight standardization layer. It is located between applications/class libraries and tracing or log analysis programs.
+-------------+  +---------+  +----------+  +------------+
| Application |  | Library |  |   OSS    |  |  RPC/IPC   |
|    Code     |  |  Code   |  | Services |  | Frameworks |
+-------------+  +---------+  +----------+  +------------+
       |              |             |             |
       |              |             |             |
       v              v             v             v
  +------------------------------------------------------+
  |                     OpenTracing                      |
  +------------------------------------------------------+
     |                |                |               |
     |                |                |               |
     v                v                v               v
+-----------+  +-------------+  +-------------+  +-----------+
|  Tracing  |  |   Logging   |  |   Metrics   |  |  Tracing  |
| System A  |  | Framework B |  | Framework C |  | System D  |
+-----------+ +-------------+ +-------------+ +-----------+In OpenTracing, a trace (call chain) is implicitly defined by the span in this call chain.
Specifically, a trace (call trace) can be considered as a directed acyclic graph (DAG) composed of multiple spans. The relationship between spans is called References.
For example, the following trace is composed of eight spans:
In a single trace, there are causal relationships between spans
        [Span A] ←←←(the root span)
            |
     +------+------+
     |             |
  [Span B] [Span C] ←←←(Span C is a child node of Span A, ChildOf)
     |             |
 [Span D]      +---+-------+
               |           |
           [Span E]    [Span F] >>> [Span G] >>> [Span H]
                                       ↑
                                       ↑
                                       ↑
                         (Span G is called after Span F, FollowsFrom)
Sometimes, as shown in the following example, a timing diagram based on a timeline can better display the trace (call chain):
The time relationship between spans in a single trace.
––|–––––––|–––––––|–––––––|–––––––|–––––––|–––––––|–––––––|–> time

 [Span A···················································]
   [Span B··············································]
      [Span D··········································]
    [Span C········································]
         [Span E·······]        [Span F··] [Span G··] [Span H··]
each span contains the following states:
Each log operation contains one key-value pair and one timestamp.
In a key-value pair, the key must be String type and the value can be any type.
However, you must note that not all supported OpenTracing tracers necessarily support all value types.
Each SpanContext contains the following statuses:
For more information about OpenTracing data models, see the OpenTracing semantic standards.
Supported tracer implementations lists all OpenTracing implementations. Among these implementations, Jaeger and Zipkin are the most popular ones.
Jaeger is an open-source distributed tracing system released by Uber. It is compatible with OpenTracing APIs.
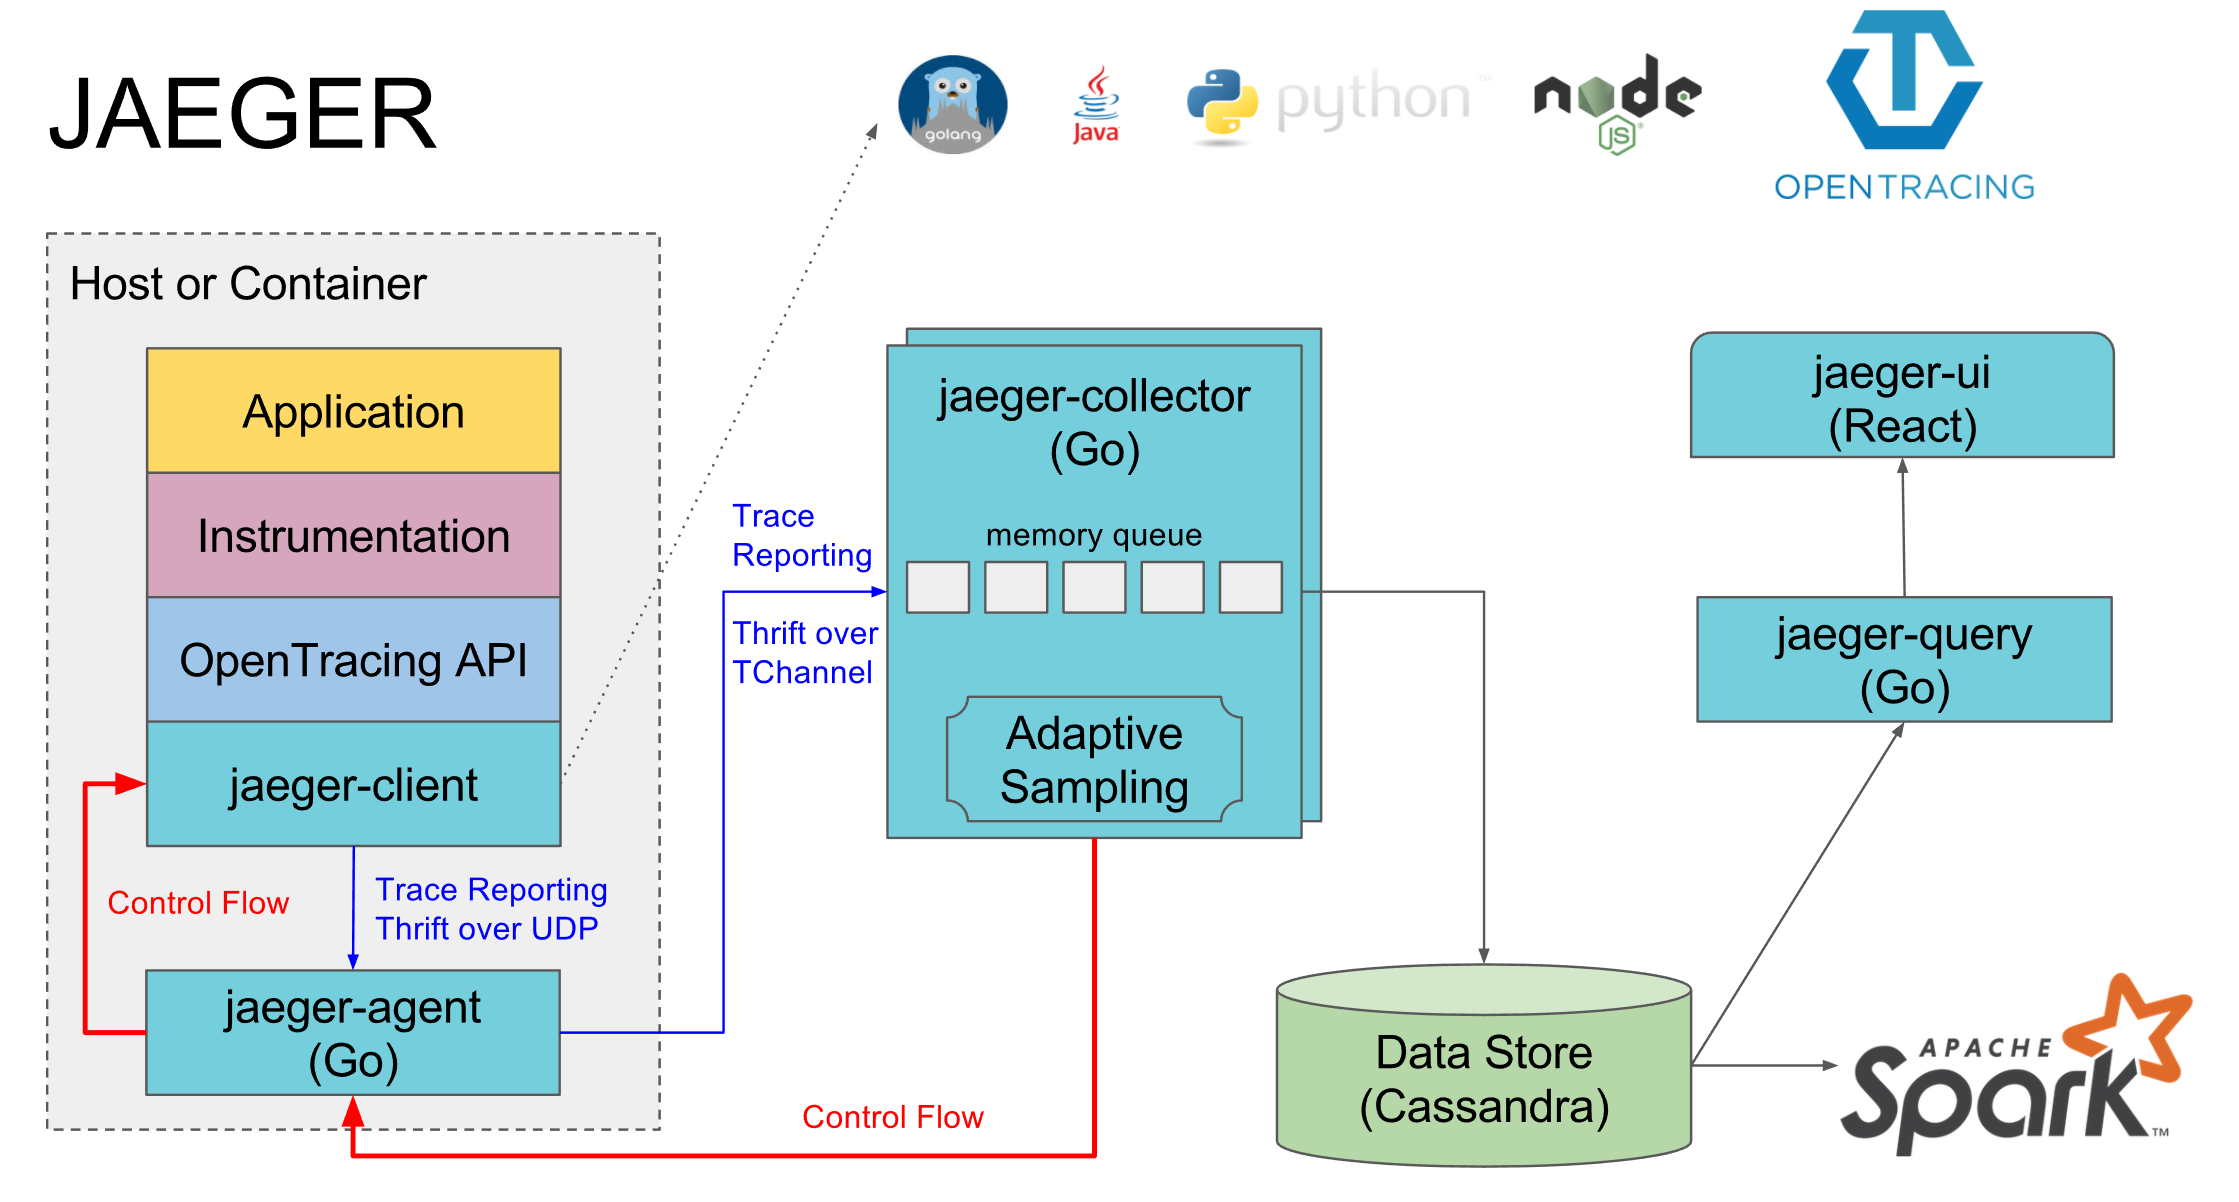
As shown in the preceding figure, Jaeger is composed of the following components.
Jaeger on Alibaba Cloud Log Service is a Jaeger-based distributed tracing system that persists tracing data to Alibaba Cloud Log Service. Data can be queried and displayed by using the native Jaeger interface.
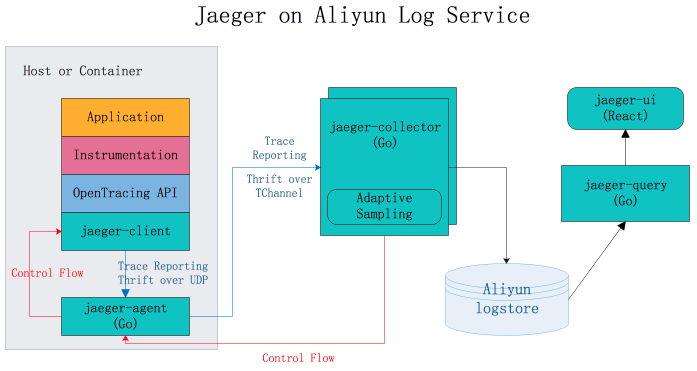
For more information, see https://github.com/aliyun/jaeger/blob/master/README_CN.md.
HotROD is an application composed of multiple microservices and uses the OpenTracing API to record trace information.
Follow these steps to use Jaeger on Alibaba Cloud Log Service to diagnose problems in HotROD. The example contains the following:
Count the average latency and request counts of frontend service HTTP GET/dispatch operations every minute.
process.serviceName: "frontend" and operationName: "HTTP GET /dispatch" |
select from_unixtime( __time__ - __time__ % 60) as time,
truncate(avg(duration)/1000/1000) as avg_duration_ms,
count(1) as count
group by __time__ - __time__ % 60 order by time desc limit 60
Compare the time consumed by the operations of two traces.
traceID: "trace1" or traceID: "trace2" |
select operationName,
(max(duration)-min(duration))/1000/1000 as duration_diff_ms
group by operationName
order by duration_diff_ms desc
Count the IP addresses of the traces whose latencies are more than 1.5 seconds.
process.serviceName: "frontend" and operationName: "HTTP GET /dispatch" and duration > 1500000000 |
select "process.tags.ip" as IP,
truncate(avg(duration)/1000/1000) as avg_duration_ms,
count(1) as count
group by "process.tags.ip"Jaeger on Alibaba Log Service was sorted out by Alibaba Cloud MVP @WPH95 during his spare time. Thank you for your outstanding contribution.
JProfiler Best Practices: Powerful Performance Diagnostic Tool

57 posts | 12 followers
FollowAlibaba Cloud Native Community - August 30, 2022
Xi Ning Wang - August 21, 2018
DavidZhang - January 15, 2021
Xi Ning Wang - August 30, 2018
DavidZhang - June 14, 2022
Alibaba Cloud Native Community - February 8, 2025

57 posts | 12 followers
Follow ACK One
Provides a control plane to allow users to manage Kubernetes clusters that run based on different infrastructure resources
Learn More Simple Log Service
An all-in-one service for log-type data
Learn More Hybrid Cloud Distributed Storage
Provides scalable, distributed, and high-performance block storage and object storage services in a software-defined manner.
Learn More Storage Capacity Unit
Plan and optimize your storage budget with flexible storage services
Learn MoreMore Posts by Alibaba Cloud Storage