By Huiling (Moxin Su)
To celebrate the 10th anniversary of Grafana, Grafana Labs has released Grafana 10, a significant version that focuses on improving the user experience and making it easier for developers to use. Grafana v10.0.x introduces impressive new features, including enhanced visualization and collaboration capabilities for developers and enterprises. Additionally, it includes the following updates:
• Update Panel
• Update Dashboard
• Update the navigation bar
• Update Grafana Altering
This article will only cover some of the features introduced in Grafana v10.0.x. For more detailed information, please refer to the Grafana documentation [1].
Now, let's explore the various new features and capabilities of Grafana 10.
Grafana v10.0.x introduces a new XY chart panel that supports line charts and scatter charts.
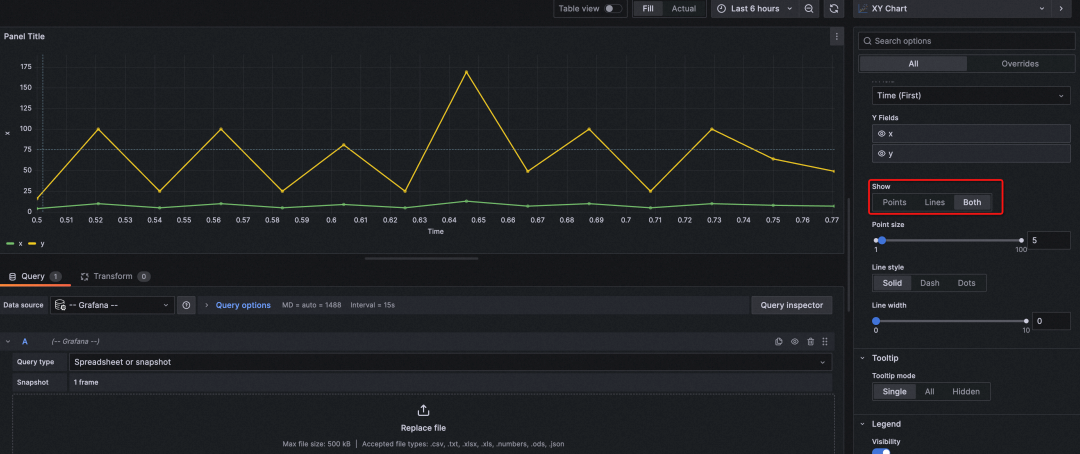
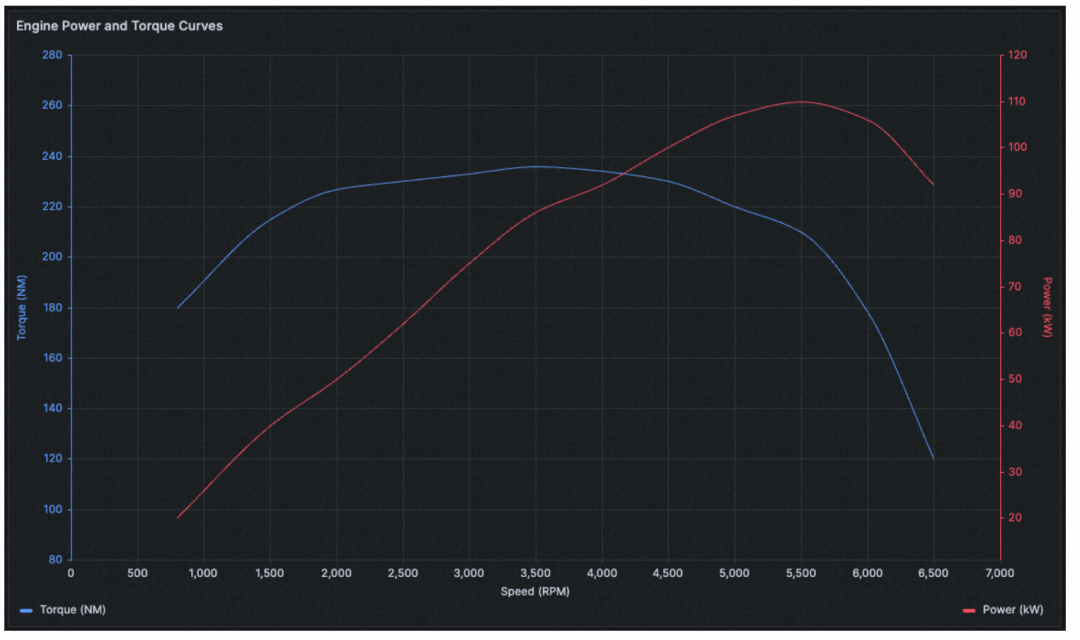
Grafana v10.0.x adds the XY trend chart feature. The trend chart allows you to display trends with the x-axis representing a value (x should be incremental) instead of time. This panel resolves issues that cannot be solved by either Time Series or XY Chart panels. For example, the XY Trend panel can be used to plot function graphs, rpm/torque curves, supply and demand relationships, and more.
Grafana v10.0.x introduces the DataGrid panel to support data editing within the Grafana dashboard for data customization. You can use this panel to fine-tune data retrieved from the data source or create new data.
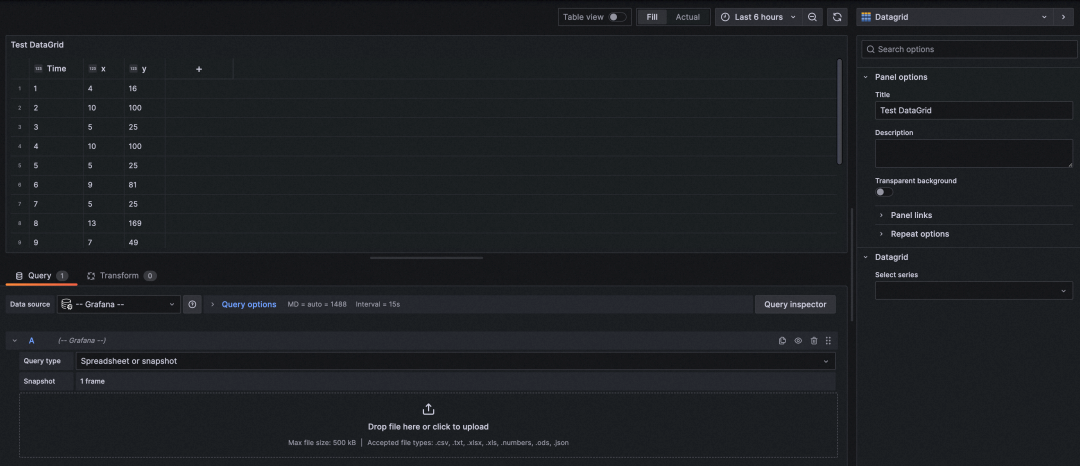

The modified data is saved as a snapshot and does not update over time.

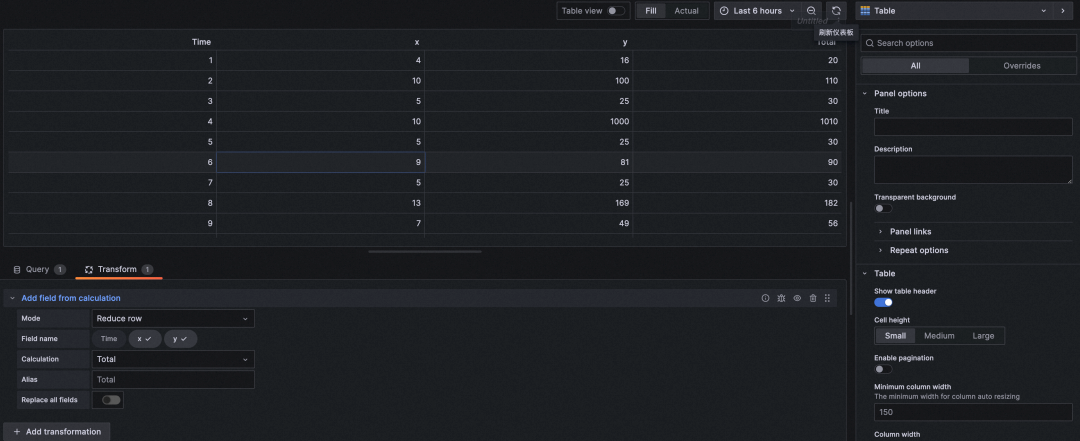
After saving the DataGrid, select the dashboard data source in the new panel. You can use the fine-tuned data as the data source and transform the DataGrid data.

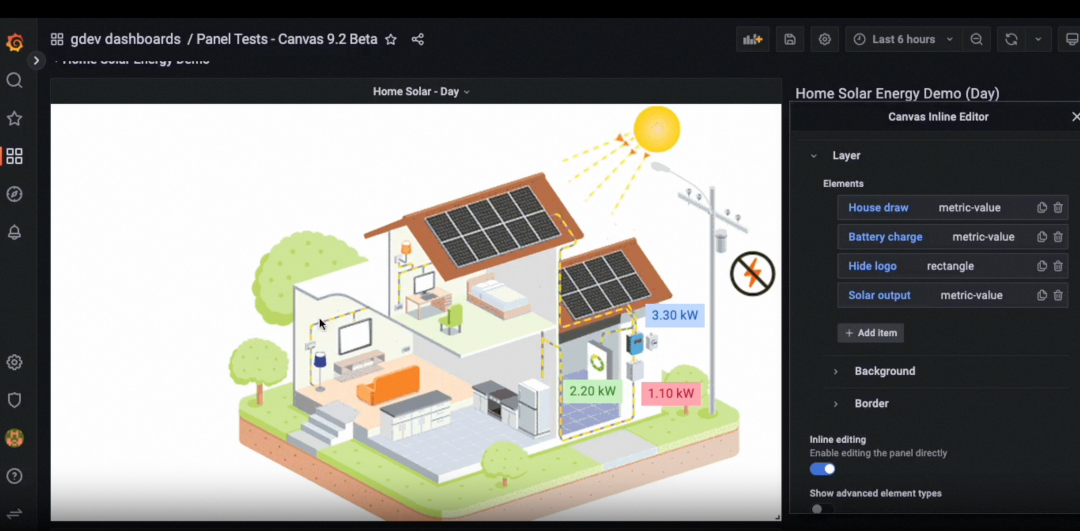
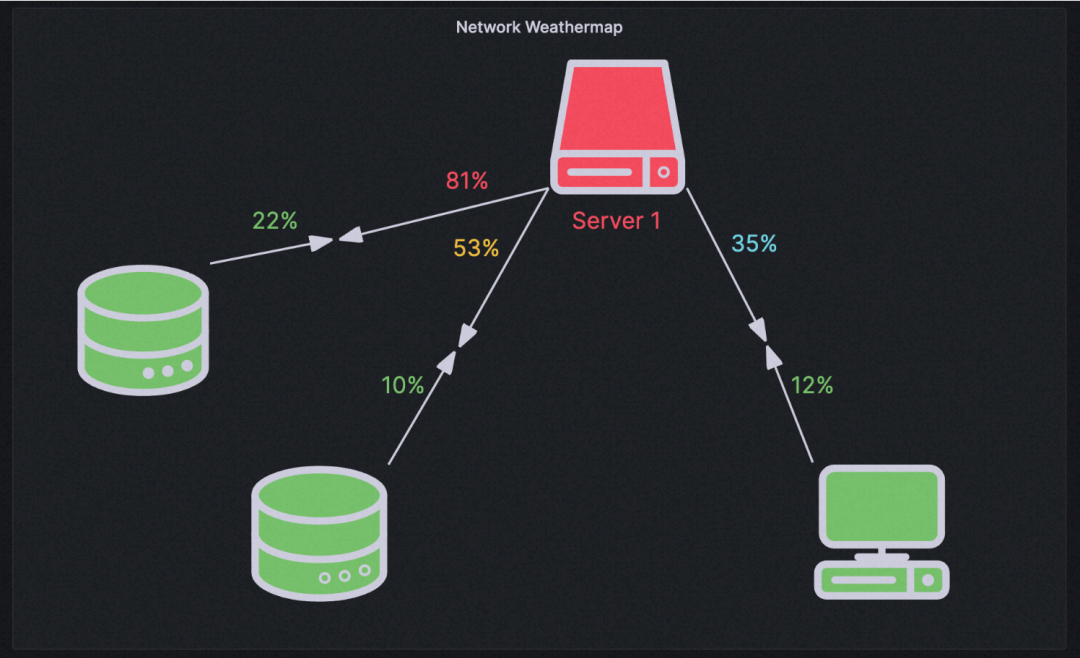
The Canvas panel is a new feature that combines the powerful capabilities of Grafana with the flexibility of custom elements. The Canvas visualization is an extensible panel that allows users to explicitly place elements in static and dynamic layouts, enabling the design of custom visualizations and overlaying data in ways not possible with the standard Grafana panel. For example, you can place an image layer, overlay text that is updated by a Grafana data source, and display an icon that can change color based on the data.
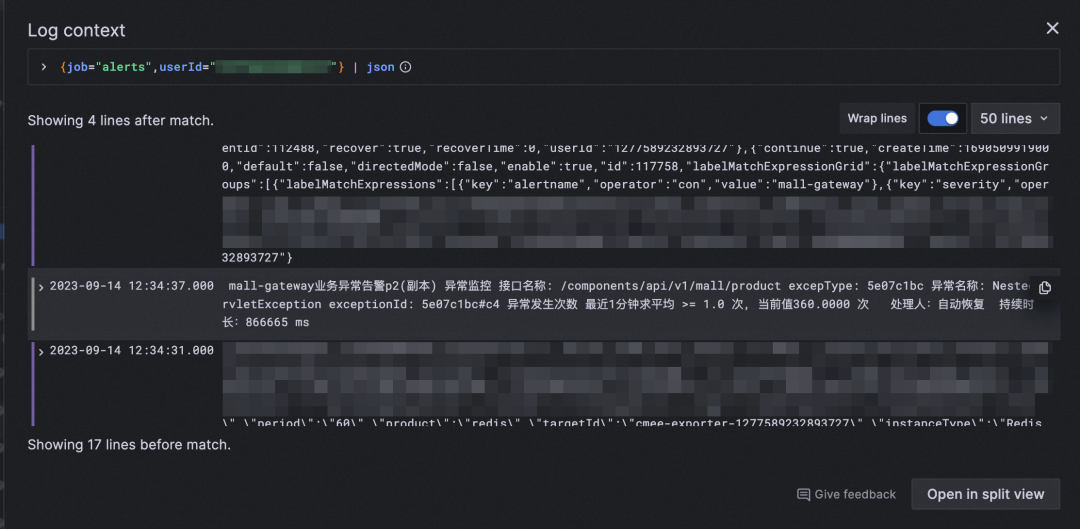
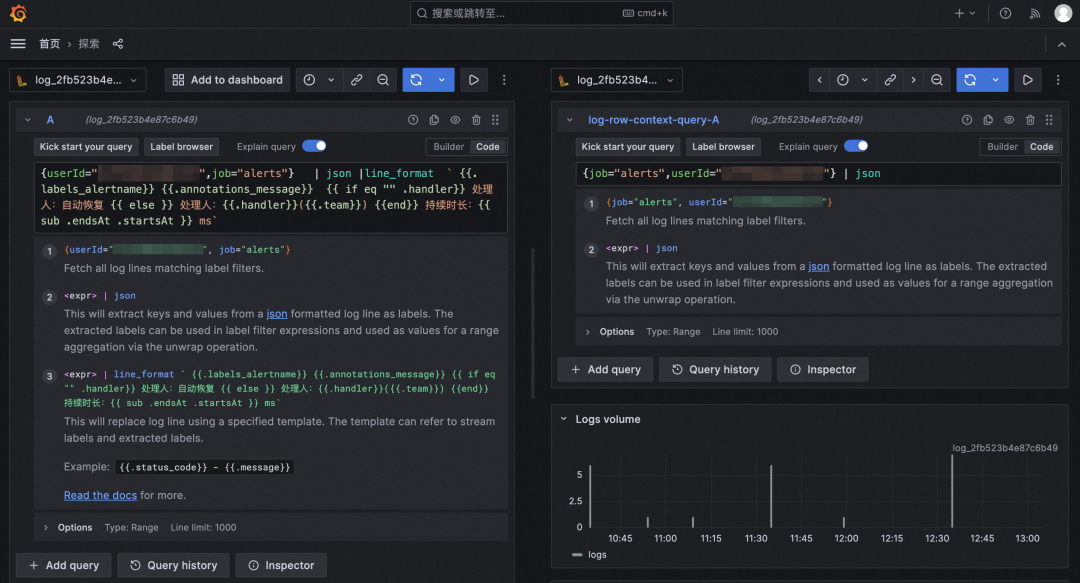
Grafana v10.0.x further optimizes the display of log types and introduces the following features and components:
• Operation record details, including a "copy" button to easily copy rows and an eye icon to display only selected labels, allowing you to focus on specific information without leaving the log context.
• The line feed switch allows long text to wrap, enabling you to read and analyze log entries directly in the log context.
• The Split View button enables contextual querying of log entries in Explore's split screen.
a) Supports direct copy of log content & long text expansion.

b) Expands the context of the selected log, allowing you to split the screen directly.
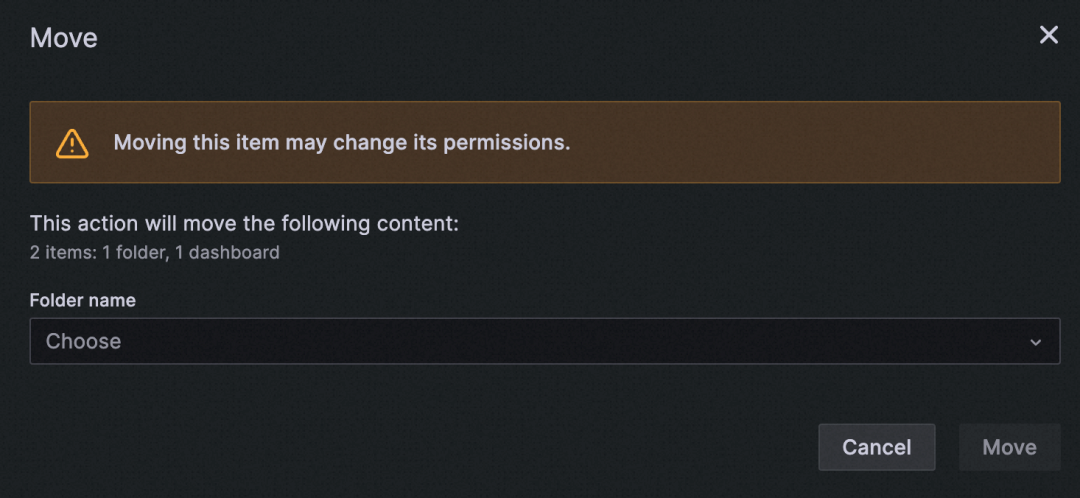
Grafana v10.0.x supports multi-level folders to manage a large number of dashboards in a more hierarchical manner.
Note: When a child folder is moved, it inherits the permissions of the new parent folder.

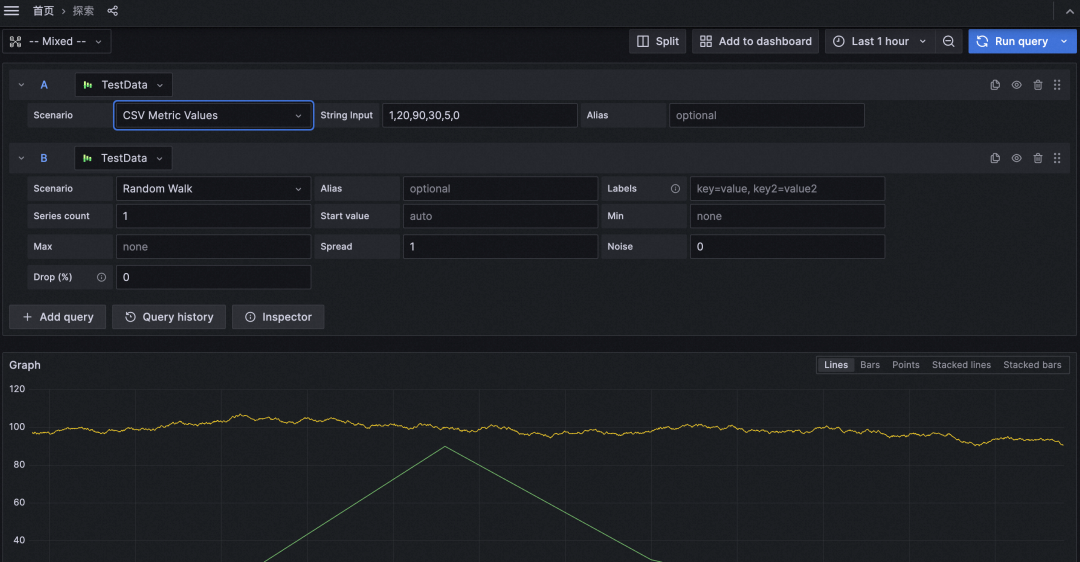
By selecting the Mixed data source in the Explore section of Grafana V10.0.x, you can define a data source for each query and display it in the same figure.
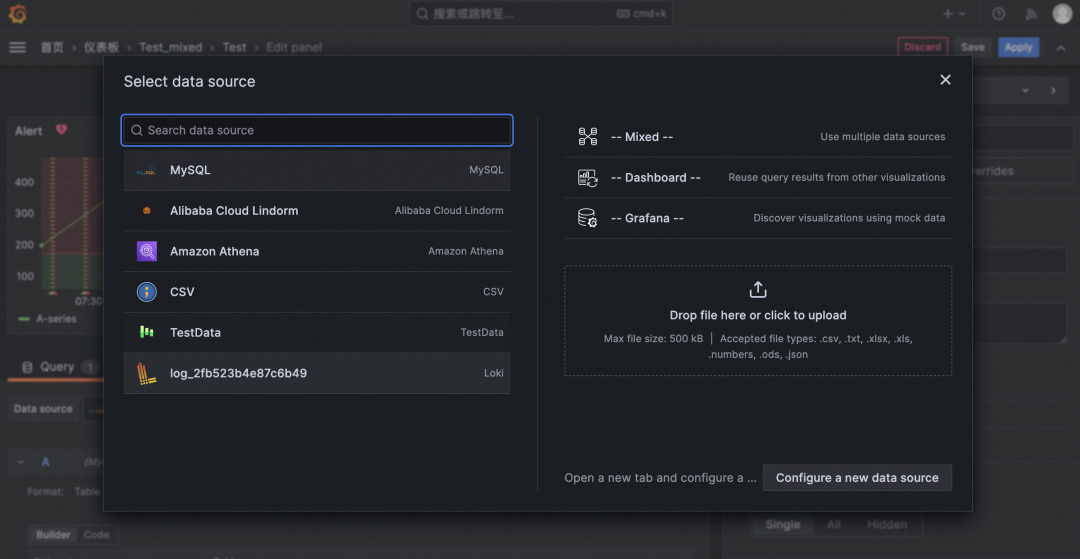
• When selecting a data source in Grafana v10.0.x, click open advanced datasource picker to expand the data source selection page. By doing so, the optional data sources can be displayed more clearly.
• When you edit or create a Grafana v10.0.x panel, you can upload a specific type of data source, such as .csv, .txt, .xlsx, and .json, by dragging or selecting it on the Data Source Selection page.
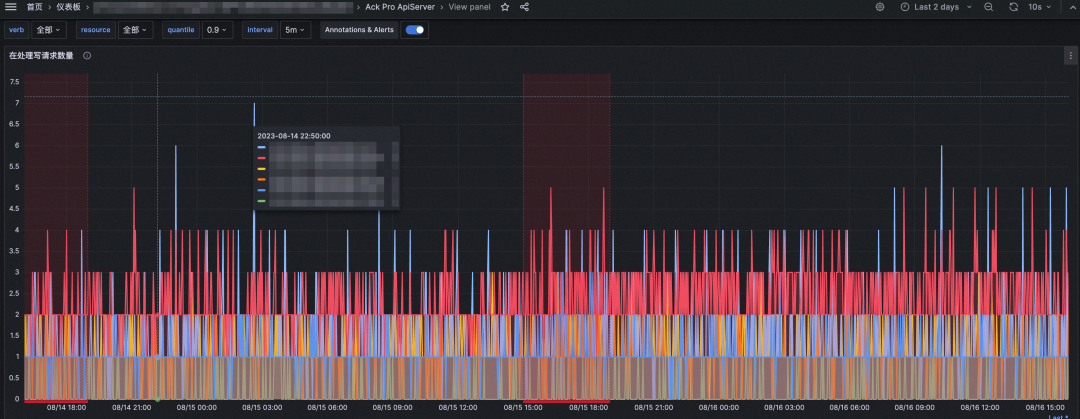
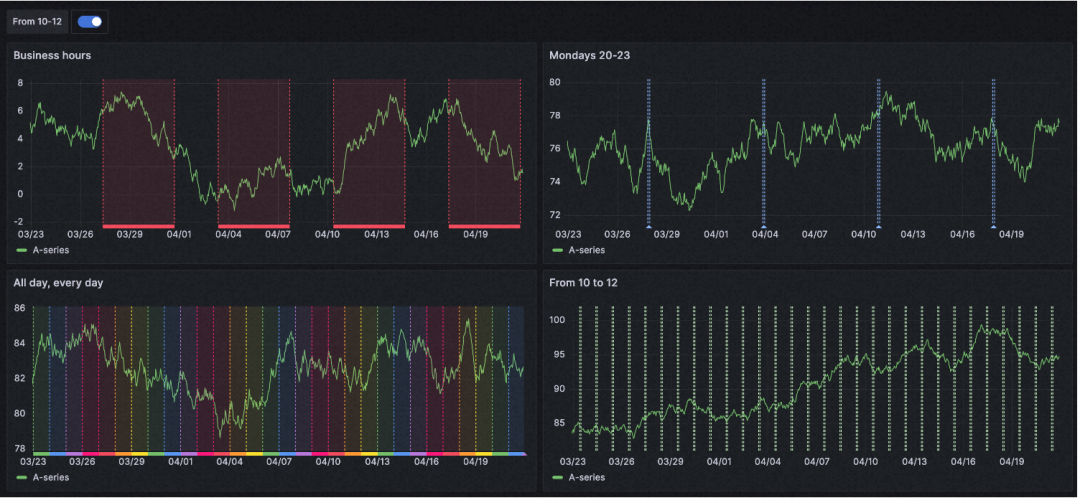
Grafana 10 supports marking time regions in the time series panel. Time regions provide a more contextual experience, with the ability to highlight certain days of the week, such as Monday to Friday, to show the work week next to the data. Time regions are also a useful way to highlight specific parts of a day, such as nighttime, work hours, or any time slots you want to define for each day. They allow you to quickly locate certain parts of a day or ignore highlighted parts of the time series.
Setting method: Create an annotation in the Annotations section of the dashboard and apply the annotation.
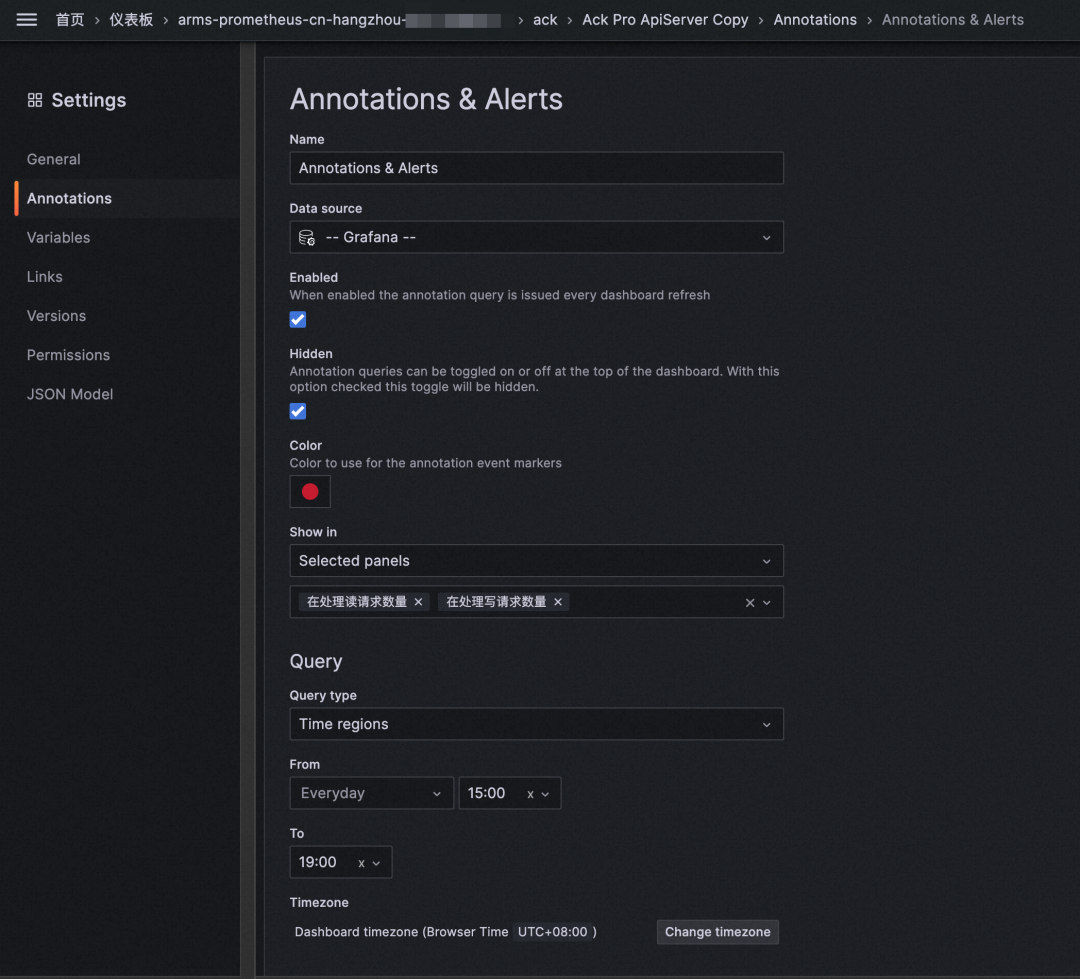
The above annotation means that the 15:00-19:00 time slot every day is specially marked:
You can define different time regions to display as needed:
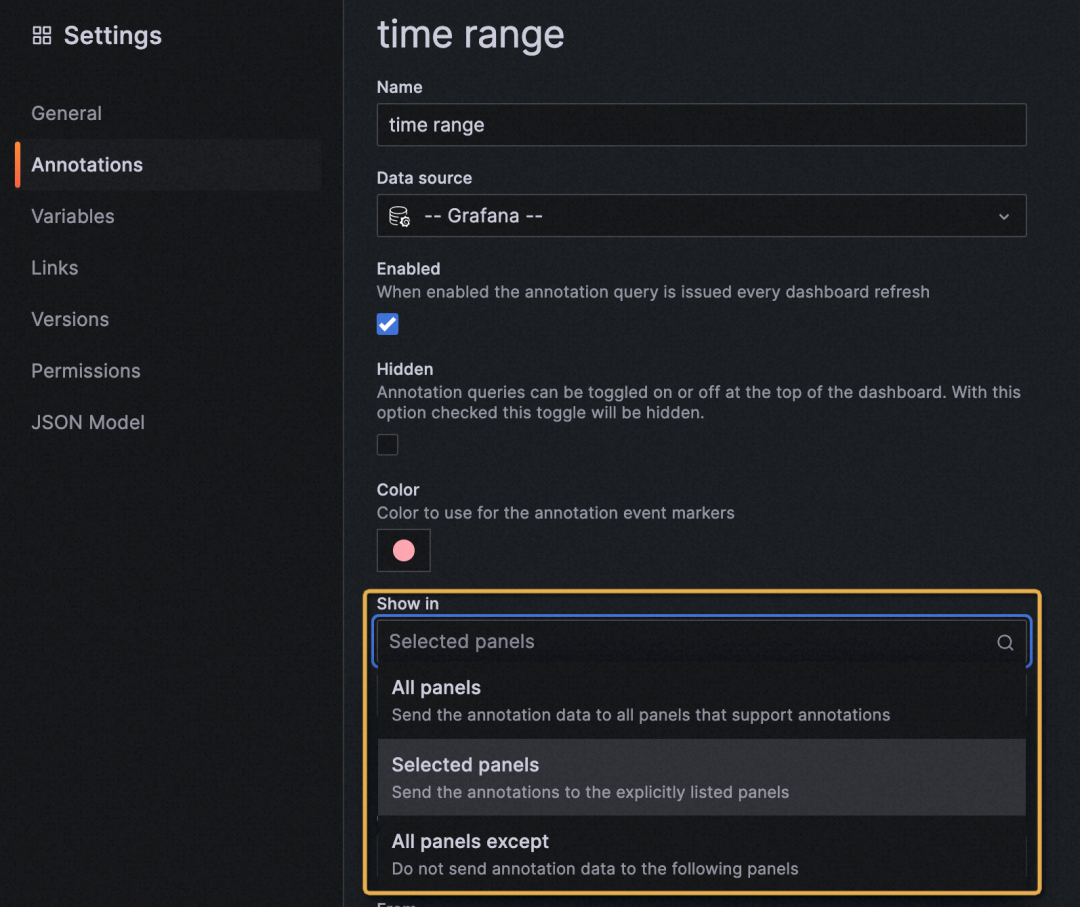
You can now filter dashboard annotations to apply annotations to all panels or selected panels, or use them to exclude selected panels.
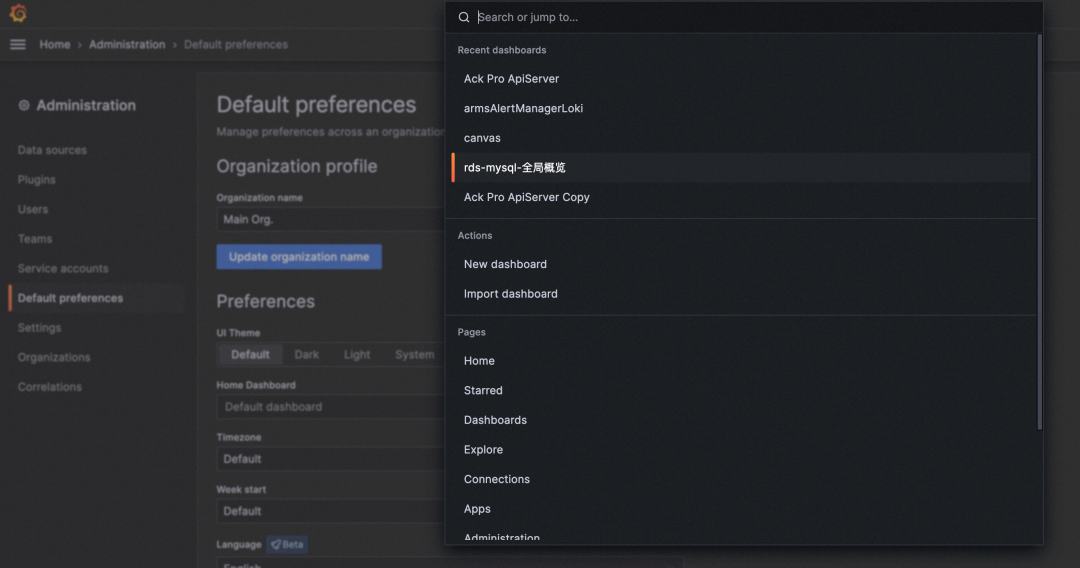
Grafana v10.0.x has a search bar added at the top of all pages, allowing direct search and access to all pages and recently used dashboards.
In Grafana v10.0.x, the left-side navigation menu includes the "Connections" section, which provides new paths for creating and editing data sources, making it easier to access data source-related tools.
The Add new connection section displays all data source plugins. Once installed, you can create a data source directly from the plugin page.
Data sources in Grafana 10 are consistent with data source management in Grafana 9.
Note: You need to log in as the admin user for the installation process.
Grafana 10 still supports the old data source installation path, but you will receive a notification or alert.

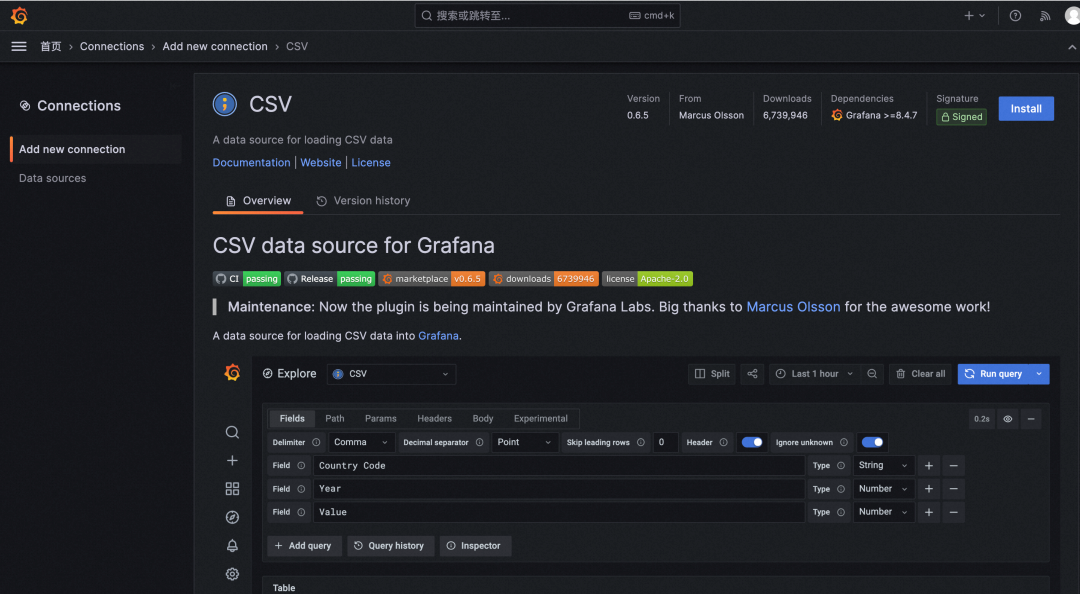
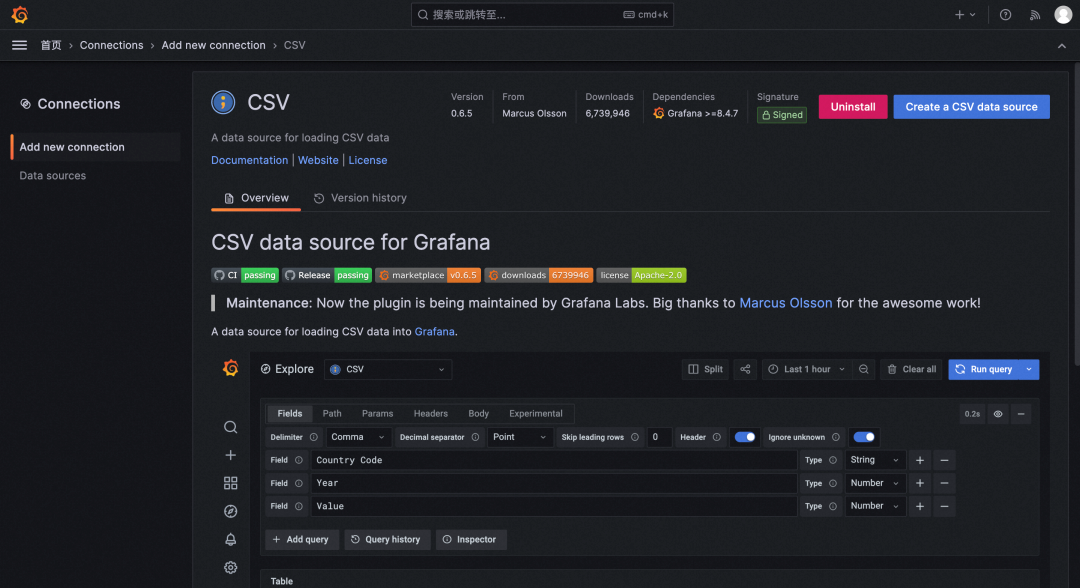
You can use the breakcrumb component to display the path of the current page and quickly return to any page on the previous path.

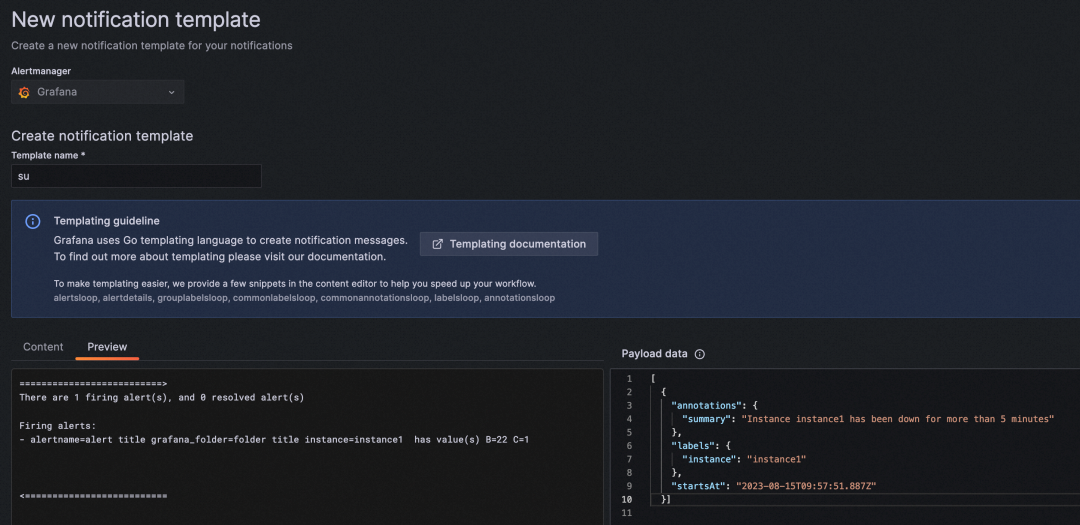
Grafana 10 allows you to preview the alert content after you define alert notification templates.
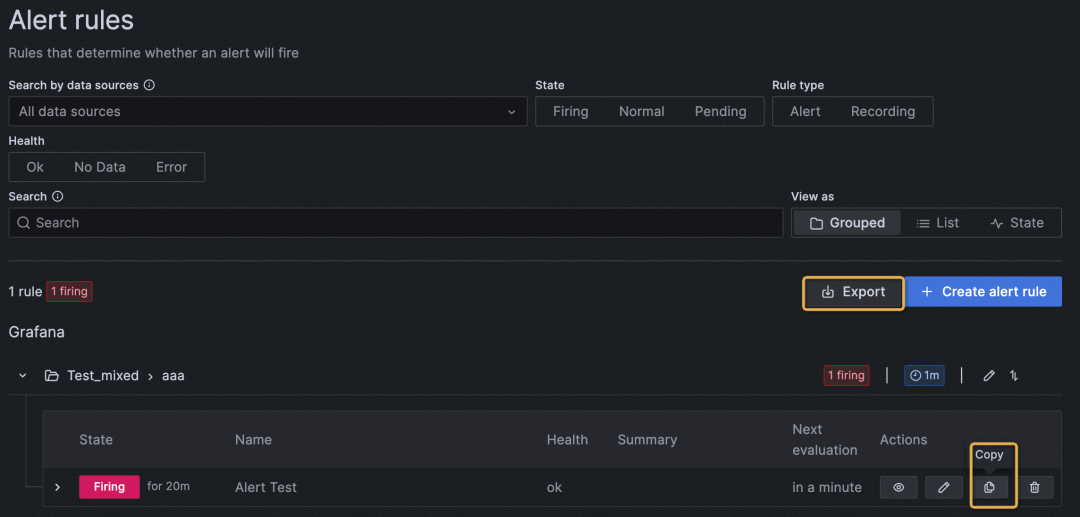
New alert rules can be created by copying, which can be created more conveniently when multiple similar rules are needed.
You can click the Export button to export all alert rules.
[1] The Grafana documentation
https://grafana.com/docs/grafana/latest/whatsnew/whats-new-in-v10-0/
The First Node.js 3.0-Alpha Version of Apache Dubbo Is Officially Released
Building Microservices Applications Based on Static Compilation

640 posts | 55 followers
FollowAlibaba Cloud Native Community - April 19, 2023
Alibaba Container Service - December 4, 2024
Alibaba Cloud Native - August 20, 2024
Alibaba Cloud Native Community - July 22, 2022
Alibaba Clouder - January 19, 2021
Alibaba Developer - April 7, 2020

640 posts | 55 followers
Follow Managed Service for Grafana
Managed Service for Grafana displays a large amount of data in real time to provide an overview of business and O&M monitoring.
Learn More Bastionhost
A unified, efficient, and secure platform that provides cloud-based O&M, access control, and operation audit.
Learn More Managed Service for OpenTelemetry
Allows developers to quickly identify root causes and analyze performance bottlenecks for distributed applications.
Learn More Managed Service for Prometheus
Multi-source metrics are aggregated to monitor the status of your business and services in real time.
Learn MoreMore Posts by Alibaba Cloud Native Community