This blog covers basics about performance testing and why it is so important to the design and development of a large-scale website system.
The bucket principle, also known as the short board theory, describes the core idea that the amount of water a bucket can hold does not depend on the highest board, but on the shortest piece of board.
When the bucket principle is applied to system analysis, it means that the final performance of a system depends on the worst-performing components in the system. To improve the overall system performance, the worst performing parts need to be optimized to achieve the best results.

In the website system, when a user's access request reaches the server, the data is returned and displayed back to the user. This requires a lot of processing. Inefficiency in any process will affect the overall system performance.
According to the bucket principle, if the performance of a server is very powerful with sufficient memory and Central Processing Unit (CPU) resources, but has insufficient disk Input/Output (I/O), then the overall performance of a system is determined by the current slowest disk I/O speed instead of the current most superior CPU or memory. This means disk I/O is the performance bottleneck of the system.
One of the common examples is systems using Redis for storage. Redis has excellent performance and, often, the storage does not restrict system performance. However, with large requests, Redis' throughput is vast, and the network bandwidth becomes a bottleneck in the system.
Performance testing is important in the design and development of a large-scale website system. It is usually combined with capacity estimation and other tasks and interspersed with different plans in system development.
Performance testing can help us discover the system performance short board, evaluate the system's capability, and carry out targeted optimization. Meanwhile, stress testing can also help verify the stability and reliability of the system.
A performance test plan usually includes the following components:
1. Stress Testing and Performance Report Generation
One focus of stress testing is how to generate stress. This can be achieved by writing scripts to simulate requests or by using sophisticated stress tools. In stress testing, it is important to use realistic data that is as close to real-world users as possible.
2. Identifying System Bottleneck
The stress test report usually shows data like query per second (QPS), transactions per second (TPS), response delay, etc. This data allows us to understand the server's performance and to identify existing problems, but it cannot help us pinpoint the problem.
This is when we need to look into the various system components, compare the impact of CPU, memory, I/O and network on the overall performance, determine which part affects system performance, and conduct optimization individually.
3. Estimating Load-carrying Capacity
One principal purpose of stress testing is to get the most out of the existing server resources. The early testing and analysis have provided us with an understanding of the system's overall performance and an estimation of the system's load-carrying capacity.
It is now time to configure the number of servers and CDN resources, depending on the business scale so that we can get the greatest value out of the fewest resources.
One focus of stress testing is how to generate stress. Choosing test tools is an important task. Large internet companies such as Google, Alibaba and Baidu all have specialized test development teams that are responsible for developing testing tools to better cater to the enterprise's business. As an important part of the software as a service (SaaS), several cloud service providers have also offered stress testing and performance monitoring services.
Most companies will still choose to do their testing. Some of the standard stress testing tools are listed as follows:
a) Apache JMeter: Apache JMeter is a Java-based stress testing tool for software developed by Apache. Though originally designed for web application testing, it is extended to other testing areas as well. Apache JMeter can be used to test static and dynamic resources such as static files, Java servlets, Common Gateway Interface (CGI) scripts, Java objects, databases, and File Transfer Protocol (FTP) servers. JMeter can be used to simulate huge loads on servers, networks, or objects to test their strength and analyze overall performance under different stress types.
Also, JMeter can perform functional regression testing on applications by creating scripts with assertions to verify whether your program has returned the expected results. For maximum flexibility, JMeter allows the use of regular expressions to create assertions.
b) LoadRunner: LoadRunner is a Hewlett Packard Enterprise (HPE)-owned automated load testing tool that predicts system behavior and optimizes performance. LoadRunner emphasizes the entire enterprise system. It can help identify and find problems faster by simulating real-world user behavior and conducting real-time performance monitoring. Also, LoadRunner can support the widest range of protocols and technologies and provide tailored solutions.
c) Other Test Tools
i. Siege: Siege is an open-source stress testing tool. Based on configuration, it can perform multi-user concurrent access to a website, record the corresponding time of each user's entire request and repeat the tests under a certain number of concurrent accesses.
ii. TCPCopy: TCPCopy is a request replication (all TCP-based packets) tool that can import online requests into the test system. The essential characteristic of TCPCopy is the ability to copy online real-time traffic and simulate user data.
The following table outlines the comparison of the mainstream tools JMeter and LoadRunner. Except for the companies that use self-developed testing tools, most internet companies use JMeter as a testing tool.
| JMeter | LoadRunner | |
| Development Language | Java | C language |
| Applications Supported | Better support for Java-based systems | Comprehensive support |
| Fees | Open-source, free | Business software |
| Learning Costs | Simple and easy to use, Java custom testing plan | Complicated functions, high learning costs |
| Supported Protocols | Common protocols such as HTTP/FTP/SMP | Comprehensive support |
| Custom Testing | Support the use of Java to write samples | Use all-round components for custom testing |
| Component Functions | Thread Group, Samplers, Listeners, Pre & Post processors | A complete set of test components, such as VU generator, controller, analyzer, load generator, load calculator and protocol advisor. |
Stress testing can expose system performance issues, such as slow access under a high concurrency and service downtime. However, we cannot identify the specific bottleneck through stress testing. We need to combine stress testing with the appropriate resource monitoring to locate the problem.
a) Monitor Systems Performance Using nmon: the nmon is a monitoring and analysis tool widely used on Linux. Compared with other system resource monitoring tools, nmon records comprehensive information. It can capture the real-time usage of system resources when the system is running, then output the results to the file and generate data files and graphical results through the nmon_analyzer tool.
Data recorded by nmon includes the following:
● CPU usage
● Memory usage
● Disk I/O speed, transfer and read/write ratios
● File system usage
● Network I/O speed, transfer and read/write ratios, error statistics, and transfer packet size
● The most resource-consuming processes
● Detailed information and resources about the computer
● Page space and page I/O speed
● User-defined disk groups
● Network file system
b) Use rpc.rstatd to Monitor System Performance: the rpc.rstatd is usually used in conjunction with LoadRunner. Do not confuse it with rpc.statd, which is a daemon service. The rstatd daemon obtains information about system performance statistics from the system kernel and returns the results to the calling program. During stress testing, the LoadRunner client sends requests to the rstatd daemon on the server to collect performance data of applications or database servers.
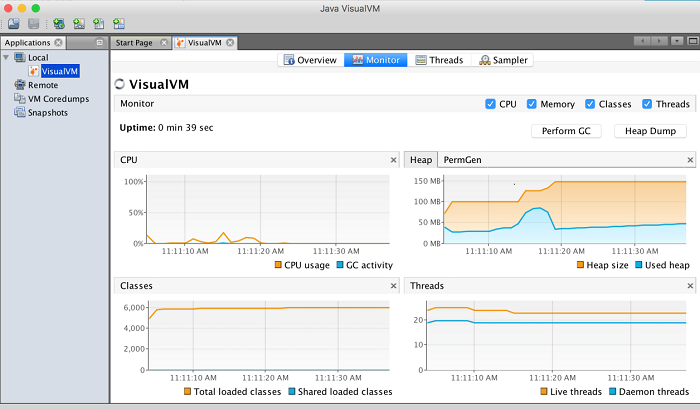
c) Configure Resource Monitoring Plan Based on Different Services: take Java service for example. During stress testing, performance monitoring of Java Virtual Machine (JVM) can be conducted simultaneously. Standard tools include Jvisualvm, jps, and jstack. Below is the application interface of Jvisualvm. The local and remote JVM instance running states can be monitored.

After stress testing identifies problems, it is necessary to carry out targeted optimization. Different systems follow different strategies, but they are categorized into the steps below.
Different systems have different characteristics and performance bottlenecks. In general, there is usually room for optimization in the following aspects:
a) Disk I/O and File Operations: Disk I/O reads and writes much slower than memory does. When the program is running, the slow I/O operation will affect the entire system as the program needs to wait for disk I/O operations to complete.
b) Network Operations: The read and write operations of network data are similar as that of disk I/O. Due to the uncertainties of network environment, the network operations, especially reads and writes on network data, can be even slower than that of local disk I/O.
c) CPU: Competition for CPUs among applications that require high computational resources could cause performance problems due to their long and uninterrupted use of CPU resources. Such applications include scientific computing, 3D rendering, and others.
d) Context Switches and Lock Contention under a High Concurrency: Lack of proper optimization will lead to a lot of lock contentions for high-concurrency programs. The fierce lock contention will sharply increase the overhead of thread context switches, thus posing a significant impact on the performance.
e) Database: Most applications cannot go without databases, and large amounts of data read and writes can be time-consuming. The application may need to wait for the database operation to complete or return the requested result set. The slow synchronization process will become the bottleneck of the system.
After identification of the system performance problems, it is necessary to come up with solutions for it.
Typical issues affecting performance include:
a) Underperforming response for high-concurrency scenarios, such as low database connection pool, over-the-limit server connections, and under-established database lock control.
b) Memory leak, such as memory not being released regularly when the system runs for a long time and the occurrence of downtime.
c) Lack of database optimization, such as too many associated tables due to business growth and insufficient optimization of SQL.
After the problems are identified, the next step is to make reasonable adjustments.
● To solve limited server resources, we can configure more machines and upload services to the cloud
● To address lack of support for a high concurrency, we can optimize the code to improve concurrency support
● To solve database performance issues, such as slow queries and other problems, we can optimize SQL statements.
The above analysis provides a preliminary performance optimization plan. The next step is to make targeted improvements.
This process can be iterated referring to the agile idea. We can conduct small-range tests of the system after the development to compare the optimization results.
It is best to compare the results before and after optimization and to display the results with graphics. Benchmarking refers to the design of scientific testing tools and methods to conduct quantitative and comparable tests on a certain performance index of a category of test objects. Comparing test results, combined with capacity estimation, will enable the system to maximize its effectiveness.
After the optimization is completed, it is a good idea to review and summarize the results. For example, has the optimization achieved its goal? Has the overall system performance been improved? Has the user experience been enhanced? What improvements need to occur in the next development?
JMeter is a favorite test tool. The following is a brief introduction of its related functions.
JMeter can be directly downloaded and installed on Linux. On a MAC system, go to http://jmeter.apache.org/download_jmeter.cgi to download apache-jmeter-3.1.tgz.
After downloading, extract the file, get the installation package, enter the extract directory /bin/, click on the jmeter image, and start JMeter.
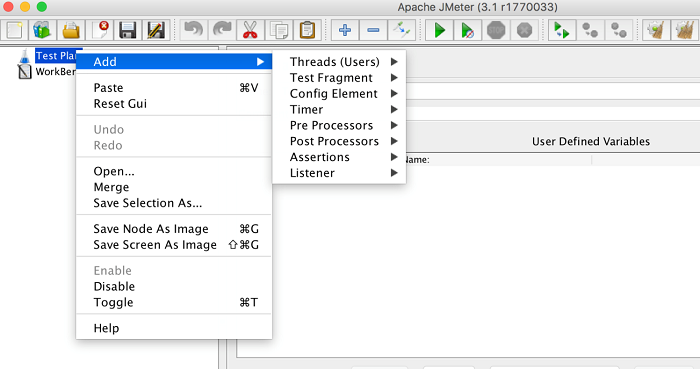
Familiarity with some basic concepts is required to use JMeter. Below is the interface for editing the test plan:

a) Threads: Threads are used to control the number of concurrent threads in Jmeter. There is only one component (thread group) in its next-level menu. Each thread is a virtual user. All other types of components must be the children of the (thread group) node.
b) Config Element: Config Element works with the Sample components and is used to configure the Sample to initiate requests to access the server. Its main feature is that it can put several standard sample configurations in a single element to facilitate management. The Config Element has a scope that works in a similar way as a tree - the higher the node, the larger the scope and vice versa, and the lower-level node can copy the configuration of the higher level's scope.
c) Timer: Timer is used to adjust (thread group) and control the time interval of the test logic (e.g., initiate request) run by the thread. There are many types of timers under it. Their primary function is to adjust the time interval, but various components have quite different strategies.
d) Pre-Processors/Post Processors: Similar to a hook, the processors are in charge of implementing the script logic before and after the test. This is its core functionality. They are not key components.
e) Assert: Assert means to determine whether the return results meet the expectations after the Sample has sent the request.
f) Listener: Listener is different from the listener used in web programming. It captures data during the operation of a JMeter test. It uses the Aggregate Report component, which can provide key test data such as TPS and response time.
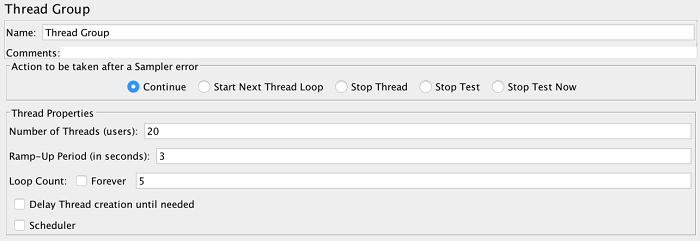
a) Set the ThreadGroup Parameters: First, add a ThreadGroup component under TestPlan and set the ThreadGroup properties.

Number of Threads: The maximum number of threads used for testing.
Ramp-Up Period: The time Jmeter takes to reach the specified maximum number of threads.
Loop Count: Forever means the threads in the thread group will continuously test the system. If set to a certain number, the thread will automatically exit the thread group after completing the specified number of tests.
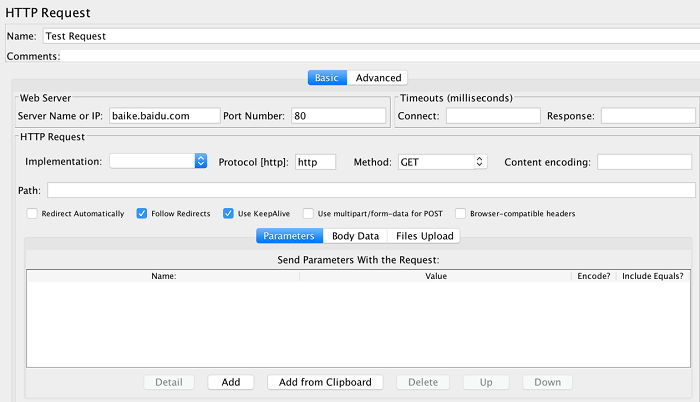
b) Add Sampler information: After saving the Thread Group, add the Sample component under the Thread Group. We add an HTTP Request component and its property settings are as follows:

Sampler means a particular format or specification of a request sent from the client to the server. There are all kinds of Samplers, such as FTP/JDBC.
Here, an access request to the home page of Baidu Baike is added, with port number 80 following the HTTP protocol.
c) Add Listener Component of Aggregate Report: Add a listener component of Aggregate Report. Aggregate Report is a common Listener in JMeter. Its Chinese translation is “聚合报告.”
d) Start Test: Select RUN to start the test and then view the Aggregate Report for this test.

There is a lot of information in the above aggregation report. Below is a brief introduction of several important indicators.
| Label | Each JMeter element (such as HTTP Request) has a Name property. The label shows the value of the Name property. |
| #Samples | Shows the number of requests sent during the test. If there are 10 users and each has 10 iterations, it will display 100. |
| Average | Average response time - By default, this is the average response time for a single request. If Transaction Controller is used, this can also mean the average response time with transaction as a unit. |
| Median | Median means the response time for 50% of the users. |
| 90% Line | The response time for 90% of the users. Other similar indicators follow the same rule. |
| Min | The minimum response time. |
| Max | The maximum response time. |
| Error% | The number of requests with error information/the total number of requests. |
| Throughput | By default, the number of requests completed per second (Request per Second). |
| Received/Sent KB/Sec | The amount of data received from /sent to the server per second. |
There you have it. This blog was a quick, well not so quick, introduction of the basics of performance and stress testing. Try out some of the tools and techniques next time you are developing and designing new modules for your apps and websites.
References:
https://github.com/session-replay-tools/tcpcopy
https://github.com/JoeDog/siege
https://en.wikipedia.org/wiki/HP_LoadRunner
Matchmaking System Design – Answering Frequently Asked Questions
Rest Assured - Ways to Avoid Security Issues When Using RESTful

2,593 posts | 793 followers
FollowAlibaba Developer - June 18, 2021
Alibaba Clouder - January 5, 2021
Alibaba Cloud Native - April 16, 2024
Xi Ning Wang(王夕宁) - May 26, 2023
Alibaba Clouder - December 21, 2020
Alibaba Cloud Native Community - September 18, 2023

2,593 posts | 793 followers
Follow Mobile Testing
Provides comprehensive quality assurance for the release of your apps.
Learn More Penetration Test
Penetration Test is a service that simulates full-scale, in-depth attacks to test your system security.
Learn More Elastic High Performance Computing
A HPCaaS cloud platform providing an all-in-one high-performance public computing service
Learn More Remote Rendering Solution
Connect your on-premises render farm to the cloud with Alibaba Cloud Elastic High Performance Computing (E-HPC) power and continue business success in a post-pandemic world
Learn MoreMore Posts by Alibaba Clouder
Raja_KT February 15, 2019 at 6:15 am
Good one. My experience with Testing tools are that they are useful in many cases and on many cases are extra burdens :). I did write many test cases manually.