By Hitesh Jethva, Alibaba Cloud Community Blog author.
Sysdig is a free and open source activity monitoring tool that can be used to capture and analyze application logs. It is a powerful and flexible system monitoring and troubleshooting tool for Linux based operating systems. Sysdig allows you to capture, save, filter and examine the real time events of Linux systems.
In this tutorial, we will learn how to install and configure Sysdig on an Alibaba Cloud Elastic Compute Service (ECS) Ubuntu 18.04 server.
Create a new ECS instance and connect to your instance as the root user.
Once you are logged into your Ubuntu 18.04 instance, run the following command to update your base system with the latest available packages.
apt-get update -yBy default, Sysdig is available in the Ubuntu 18.04 default repository. You can install it by just running the following command:
apt-get install sysdig -yOnce the installation has been completed, you can see more information about the Sysdig with the following command:
sysdig --helpThe simple and easiest method to use sysdig is by running it without any argument. This will show your Linux system stream of events updated in real-time:
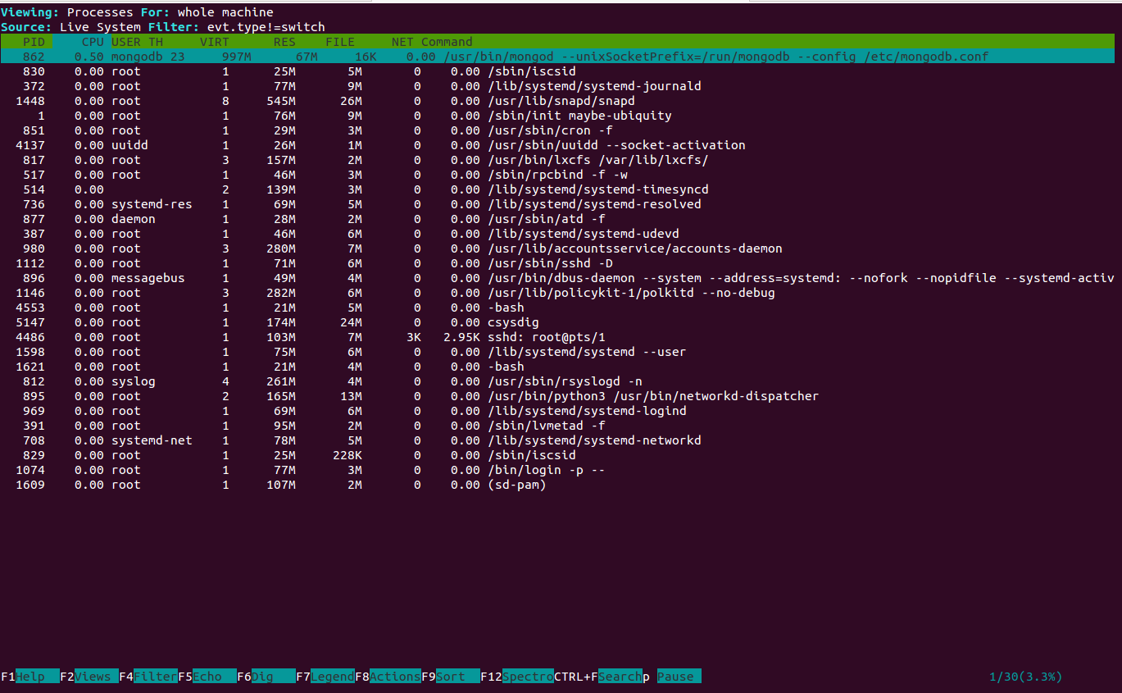
sysdigTo see the more useful output run the following command:
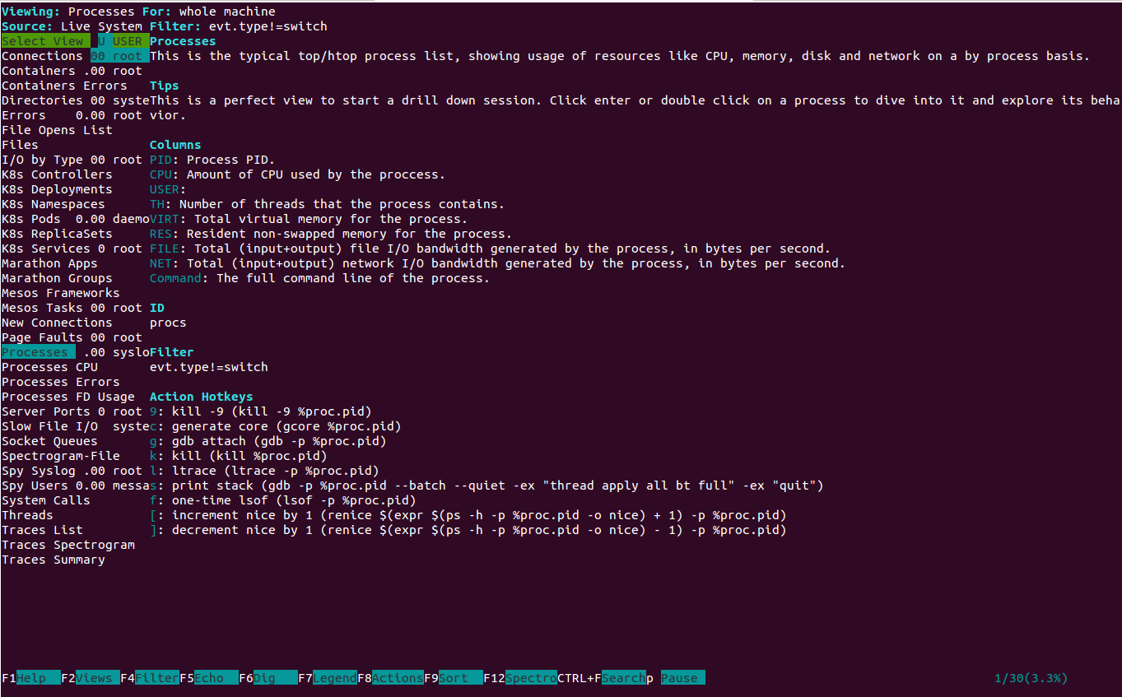
csysdigYou should see the following image:


You can also filter on a single process. For example, monitor events from command free. Run the following command:
sysdig proc.name=freeNext, open another terminal and run the following command:
free -mNow, navigate to first terminal, you should see the following output:
936681 11:44:43.343571078 0 free (4285) < openat fd=-2(ENOENT)
936682 11:44:43.343571938 0 free (4285) > openat dirfd=4294967196 name=/usr/share/locale-langpack/en_US.UTF-8/LC_MESSAGES/procps-ng.mo flags=1(O_RDONLY) mode=0
936683 11:44:43.343574213 0 free (4285) < openat fd=-2(ENOENT)
936684 11:44:43.343575039 0 free (4285) > openat dirfd=4294967196 name=/usr/share/locale-langpack/en_US.utf8/LC_MESSAGES/procps-ng.mo flags=1(O_RDONLY) mode=0
936685 11:44:43.343577111 0 free (4285) < openat fd=-2(ENOENT)
936686 11:44:43.343577952 0 free (4285) > openat dirfd=4294967196 name=/usr/share/locale-langpack/en_US/LC_MESSAGES/procps-ng.mo flags=1(O_RDONLY) mode=0
936687 11:44:43.343579971 0 free (4285) < openat fd=-2(ENOENT)
936688 11:44:43.343580810 0 free (4285) > openat dirfd=4294967196 name=/usr/share/locale-langpack/en.UTF-8/LC_MESSAGES/procps-ng.mo flags=1(O_RDONLY) mode=0
936689 11:44:43.343582830 0 free (4285) < openat fd=-2(ENOENT)
936690 11:44:43.343583659 0 free (4285) > openat dirfd=4294967196 name=/usr/share/locale-langpack/en.utf8/LC_MESSAGES/procps-ng.mo flags=1(O_RDONLY) mode=0
936691 11:44:43.343585706 0 free (4285) < openat fd=-2(ENOENT)
936692 11:44:43.343586548 0 free (4285) > openat dirfd=4294967196 name=/usr/share/locale-langpack/en/LC_MESSAGES/procps-ng.mo flags=1(O_RDONLY) mode=0
936693 11:44:43.343588558 0 free (4285) < openat fd=-2(ENOENT) Sysdig can also capture the system events and save it to a target file. You can also use -n option with sysdig to specify how many events you want Sysdig to capture. For example, to capture 10 events and save it to file with the following command:
sysdig -n 10 -w sysdig-file.scapNext, read the captured data from a file with the following command:
sysdig -r sysdig-file.scapYou can also save events continuously to files that are no more than 1 MB in size and keep only last four files with the following command:
sysdig -C 1 -W 4 -w sysdig-trace.scapSysdig comes with Lua scripts chisels that can be used to analyze the Sysdig event stream to perform useful actions.
You can list all the available chisels with the following command:
sysdig -clYou can use sysdig with spy_users to display interactive user activity. For example, run the following command on the first terminal:
sysdig -c spy_usersNext, from the remote system connect your server with ssh and run the following command:
ssh your-server-ip
free -m
df -h
Next, navigate to first terminal. You should see the interactive activity of system users in the following output:
1621 12:13:13 root) free -m
1621 12:13:17 root) df -h
You can also use sysdig with netstat to view system network connections:
sysdig -c netstatOutput:
Proto Server Address           Client Address           State          TID/PID/Program Name
tcp   127.0.0.1:27017          0.0.0.0:*                LISTEN         1231/862/signalP.gThread
udp   0.0.0.0:111              0.0.0.0:*                LISTEN         517/517/rpcbind
udp   0.0.0.0:693              0.0.0.0:*                LISTEN         517/517/rpcbind
tcp   0.0.0.0:111              0.0.0.0:*                LISTEN         517/517/rpcbind
tcp   192.168.0.11:22          192.168.0.249:60476      ESTABLISHED    4486/4486/sshd
tcp   127.0.0.1:27017          0.0.0.0:*                LISTEN         1301/862/TTLMonitor
tcp   127.0.0.1:27017          0.0.0.0:*                LISTEN         1299/862/Network.cutor-0
tcp   127.0.0.1:27017          0.0.0.0:*                LISTEN         1290/862/mongod
tcp 0.0.0.0:22 0.0.0.0:* LISTEN 1112/1112/sshdHow to Setup RackTables Data Center Management Tool on Ubuntu 18.04

39 posts | 6 followers
FollowAlibaba Cloud MVP - March 20, 2020
Hiteshjethva - January 8, 2020
Hiteshjethva - January 8, 2020
Hiteshjethva - January 8, 2020
Hiteshjethva - January 8, 2020
Alibaba Clouder - June 3, 2020

39 posts | 6 followers
Follow Managed Service for Prometheus
Multi-source metrics are aggregated to monitor the status of your business and services in real time.
Learn More Application Real-Time Monitoring Service
Build business monitoring capabilities with real time response based on frontend monitoring, application monitoring, and custom business monitoring capabilities
Learn More Resource Management
Organize and manage your resources in a hierarchical manner by using resource directories, folders, accounts, and resource groups.
Learn More Super App Solution for Telcos
Alibaba Cloud (in partnership with Whale Cloud) helps telcos build an all-in-one telecommunication and digital lifestyle platform based on DingTalk.
Learn MoreMore Posts by Hiteshjethva