By Hitesh Jethva, Alibaba Cloud Tech Share Author. Tech Share is Alibaba Cloud's incentive program to encourage the sharing of technical knowledge and best practices within the cloud community.
Monit is a free and open source tool for managing and monitoring processes, programs, files, directories and filesystems on a Unix system. Monit also monitors different services like Apache, Nginx, MySQL, FTP, SSH, Sendmail and many more. It allows system administrators to get notified and fix problems as soon as possible with minimal interruption. Monit comes with user-friendly web interface where you can easily view the system status. You can also monitor remote hosts TCP/IP port, server protocols and ping using Monit. If any services go down, Monit conducts automatic maintenance and repair and can execute meaningful causal actions in error situations. Monit keeps its own log file and alerts about any critical error conditions and recovery status via customizable messages.
In this tutorial, I will walk you through the process of installing Monit monitoring tool on an Alibaba Cloud Elastic Compute Service (ECS) Ubuntu 16.04 Server
First, log in to your Alibaba Cloud ECS Console. Create a new ECS instance, choosing Ubuntu 16.04 as the operating system with at least 2GB RAM. Connect to your ECS instance and log in as the root user.
Once you are logged into your Ubuntu 16.04 instance, run the following command to update your base system with the latest available packages.
apt-get update -yBy default, Monit is available in the Ubuntu 16.04 default repository. You can install it by just running the following command:
apt-get install monit -yOnce the Monit has been installed, start Monit service and enable it to start on boot time with the following command:
systemctl start monit
systemctl enable monit
You can check the status of Monit with the following command:
systemctl status monitOutput:
  monit.service - LSB: service and resource monitoring daemon
   Loaded: loaded (/etc/init.d/monit; bad; vendor preset: enabled)
   Active: active (running) since Sun 2018-09-02 16:13:12 IST; 3min 53s ago
     Docs: man:systemd-sysv-generator(8)
  Process: 1580 ExecStart=/etc/init.d/monit start (code=exited, status=0/SUCCESS)
   CGroup: /system.slice/monit.service
           └─1589 /usr/bin/monit -c /etc/monit/monitrc

Sep 02 16:13:11 mail.example.com systemd[1]: Starting LSB: service and resource monitoring daemon...
Sep 02 16:13:11 mail.example.com monit[1580]:  * Starting daemon monitor monit
Sep 02 16:13:12 mail.example.com monit[1580]: /etc/monit/monitrc:289: Include failed -- Success '/etc/monit/conf.d/*'
Sep 02 16:13:12 mail.example.com monit[1580]:    ...done.
Sep 02 16:13:12 mail.example.com systemd[1]: Started LSB: service and resource monitoring daemon.Monit comes with user friendly-web interface to view the system status and manage them through the web browser. By default, Monit web interface is disabled. You can enable it by editing /etc/monit/monitrc configuration file:
nano /etc/monit/monitrcMake the following changes:
set httpd port 2812
allow admin:monit # require user 'admin' with password 'monit'
Save the file, then restart Monit service to apply the changes:
systemctl restart monitOpen your web browser and type the URL http://your-server-ip:2812. You will be redirected to the Monit login page:
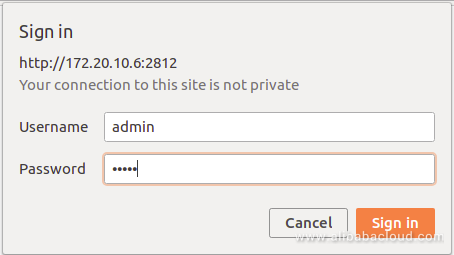
Provide monit username as admin and password as monit, then click on the Sign In button. You should see the Monit default dashboard in the following page:
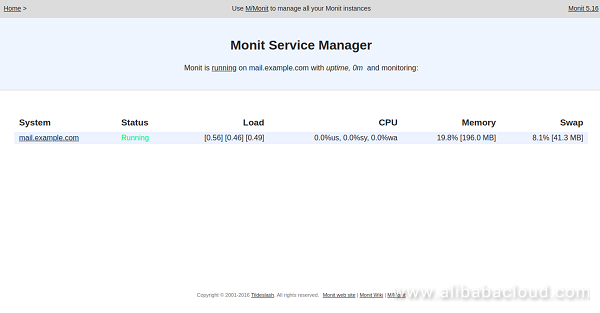
Click on the mail.example.com to view to system status of your server in the following page:
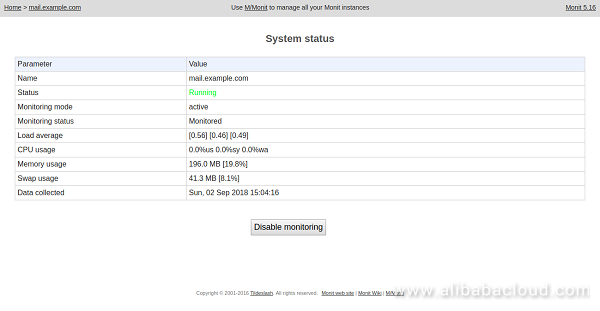
By default, Monit comes with a pre-defined configuration template for different services. You can list all of them with the following command:
ls -l /etc/monit/conf-available/
total 64
-rw-r--r-- 1 root root  481 Feb 16  2016 acpid
-rw-r--r-- 1 root root  455 Feb 16  2016 at
-rw-r--r-- 1 root root  691 Feb 16  2016 cron
-rw-r--r-- 1 root root  602 Feb 16  2016 mdadm
-rw-r--r-- 1 root root  669 Feb 16  2016 memcached
-rw-r--r-- 1 root root  703 Feb 16  2016 mysql
-rw-r--r-- 1 root root  521 Feb 16  2016 nginx
-rw-r--r-- 1 root root  471 Feb 16  2016 openntpd
-rw-r--r-- 1 root root  950 Feb 16  2016 openssh-server
-rw-r--r-- 1 root root  683 Feb 16  2016 pdns-recursor
-rw-r--r-- 1 root root  867 Feb 16  2016 rsyslog
-rw-r--r-- 1 root root  501 Feb 16  2016 smartmontools
-rw-r--r-- 1 root root 306 Feb 16 2016 snmpdFirst, you will need to install Apache and vsftpd to your system. You can install them with the following command:
apt-get install apache2 vsftpd -yNext, you will need to create the configuration file for vsftpd. You can do this with the following command:
nano /etc/monit/conf-available/vsftpdAdd the following lines:
check process vsftpd with pidfile /var/run/vsftpd/vsftpd.pid
   start program = "/etc/init.d/vsftpd start"
   stop  program = "/etc/init.d/vsftpd stop"
if failed port 21 protocol ftp then restart
Save and close the file. Then, enable the configuration file with the following command:
ln -s /etc/monit/conf-available/vsftpd /etc/monit/conf-enabled/By default, Apache and SSH configuration file is available in /etc/monit/conf-available/ directory. So, you will only need to enable them. You can do this with the following command:
ln -s /etc/monit/conf-available/apache2 /etc/monit/conf-enabled/
ln -s /etc/monit/conf-available/openssh-server /etc/monit/conf-enabled/
Next, verify the Monit status with the following command:
monit -tOutput:
Control file syntax OKNext, restart the Monit service to apply the changes:
systemctl reload monitYou can see the new service on the Monit web interface:
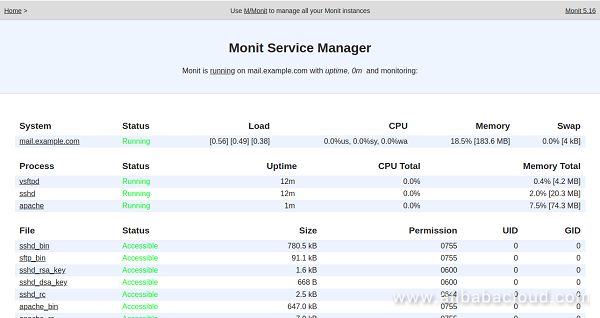
Click on the apache to see the detailed information of apache service in the following page:
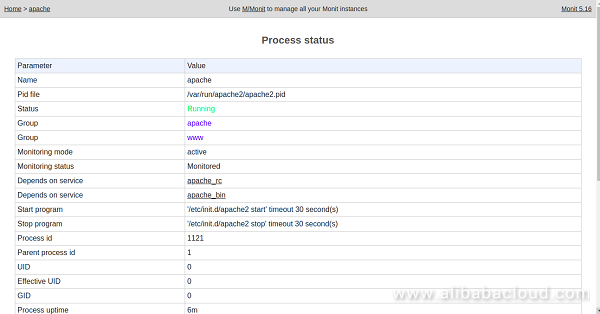
You can also check the status of all the service using the following command:
monit statusOutput:
/etc/monit/monitrc:289: Include failed -- Success '/etc/monit/conf.d/*'
The Monit daemon 5.16 uptime: 10m

Process 'vsftpd'
  status                            Running
  monitoring status                 Monitored
  pid                               2400
  parent pid                        1
  uid                               0
  effective uid                     116
  gid                               65534
  uptime                            8m
  threads                           1
  children                          0
  memory                            4.3 MB
  memory total                      4.3 MB
  memory percent                    0.4%
  memory percent total              0.4%
  cpu percent                       0.0%
  cpu percent total                 0.0%
  port response time                14.363 ms to [localhost]:21 type TCP/IP protocol FTP
  data collected                    Sun, 02 Sep 2018 16:34:53

Process 'sshd'
  status                            Running
  monitoring status                 Monitored
  pid                               821
  parent pid                        1
  uid                               0
  effective uid                     0
  gid                               0
  uptime                            22m
  threads                           1
  children                          2
  memory                            6.2 MB
  memory total                      18.5 MB
  memory percent                    0.6%
  memory percent total              1.9%
  cpu percent                       0.0%
  cpu percent total                 0.0%
  port response time                30.107 ms to [localhost]:22 type TCP/IP protocol SSH
  data collected                    Sun, 02 Sep 2018 16:34:53

File 'sshd_bin'
  status                            Accessible
  monitoring status                 Monitored
  permission                        755
  uid                               0
  gid                               0
  size                              780.5 kB
  timestamp                         Tue, 25 Oct 2016 11:44:28
  checksum                          c1ca9f417e7af767a5ee77a65aef1755 (MD5)
  data collected                    Sun, 02 Sep 2018 16:34:53

File 'sftp_bin'
  status                            Accessible
  monitoring status                 Monitored
  permission                        755
  uid                               0
  gid                               0
  size                              91.1 kB
  timestamp                         Tue, 25 Oct 2016 11:44:28
  checksum                          39a9ae86358cd68beb07a401da042e16 (MD5)
  data collected                    Sun, 02 Sep 2018 16:34:53

File 'sshd_rsa_key'
  status                            Accessible
  monitoring status                 Monitored
  permission                        600
  uid                               0
  gid                               0
  size                              1.6 kB
  timestamp                         Wed, 29 Oct 2014 17:50:55
  checksum                          37b4d7a80c9d27c1425bd0e05495186b (MD5)
  data collected                    Sun, 02 Sep 2018 16:34:53

File 'sshd_dsa_key'
  status                            Accessible
  monitoring status                 Monitored
  permission                        600
  uid                               0
  gid                               0
  size                              668 B
  timestamp                         Wed, 29 Oct 2014 17:50:55
  checksum                          efb15e5be794f6c297dfbd6061dd5b31 (MD5)
  data collected                    Sun, 02 Sep 2018 16:34:53

File 'sshd_rc'
  status                            Accessible
  monitoring status                 Monitored
  permission                        644
  uid                               0
  gid                               0
  size                              2.5 kB
  timestamp                         Mon, 24 Oct 2016 11:31:44
  checksum                          bccf9af9c7027afd0895d8ff8e02761a (MD5)
  data collected                    Sun, 02 Sep 2018 16:34:53

Process 'apache'
  status                            Running
  monitoring status                 Monitored
  pid                               2118
  parent pid                        1
  uid                               0
  effective uid                     0
  gid                               0
  uptime                            11m
  threads                           1
  children                          5
  memory                            28.5 MB
  memory total                      79.8 MB
  memory percent                    2.9%
  memory percent total              8.0%
  cpu percent                       0.0%
  cpu percent total                 0.0%
  port response time                2.503 ms to [localhost]:80/server-status type TCP/IP protocol HTTP
  data collected                    Sun, 02 Sep 2018 16:34:53

File 'apache_bin'
  status                            Accessible
  monitoring status                 Monitored
  permission                        755
  uid                               0
  gid                               0
  size                              647.0 kB
  timestamp                         Fri, 31 Aug 2018 20:50:15
  checksum                          0ae4f3be357071a17aa3f8d93a1d2f11 (MD5)
  data collected                    Sun, 02 Sep 2018 16:34:53

File 'apache_rc'
  status                            Accessible
  monitoring status                 Monitored
  permission                        755
  uid                               0
  gid                               0
  size                              7.9 kB
  timestamp                         Tue, 25 Oct 2016 11:54:22
  checksum                          744ef9ca584493299c353e2251cbf993 (MD5)
  data collected                    Sun, 02 Sep 2018 16:34:53

System 'mail.example.com'
  status                            Running
  monitoring status                 Monitored
  load average                      [0.39] [0.36] [0.36]
  cpu                               17.2%us 2.2%sy 1.4%wa
  memory usage                      185.9 MB [18.7%]
  swap usage                        8 kB [0.0%]
data collected Monit is now configured and working fine. It's time to test the action of Monit when the service or process dies. Let's stop the vsftpd service and check whether Monit starts vsftpd automatically or not.
You can stop the vsftpd service with the following command:
systemctl stop vsftpdWait for the command to take effect and then check the Monit log file:
tail -f /var/log/monit.logYou should see that vsftpd service started automatically:
[IST Sep  2 16:26:52] error    : 'vsftpd' process is not running
[IST Sep  2 16:26:52] info     : 'vsftpd' trying to restart
[IST Sep 2 16:26:52] info : 'vsftpd' start: /etc/init.d/vsftpdMonit also provides notifications via email if any service goes down. To do so, you will need to install Postfix as your MTA to your system. You can install it with the following command:
apt-get install postfix mailutils -yDuring the installation process, you will be asked to select a server configuration type as shown in the following image:
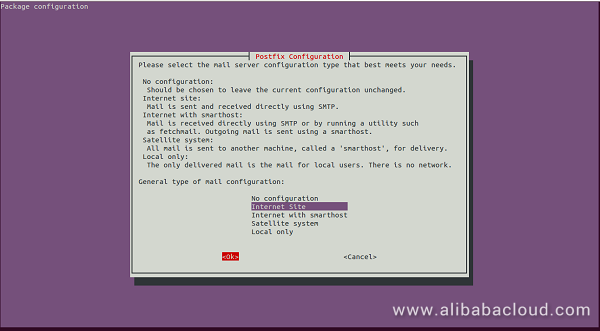
Choose Internet Site and click on the OK button to complete the installation.
Next, you will need to configure /etc/monit/monitrc for setting up email notifications. Here, we will configure Monit to send an alert via email if apache service goes down.
nano /etc/monit/monitrcMake the following changes:
set mailserver localhost
 set mail-format {
   from:    monit@$HOST
   subject: monit alert --  $EVENT $SERVICE
   message: $EVENT Service $SERVICE
                 Date:        $DATE
                 Action:      $ACTION
                 Host:        $HOST
                 Description: $DESCRIPTION

            Your faithful employee,
            Monit
 }
set alert root@localhost not on { instance, action }
check file apache2-error with path /var/log/apache2/error.log
    if match "^timed out" then alert

check system localhost
    if loadavg (1min) > 4 then alert
    if loadavg (5min) > 2 then alert
    if memory usage > 75% then alert
    if swap usage > 25% then alert
    if cpu usage (user) > 70% then alert
    if cpu usage (system) > 30% then alert
    if cpu usage (wait) > 20% then alert
Save and close the file. Then, restart Monit to apply the changes:
systemctl restart monitNext, stop the Apache service to check whether Monit send an email notification or not:
systemctl stop apache2Check the mail with the following command:
tail -f /var/mail/rootIf everything works well, you should see the following output:
Does not exist Service apache
                 Date:        Sun, 02 Sep 2018 21:34:33
                 Action:      restart
                 Host:        mail.example.com
                 Description: process is not running

            Your faithful employee,
            Monit
Congratulations! You have successfully installed Monit monitoring tool on an Alibaba Cloud Elastic Compute Service (ECS) Ubuntu 16.04.

2,593 posts | 793 followers
FollowAlibaba Clouder - February 26, 2018
Alibaba Clouder - May 7, 2019
Alibaba Clouder - June 13, 2019
Alibaba Clouder - June 13, 2019
Alibaba Clouder - September 30, 2017
Alibaba Clouder - June 13, 2019

2,593 posts | 793 followers
Follow ECS(Elastic Compute Service)
Elastic and secure virtual cloud servers to cater all your cloud hosting needs.
Learn More CloudMonitor
Automate performance monitoring of all your web resources and applications in real-time
Learn More Marketplace
Marketplace is an online market for users to search and quickly use the software as image for Alibaba Cloud products.
Learn MoreMore Posts by Alibaba Clouder