By Hitesh Jethva, Alibaba Cloud Tech Share Author. Tech Share is Alibaba Cloud's incentive program to encourage the sharing of technical knowledge and best practices within the cloud community.
Check_MK is a free and open source IT monitoring tool that comes with Nagios and other add-ons for gathering, monitoring, and graphing data. Check_MK can be used as a front-end and extension of a Nagios for monitoring performance and health of networking devices, servers and infrastructure systems. Check_MK allows you to create a rule-based configuration using Python to make it scale better, allowing more systems to be monitored from a single Nagios server. Check_MK stores the monitored performance data in a standard RRD format that can be used to create reports for that.
In this tutorial, we will be installing and configuring Check_MK on an Alibaba Cloud Elastic Compute Service (ECS) CentOS 7 server.
First, Login to your Alibaba Cloud ECS Console. Create a new ECS instance, choosing CentOS 7 as the operating system with at least 2GB RAM. Connect to your ECS instance and log in as the root user.
Once you are logged into your CentOS 7 instance, run the following command to update your base system with the latest available packages.
yum update -yBefore starting, you will need to disable SELinux and Firewalld to your system.
First, disable Firewalld with the following command:
systemctl stop firewalld
systemctl disable firewalld
Next, disable SELinux by editing /etc/selinux/config file:
nano /etc/selinux/configMake the following changes:
SELINUX=disabledSave and close the file. Then, restart your server to apply the changes:
init 6Before installing Check_MK, you will need to install some packages required by Check_MK. You can install all of them by running the following command:
yum install xinetd openssl python epel-release -yNext, you will need to download Check_MK package from OMD's Official Website. You can download it with the following command:
wget https://mathias-kettner.de/support/1.4.0p12/check-mk-raw-1.4.0p12-el7-59.x86_64.rpmNext, install Check_MK with all required dependencies by running the following command:
yum install --nogpgcheck check-mk-raw-1.4.0p12-el7-59.x86_64.rpmThe omd is a command line utility that comes with Check_MK package. It is used to manage OMD instances on the server.
You can list out the different options available with omd by running the following command:
omdOutput:
Usage (called as root):

 omd help                               Show general help
 omd setversion VERSION                 Sets the default version of OMD which will be used by new sites
 omd version    [SITE]                  Show version of OMD
 omd versions                           List installed OMD versions
 omd sites                              Show list of sites
 omd create     SITE                    Create a new site (-u UID, -g GID)
 omd init       SITE                    Populate site directory with default files and enable the site
 omd rm         SITE                    Remove a site (and its data)
 omd disable    SITE                    Disable a site (stop it, unmount tmpfs, remove Apache hook)
 omd enable     SITE                    Enable a site (reenable a formerly disabled site)
 omd mv         SITE NEWNAME            Rename a site
 omd cp         SITE NEWNAME            Make a copy of a site
 omd update     SITE                    Update site to other version of OMD
 omd start      [SITE] [SERVICE]        Start services of one or all sites
 omd stop       [SITE] [SERVICE]        Stop services of site(s)
 omd restart    [SITE] [SERVICE]        Restart services of site(s)
 omd reload     [SITE] [SERVICE]        Reload services of site(s)
 omd status     [SITE] [SERVICE]        Show status of services of site(s)
 omd config     SITE ...                Show and set site configuration parameters
 omd diff       SITE ([RELBASE])        Shows differences compared to the original version files
 omd vimdiff    SITE ([RELBASE])        Opens vimdiff with the current file and the default version of that file
 omd reset      SITE ([RELBASE])        Reset file to default version from skeleton
 omd su         SITE                    Run a shell as a site-user
 omd umount     [SITE]                  Umount ramdisk volumes of site(s)
 omd backup     SITE [-|ARCHIVE_PATH]   Create a backup tarball of a site, writing it to a file or stdout
 omd restore    [SITE] [-|ARCHIVE_PATH] Restores the backup of a site to an existing site or creates a new site
 omd cleanup                            Uninstall all OMD versions that are not used by any site.

General Options:
 -V <version>                    set specific version, useful in combination with update/create
omd COMMAND -h, --help show available options of COMMANDCheck_MK is now installed, it's time to create your first monitoring instance.
You can do this by running the following command:
omd create monitoringOutput:
Adding /omd/sites/monitoring/tmp to /etc/fstab.
Creating temporary filesystem /omd/sites/monitoring/tmp...OK
Restarting Apache...OK
Created new site monitoring with version 2.80-labs-edition.

  The site can be started with omd start monitoring.
  The default web UI is available at http://Node1/monitoring/
  The admin user for the web applications is omdadmin with password omd.
  Please do a su - monitoring for administration of this site.
Next, start the instance with the following command:
omd start monitoringOutput:
Starting rrdcached...OK
Starting npcd...OK
Starting naemon...OK
Starting dedicated Apache for site monitor...OK
Initializing Crontab...OK
Next, you will need to create an admin user and password to access the instance.
You can do this by running the following command:
su - monitoring

OMD[monitoring@Node1]:~$ htpasswd -m ~/etc/htpasswd cmkadmin
New password:
Re-type new password:
Adding password for user cmkadmin
Now, open your web browser and type the URL http://192.168.0.106/monitoring. You will be redirected to the Check_MK login page:

Provide your admin username and password. Then, click on the Login button. You should see the following page:
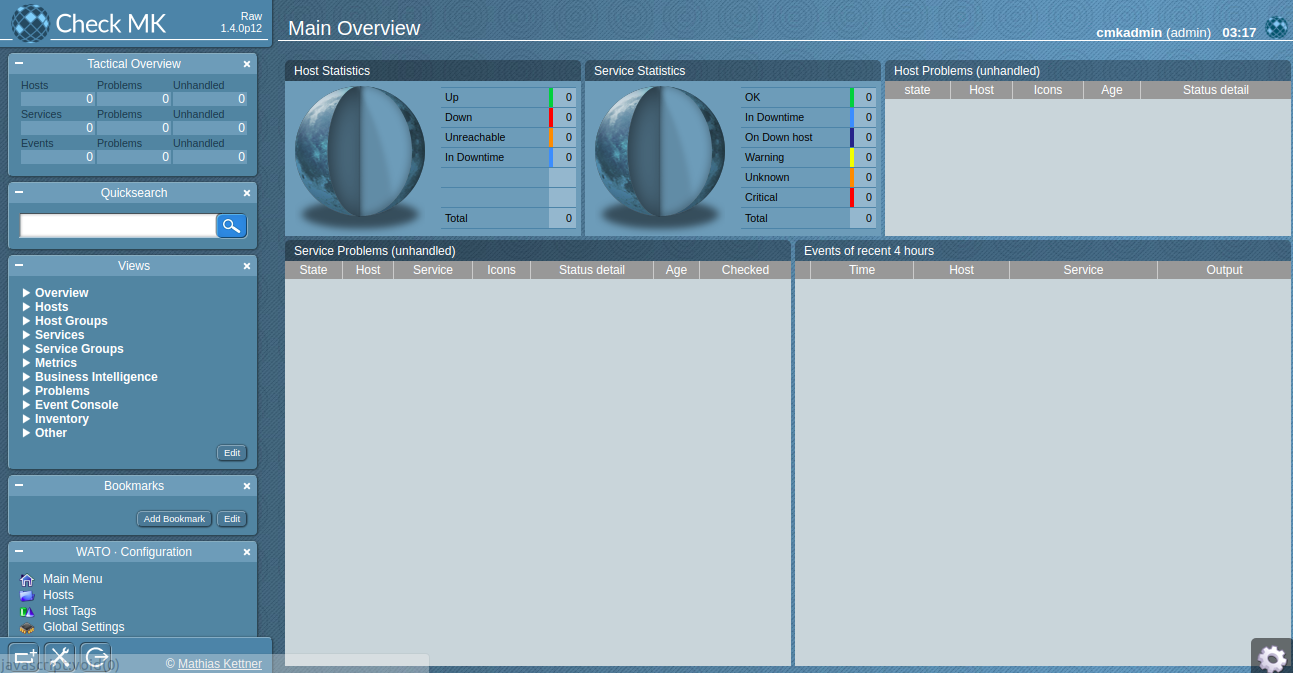
In the above image, you should see that all servers and services are empty as we have not enabled any service as of now.
Next, you will need to add a Linux host for monitoring instance. Here, we will use monitoring host as Check_MK server itself.
First, download and install the Check_MK Agent to your server.
wget http://192.168.0.106/monitoring/check_mk/agents/check-mk-agent-1.4.0p12-1.noarch.rpmNext, install Check_MK agent with the following command:
rpm -ivh check-mk-agent-1.4.0p12-1.noarch.rpmNext, open the Check_MK web interface and navigate to WATO-Configuration > Hosts. You should see the following image:
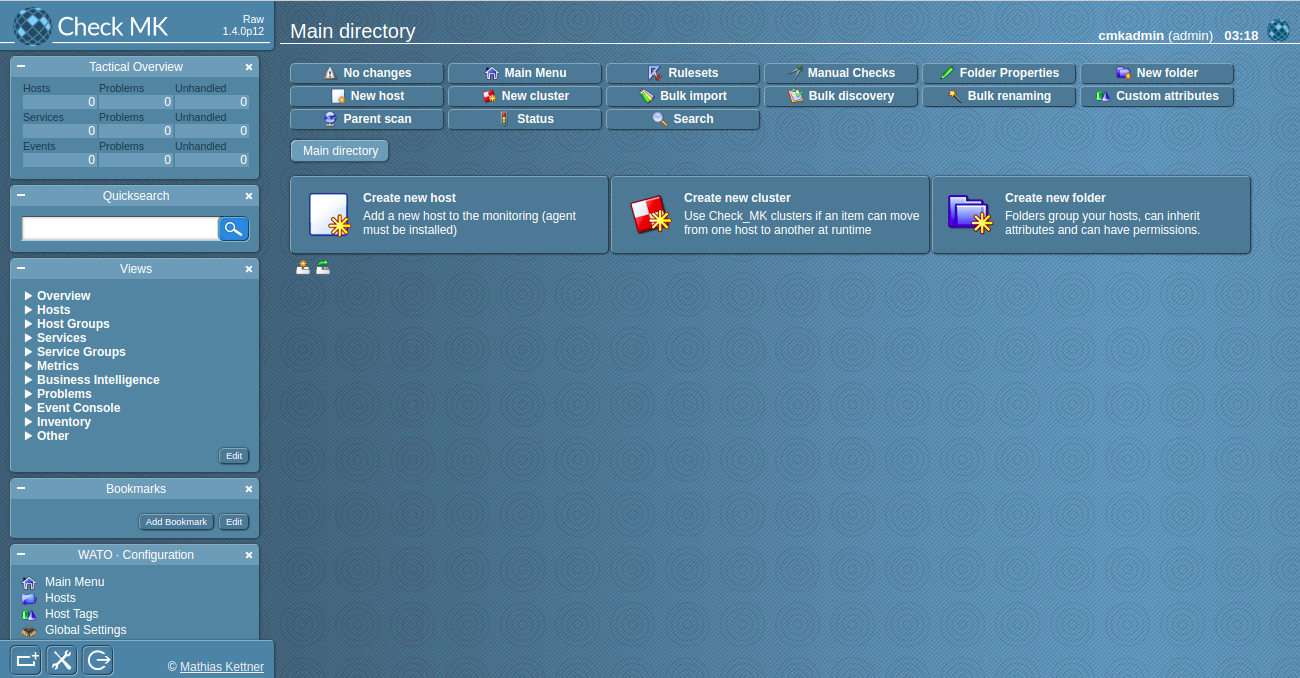
Now, click on the Create new host. You should see the following image:
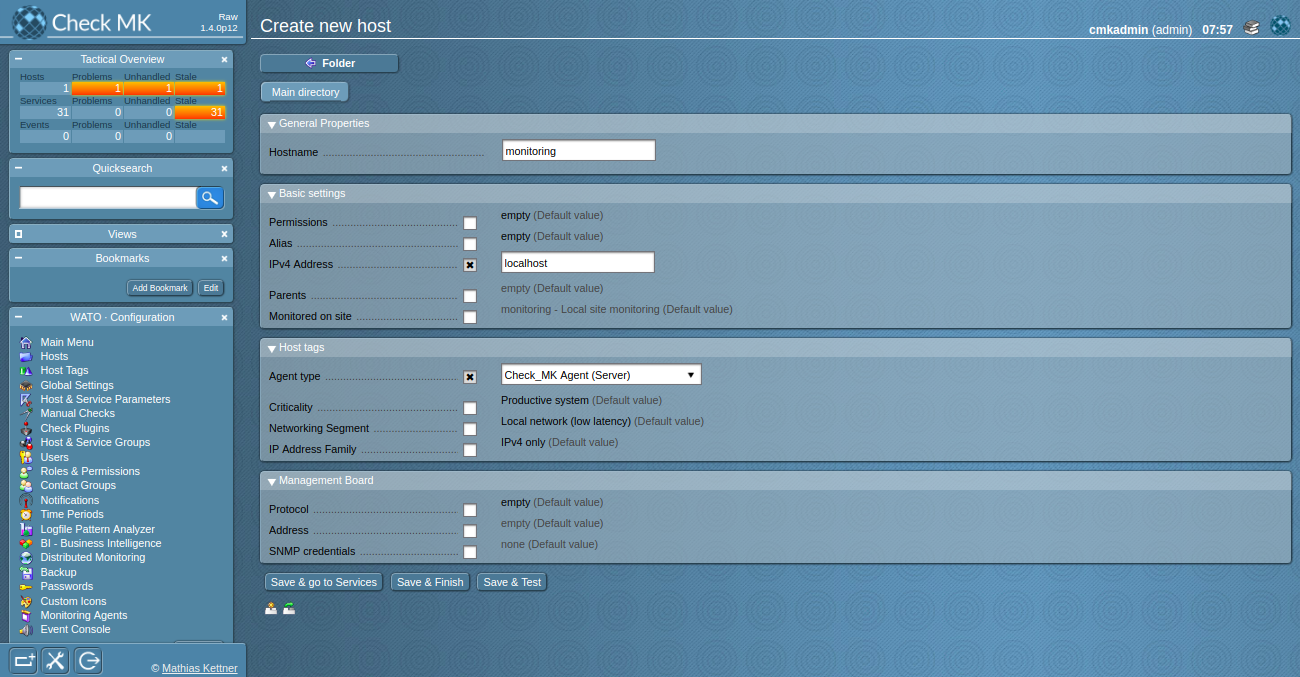
Here, provide all the required details. Then, click on the Save & go to Services button. You should see all the services in the following image:
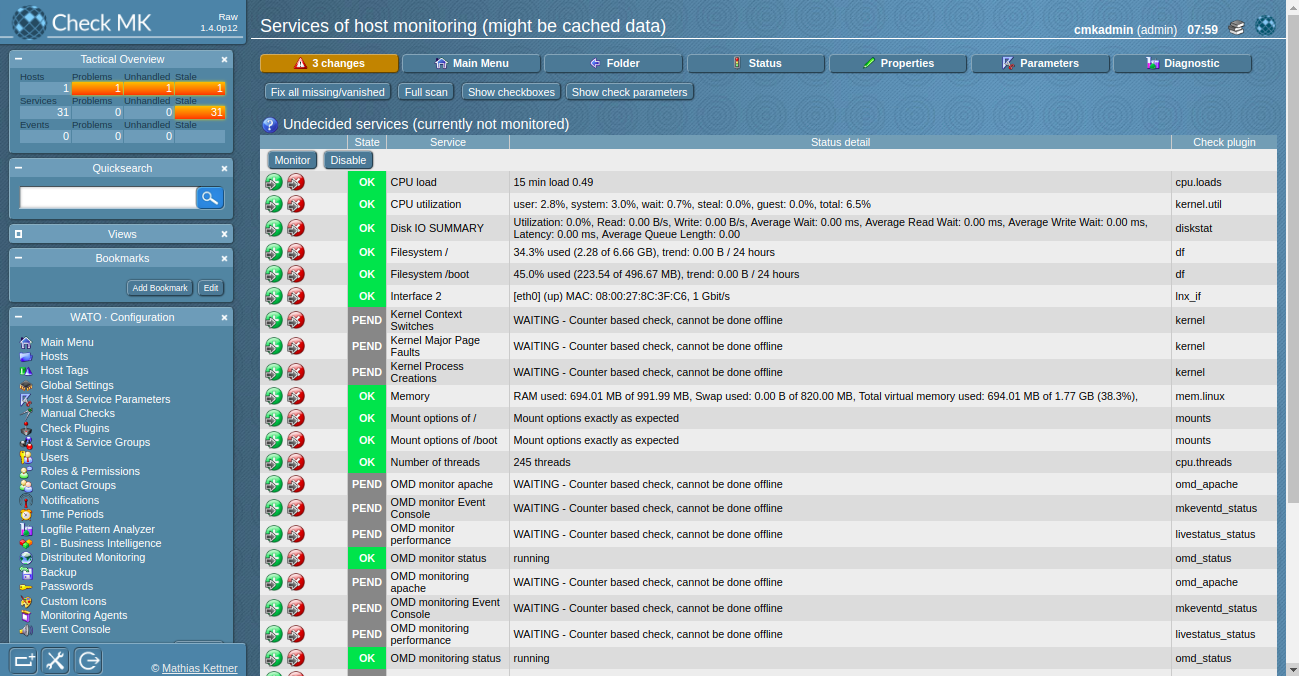
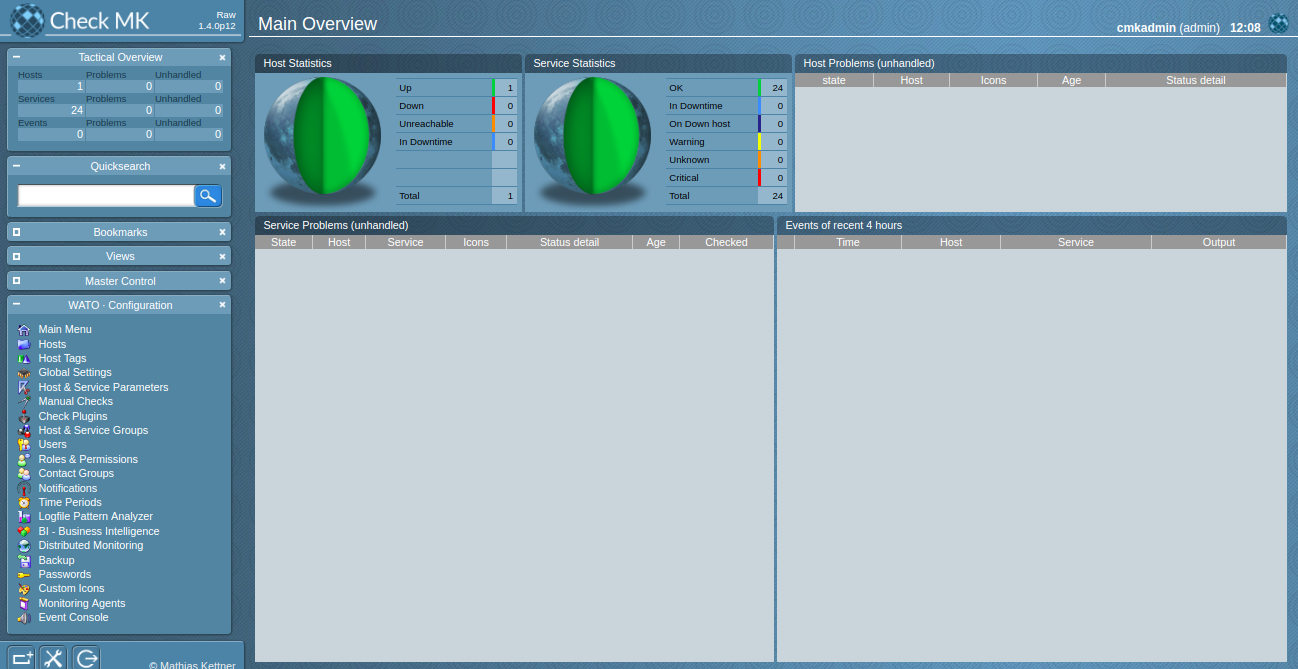
Now, go to the Check_MK web interface and click on the Dashboards > Main Overview item on the left pane. You should see the one host is up with no errors in the following page:
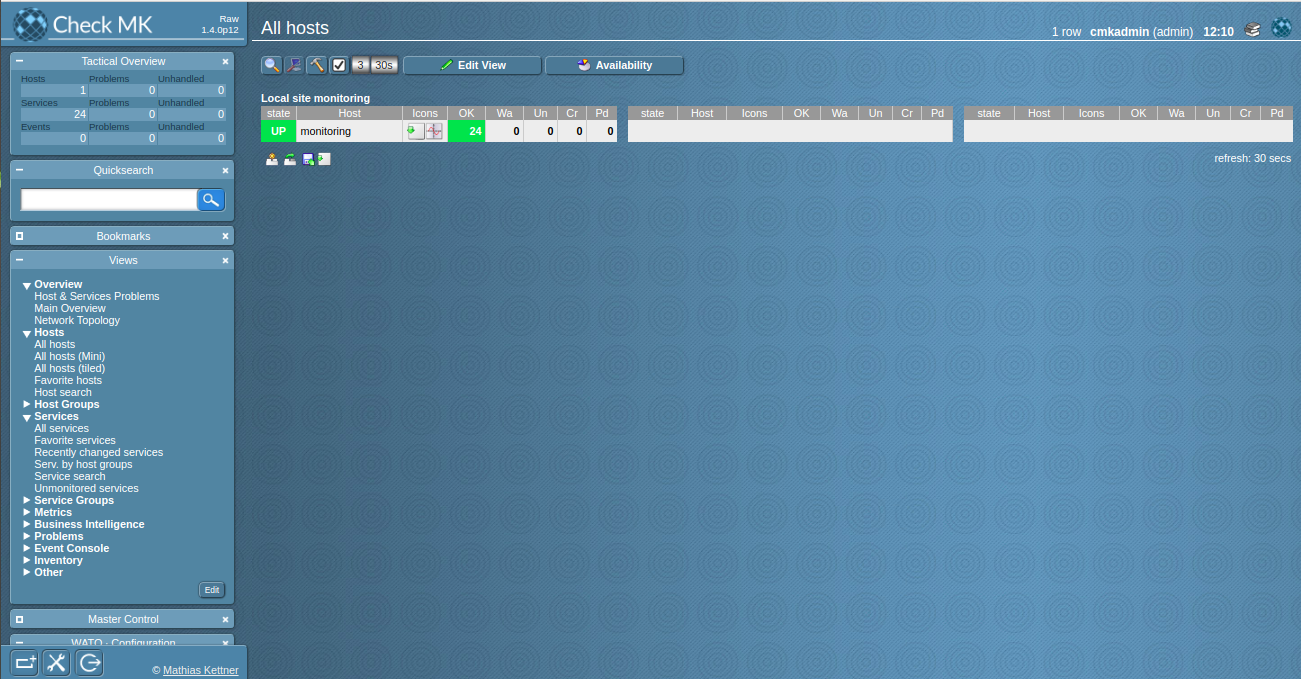
Next, click on the Views > Hosts > All hosts in the left pane. You should see your monitoring host in the following page:
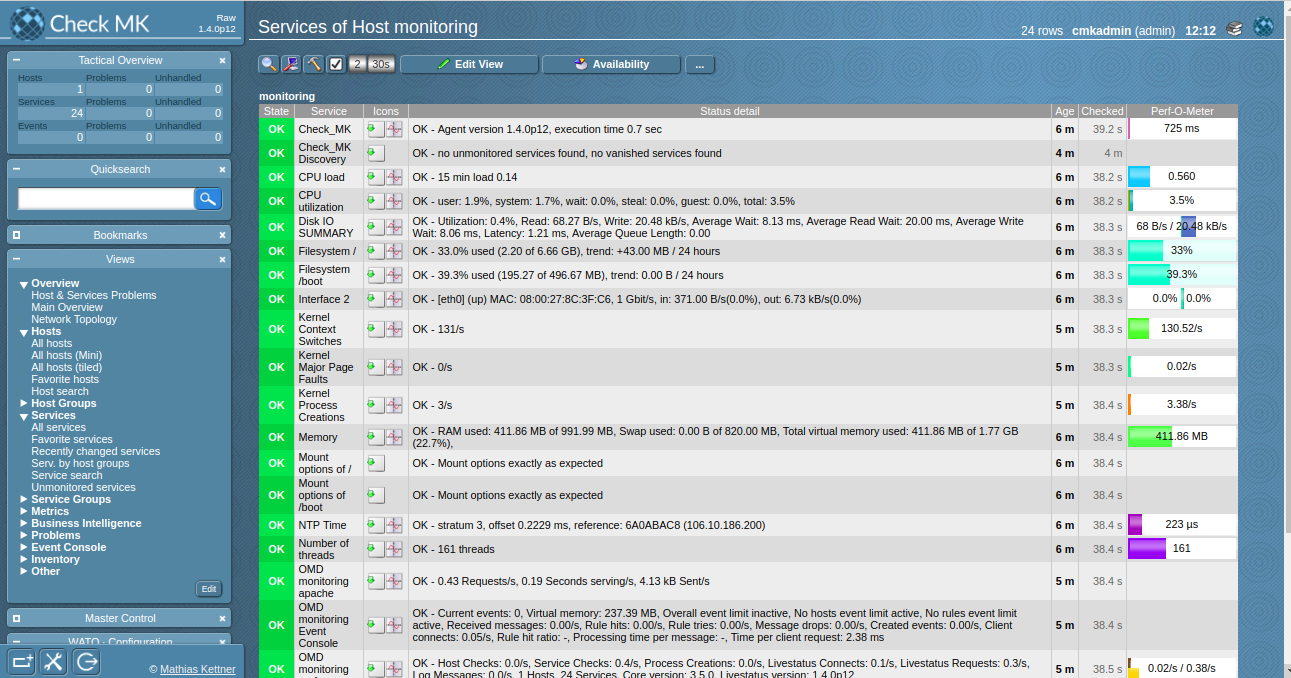
Next, click on the monitoring in the Host column. You should see the status of all the services in the following page:
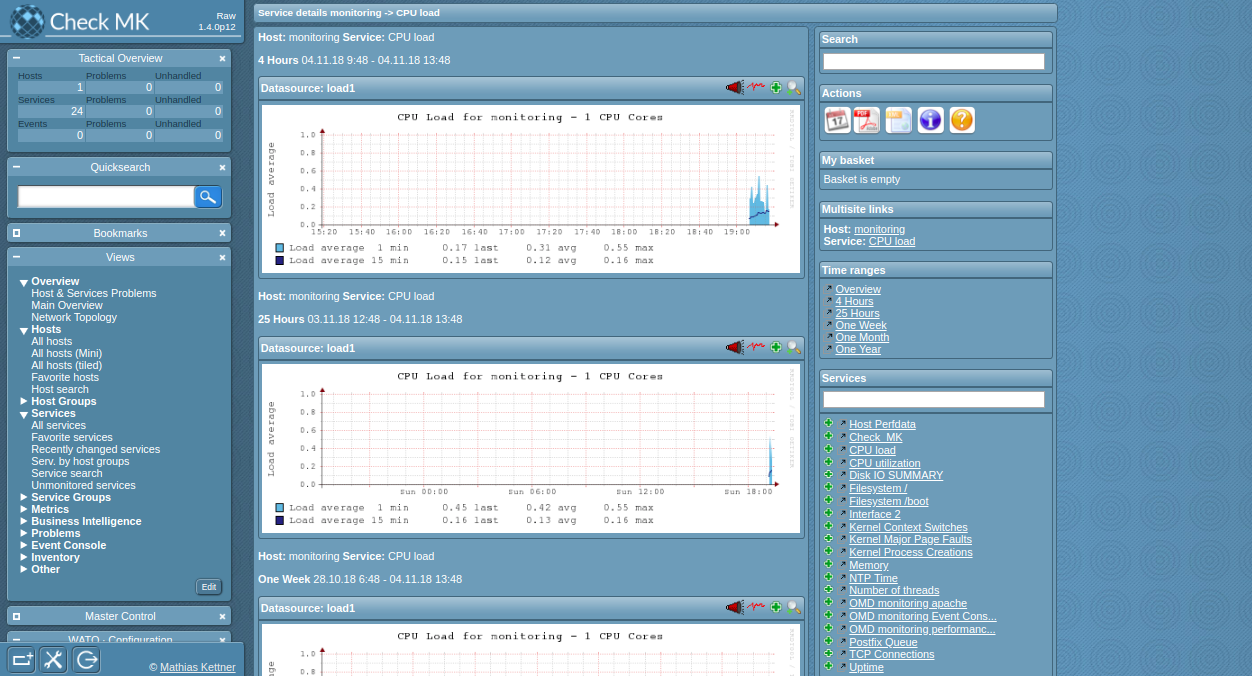
Next, click on the CPU load icon. You should see the CPU load in graphical format in the following page:
Before starting, you will need to install Ckeck_MK agent on the Ubuntu 16.04 instance.
First, log in to Ubuntu 16.04 instance and install xinetd with the following command:
apt-get install xinetd -yNext, start xinetd service with the following command:
systemctl start xinetdNext, download the Check_MK agent package from the Check_MK server instance.
wget http://192.168.0.106/monitoring/check_mk/agents/check-mk-agent_1.4.0p12-1_all.debNext, install the downloaded package with the following command:
dpkg -i check-mk-agent_1.4.0p12-1_all.debNext, go to the Check_MK web interface and click on the WATO Configuration > Hosts > Create new host button. You should see the following page:
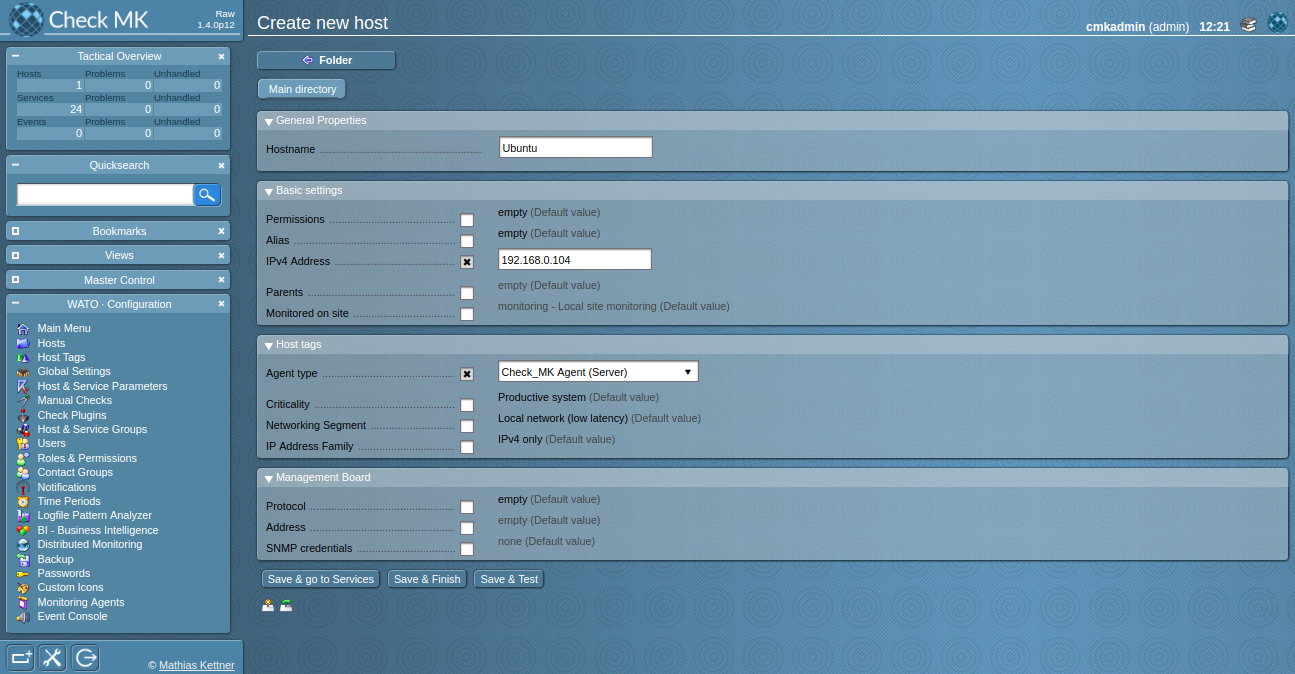
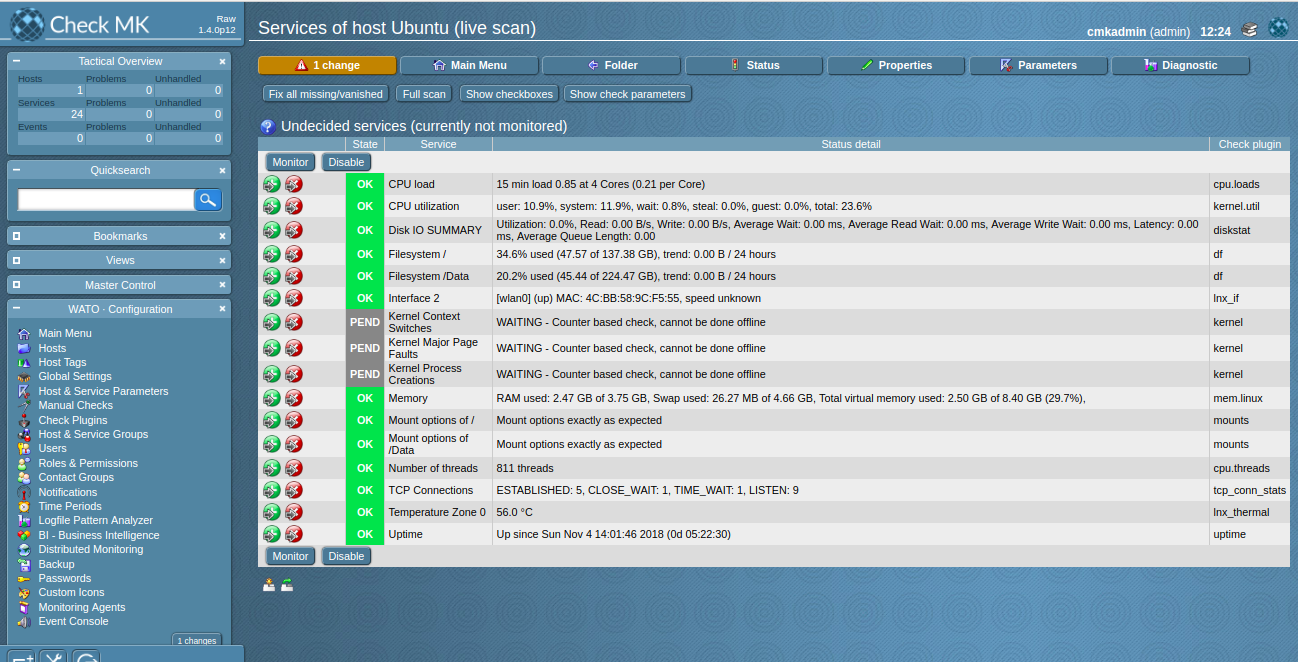
Here, provide the IP address of Ubuntu 16.04 host and select Check_MK agent. Then, click on the Save & go to Services button. You should see all the services in the following page:
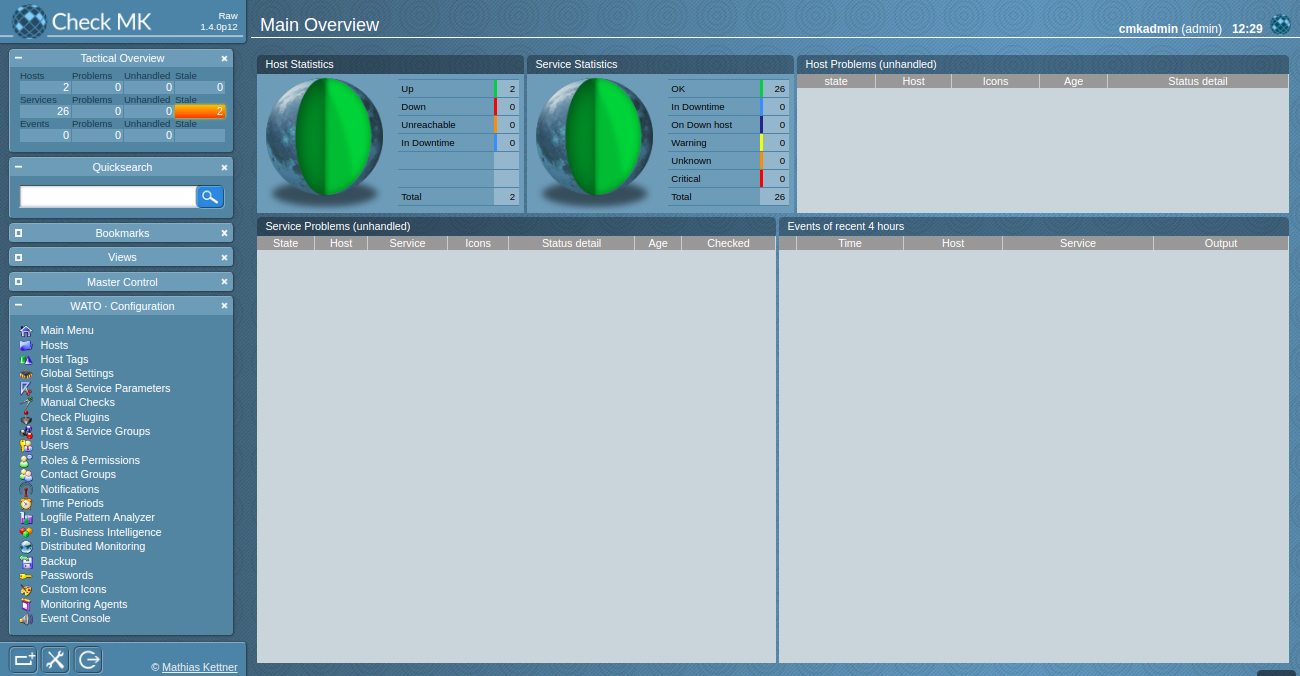
Now, go to the Check_MK web interface and click on the Dashboards > Main Overview item on the left pane. You should see the two host is up without any error in the following page:

2,593 posts | 793 followers
FollowAlibaba Clouder - July 26, 2019
Alibaba Clouder - August 9, 2019
Alibaba Clouder - May 14, 2019
Alibaba Clouder - March 28, 2019
Alibaba Clouder - May 21, 2018
Alibaba Clouder - March 25, 2019

2,593 posts | 793 followers
Follow CloudMonitor
Automate performance monitoring of all your web resources and applications in real-time
Learn More Managed Service for Prometheus
Multi-source metrics are aggregated to monitor the status of your business and services in real time.
Learn More Application Real-Time Monitoring Service
Build business monitoring capabilities with real time response based on frontend monitoring, application monitoring, and custom business monitoring capabilities
Learn More Resource Management
Organize and manage your resources in a hierarchical manner by using resource directories, folders, accounts, and resource groups.
Learn MoreMore Posts by Alibaba Clouder