By Wuming
Contributed by Alibaba Cloud Storage
Many people want to reflect the position of outliers in the index when drawing the dashboard for traffic, page view, delay, and other scenarios. It means drawing curves and marking points in one chart simultaneously should be supported in the SLS chart. Next, let's move to how to draw outliers step by step.
Next, we draw the time series and abnormal metrics based on the latency per minute metrics in the access logs. We can obtain a time series by using the following SQL statement. At the same time, we draw a straight line in the following figure, trying to mark the points beyond this red line with a red point. We often say — if the value is greater than a certain threshold, we mark it as abnormal.
* and domain: "www.abb.mock-domain.com" |
select __time__ - __time__ % 60 as time,
       avg(request_time) / 1000.0 as request_time_avg
from log
group by time
order by time
limit 10000
Naturally, we can judge by giving a threshold in the subquery (such as the parameter 10 below), and we will label it if it exceeds 10:
*
and domain: "www.abb.mock-domain.com" |
select time,
       request_time_avg,
       request_time_avg > 10 as flag
from (
              select __time__ - __time__ % 60 as time,
                     avg(request_time) / 1000.0 as request_time_avg
              from log
              group by time
              order by time
       )
limit 10000
However, in the results of the preceding query, we will get an additional column of index flags in the table. The meaning of this column is that >10 is True and ≤ 10 is False. However, the results cannot be described on a single y-axis since the value ranges of the corresponding y-axis are different. We will naturally consider whether the results can be changed to the original value if they exceed 10. Those that do not exceed 10 are expressed as 0.0. With that, we can obtain the following Query and distinguish the meaning of the corresponding flag dimension through the case when in the subquery:
*
and domain: "www.abb.mock-domain.com" |
select time,
       request_time_avg,
       case
              when request_time_avg > 10 then request_time_avg
              else 0.0
       end as flag
from (
              select __time__ - __time__ % 60 as time,
                     avg(request_time) / 1000.0 as request_time_avg
              from log
              group by time
              order by time
       )
limit 10000

We have obtained the multi-curve graph through the preceding various configurations. Although we are close to the results, we find there are too many red dots. We wonder if it is possible to keep the 0.0 dots not displayed.
We can draw a point equal to 0.0 because we provide a 0.0 point on the Y axis. Can we substitute 0.0 with null to keep it undisplayed? Let’s modify the case when and try again.
*
and domain: "www.abb.mock-domain.com" |
select time,
       request_time_avg,
       case
              when request_time_avg > 10 then request_time_avg
              else null
       end as flag
from (
              select __time__ - __time__ % 60 as time,
                     avg(request_time) / 1000.0 as request_time_avg
              from log
              group by time
              order by time
       )
limit 10000
In the preceding figure, it is very close to the result we want. The red point whose Y axis is equal to 0.0 has disappeared, but each red point is linked together into a red curve. That must be something wrong with the configuration of our curve. We enter the [Field Configuration] part again and modify the corresponding [Graphic Configuration], thus obtaining the following figure that meets our needs.

With the operations mentioned above, we finally got a time series diagram that can draw curves and specific points. Next, how can we modify the threshold that can change the number of red dots? We need to introduce the filter in the SLS dashboard.
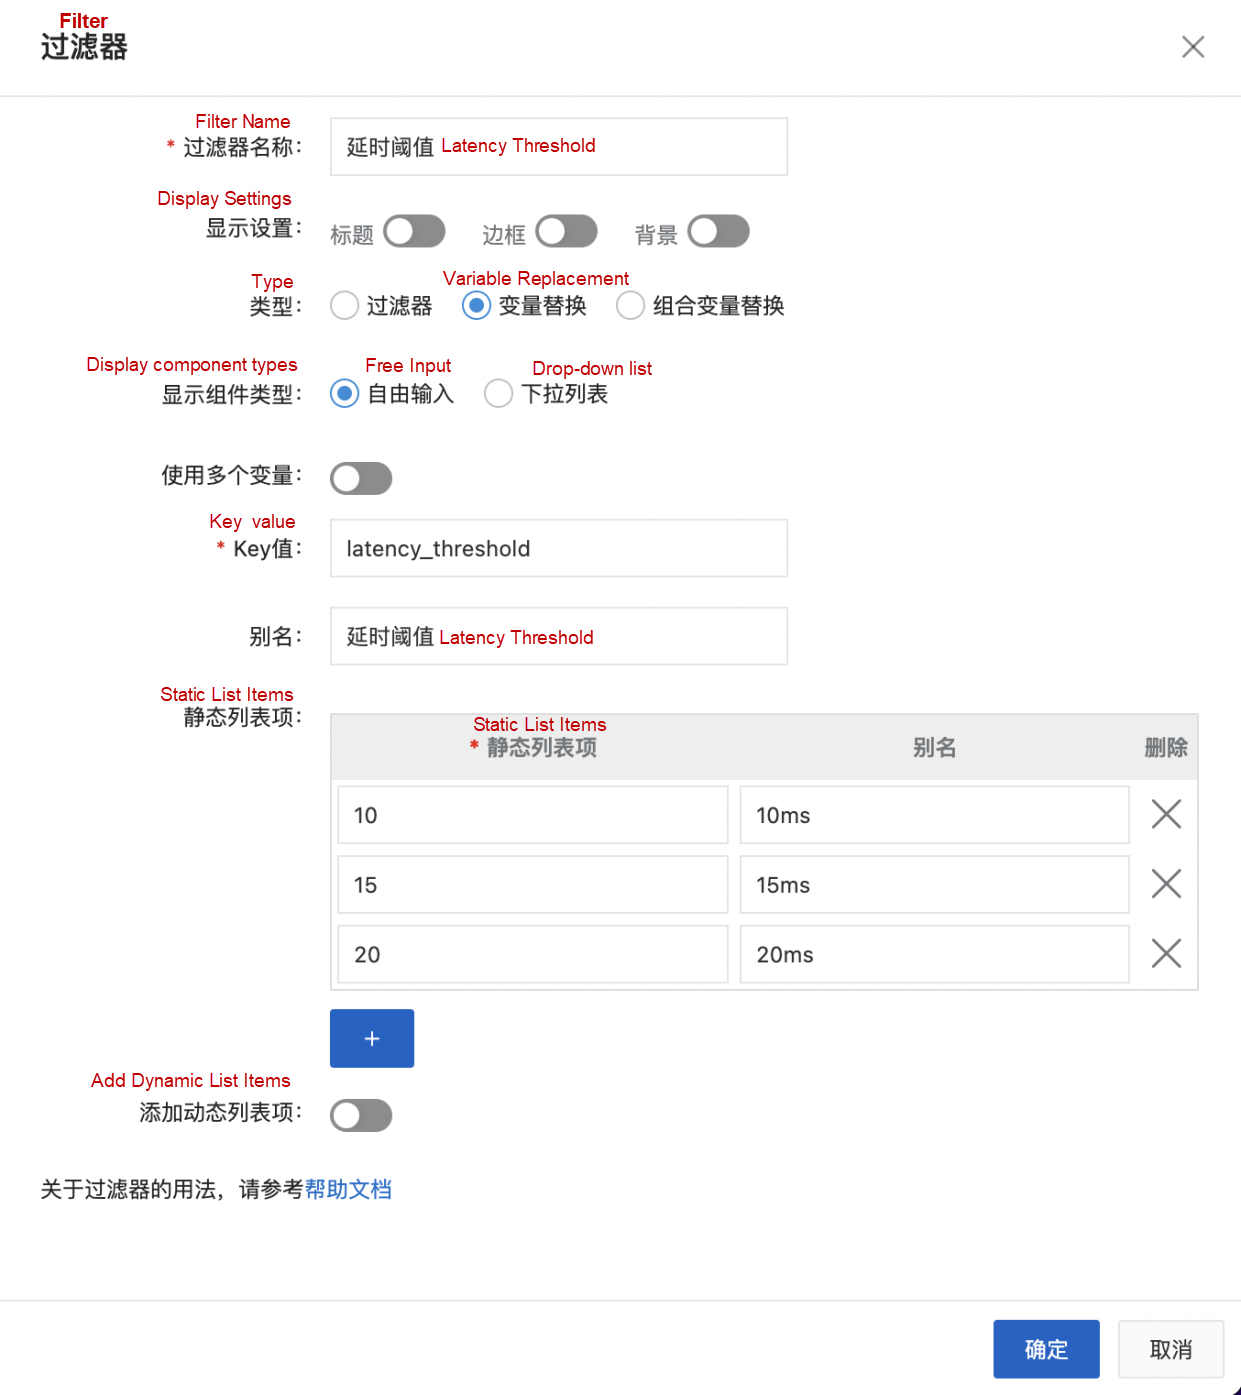
We add a variable replacement named [Delay Threshold], and the corresponding Key value is latency_threshold. At the same time, we add some built-in parameter value sizes to the static list item.

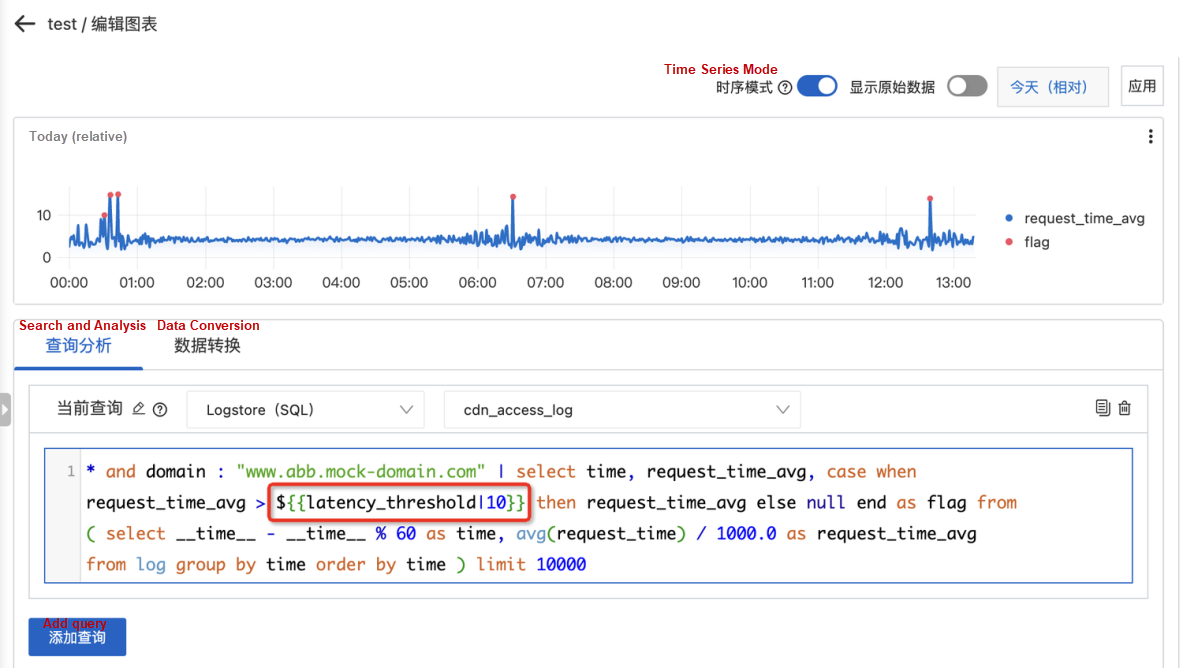
At this point, we modify the Query statement of the time series in the dashboard. Note: The corresponding variable replacement variable is listed below:
${{latency_threshold|10}}

latency_threshold is the variable name, and 10 indicates the default value
*
and domain: "www.abb.mock-domain.com" |
select time,
       request_time_avg,
       case
              when request_time_avg > ${{latency_threshold|10}} then request_time_avg
              else null
       end as flag
from (
              select __time__ - __time__ % 60 as time,
                     avg(request_time) / 1000.0 as request_time_avg
              from log
              group by time
              order by time
       )
limit 10000

After saving, we get the abnormal content in the dashboard and can achieve the results under different filter conditions by modifying [Delay Threshold].
There are two ways to generate outliers in the SLS platform: one is through the machine learning syntax and functions in SLS, and the other is through the Alert OpsCenter.
The basic differences between the two methods:
*
and domain: "www.abb.mock-domain.com" |
select unixtime,
       src,
       predict,
       upper_val,
       lower_val,
       case
              when prob = 0.0 then null
              else src
       end as prob
from (
              select t1 [1] as unixtime,
                     t1 [2] as src,
                     t1 [3] as predict,
                     t1 [4] as upper_val,
                     t1 [5] as lower_val,
                     t1 [6] as prob
              from (
                            select ts_predicate_arma(time, request_time_avg, 10, 1, 1) as res
                            from (
                                          select time,
                                                 request_time_avg
                                          from (
                                                        select __time__ - __time__ % 60 as time,
                                                               avg(request_time) / 1000.0 as request_time_avg
                                                        from log
                                                        group by time
                                                        order by time
                                                 )
                                   )
                     ),
                     unnest(res) as t(t1)
       )
limit 100000
Generate outliers that exceed the threshold upward:
*
and domain: "www.abb.mock-domain.com" |
select unixtime,
       src,
       predict,
       upper_val,
       lower_val,
       case
              when prob > 0.0 and src > upper_val then src
              else null
       end as prob
from (
              select t1 [1] as unixtime,
                     t1 [2] as src,
                     t1 [3] as predict,
                     t1 [4] as upper_val,
                     t1 [5] as lower_val,
                     t1 [6] as prob
              from (
                            select ts_predicate_arma(time, request_time_avg, 10, 1, 1) as res
                            from (
                                          select time,
                                                 request_time_avg
                                          from (
                                                        select __time__ - __time__ % 60 as time,
                                                               avg(request_time) / 1000.0 as request_time_avg
                                                        from log
                                                        group by time
                                                        order by time
                                                 )
                                   )
                     ),
                     unnest(res) as t(t1)
       )
limit 100000
Generate outliers that exceed the threshold downward:
(*
and domain: "www.abb.mock-domain.com")| select unixtime,
       src,
       predict,
       upper_val,
       lower_val,
       case
              when prob > 0.0 and src < lower_val then src
              else null
       end as prob
from (
              select t1 [1] as unixtime,
                     t1 [2] as src,
                     t1 [3] as predict,
                     t1 [4] as upper_val,
                     t1 [5] as lower_val,
                     t1 [6] as prob
              from (
                            select ts_predicate_arma(time, request_time_avg, 10, 1, 1) as res
                            from (
                                          select time,
                                                 request_time_avg
                                          from (
                                                        select __time__ - __time__ % 60 as time,
                                                               avg(request_time) / 1000.0 as request_time_avg
                                                        from log
                                                        group by time
                                                        order by time
                                                 )
                                   )
                     ),
                     unnest(res) as t(t1)
       )
limit 100000
Disclaimer: The views expressed herein are for reference only and don't necessarily represent the official views of Alibaba Cloud.
Data Insight: Landing of Descriptive Data Analysis in Log Scenarios
An In-Depth Understanding of Presto (1): Presto Architecture

1,320 posts | 464 followers
FollowAlibaba Cloud Community - January 8, 2024
weibin - October 17, 2019
Alibaba Clouder - October 21, 2020
Alibaba Cloud Serverless - February 24, 2021
ApsaraDB - October 14, 2021
Alibaba Cloud Native Community - May 13, 2024

1,320 posts | 464 followers
Follow Simple Log Service
An all-in-one service for log-type data
Learn More Storage Capacity Unit
Plan and optimize your storage budget with flexible storage services
Learn More Hybrid Cloud Storage
A cost-effective, efficient and easy-to-manage hybrid cloud storage solution.
Learn More Hybrid Cloud Distributed Storage
Provides scalable, distributed, and high-performance block storage and object storage services in a software-defined manner.
Learn MoreMore Posts by Alibaba Cloud Community