By Hui Yao
In 2018, observability was introduced to the IT field and gradually replaced the traditional monitoring that only focused on the overall availability of systems. With the development of cloud-native technology, enterprises have developed from monolithic architecture to distributed architecture. They use containers to deploy a large number of split microservices, which are closely related to businesses. Traditional monitoring is only suitable for reporting the overall operation of the system and cannot conduct highly detailed analysis and correlation. Therefore, it is necessary to integrate the R&D perspective into monitoring to develop a broader, more proactive, and finer-grained capability than the original monitoring. This ability is observability.
The construction plan of Dubbo 3 includes cloud migration. Observability is an essential capability for cloud migration. Observability is required for application scenarios (such as instance availability load balancing, Kubernetes Auto Scaling, and instance health model establishment).
Currently, the observability of Dubbo 3 is under construction. This article mainly introduces the basic knowledge and progress of the Metrics module.
APM refers to application performance management. It is mainly used to manage and monitor the performance and availability of software systems. It can ensure the quality of online services, which is an important service governance tool.
If divided from the system function, the APM system can be divided into three subsystems: Metrics, Tracing, and Logging.
Metrics (also known as metric monitoring) is mainly responsible for processing some structured metric data that can be aggregated.
Tracing (also known as tracing analysis) focuses on information processing around a single request. Then, all data is bound to a single request or a single transaction of the system.
Logging is used to monitor unstructured events.


Metrics consists of four parts. The first is the name. The second is labels or tags, which are some dimension data that can be used for filtering or aggregation queries. The third is the timestamp, which is its time field. The fourth is the value of a specific metric.
In addition to the four parts, there is an important field that is not reflected in the data model, the metric type of this data. Different types of metrics are used in different monitoring scenarios, and some of their query and visualization methods are different.
The following is a brief introduction to some commonly used metric types.
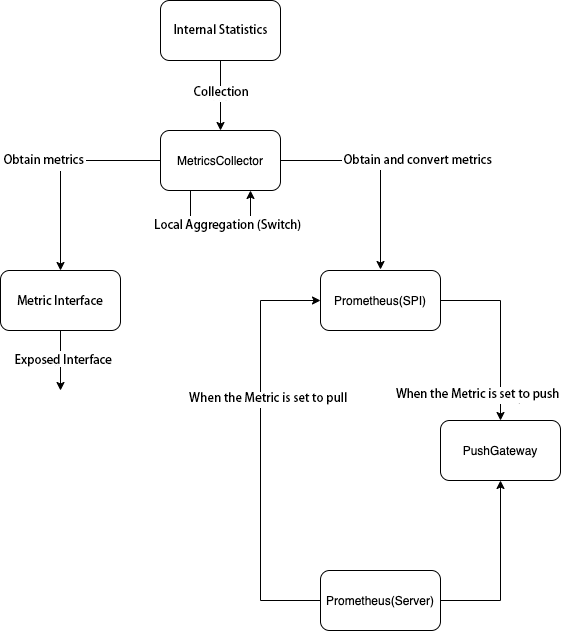
Dubbo's metric system involves three modules: metric collection, local aggregation, and metric push.
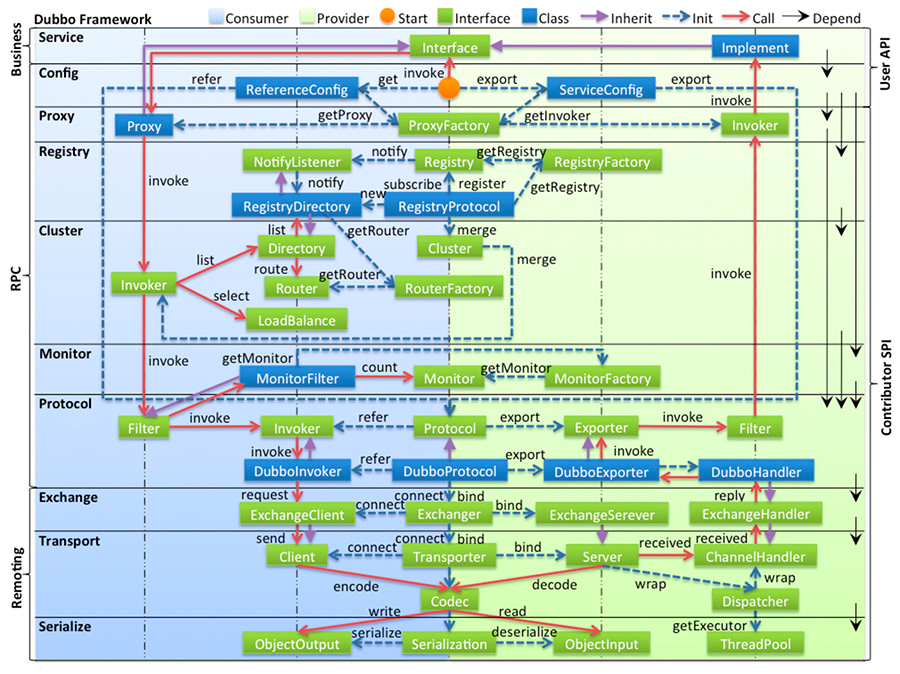
The purpose of metric collection is to store the running status of microservices, which is equivalent to taking a snapshot of microservices and providing basic data for further analysis (such as metric aggregation).
The preceding figure shows the architecture of Dubbo. In this scenario, the tracking point or cut-in position for metric collection is to add Filter to the provider in SPI mode.
Some code is pasted here to show the logic of metric collection.
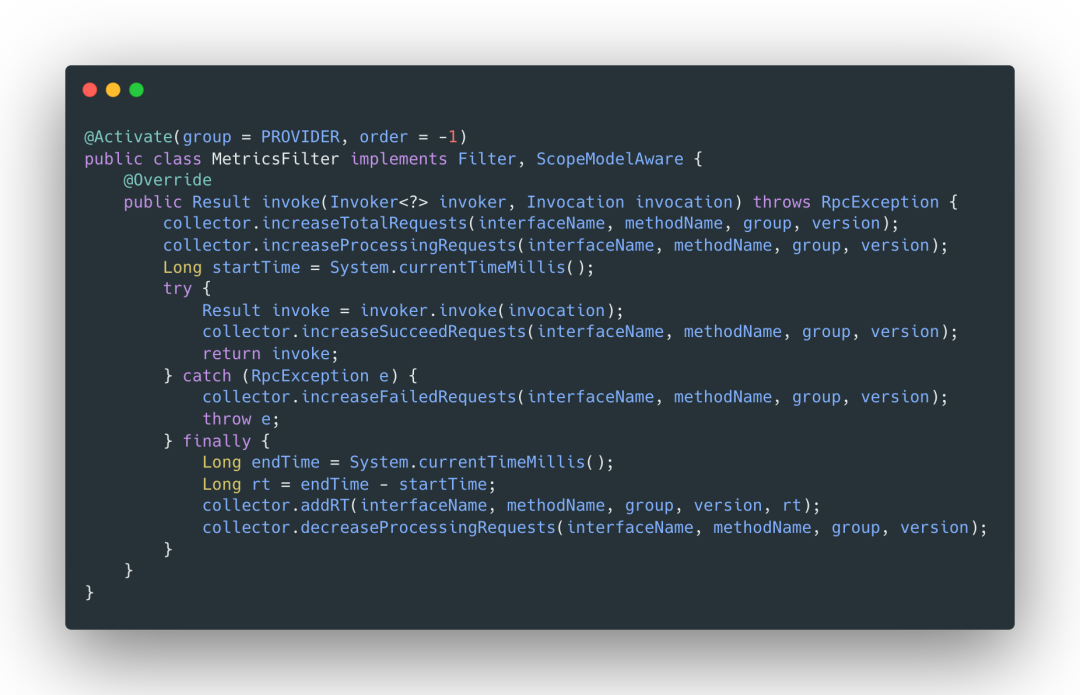
We use the information of the four dimensions of interfaceName, methodName, group, and version as the key to the map storage structure. The information on these four dimensions will be converted into labels or tags of the previous metrics storage structure when the metrics are exported.
The next one is a member variable of our default memory.
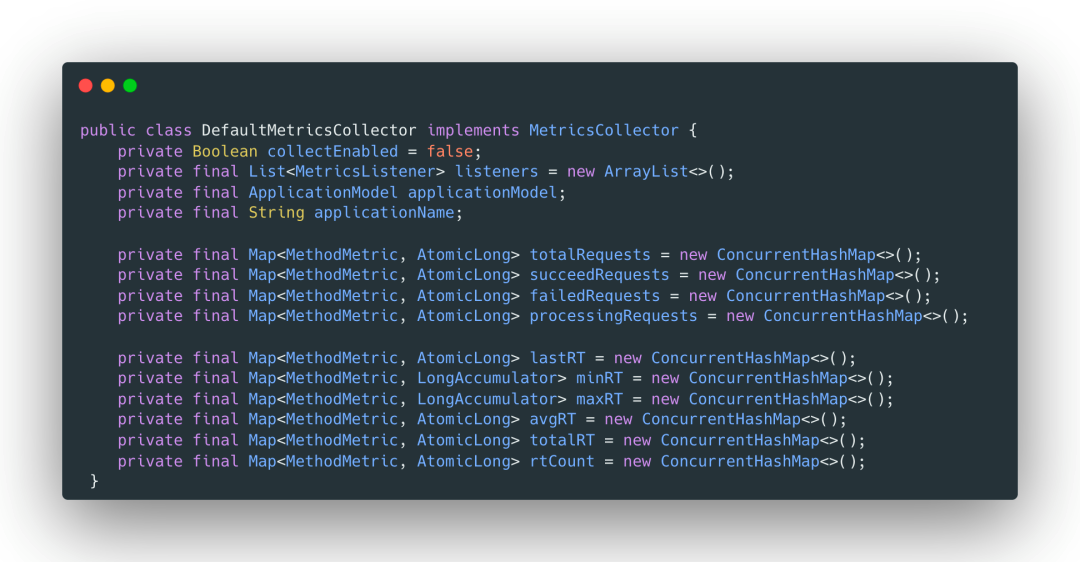
The ConcurrentHashMap of the segmented lock structure is used to ensure concurrency, in which MethodMetric is a class composed of the four dimensions of information mentioned before.
One of the more important structures is the MetricsListener list, which is a producer-consumer mode because the default collector is accessed by default. However, if other metrics need to be collected, we need to continue to add listeners here to let other collectors monitor the status of the default collector. When the default collector collects the value, it pushes an event to the listener list. As such, other collectors can collect meta-information and process it further. This is also a logic of local aggregation implementation. Specific details can be seen in the code of Dubbo 3.1.
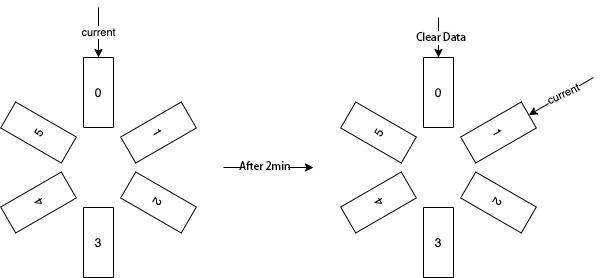
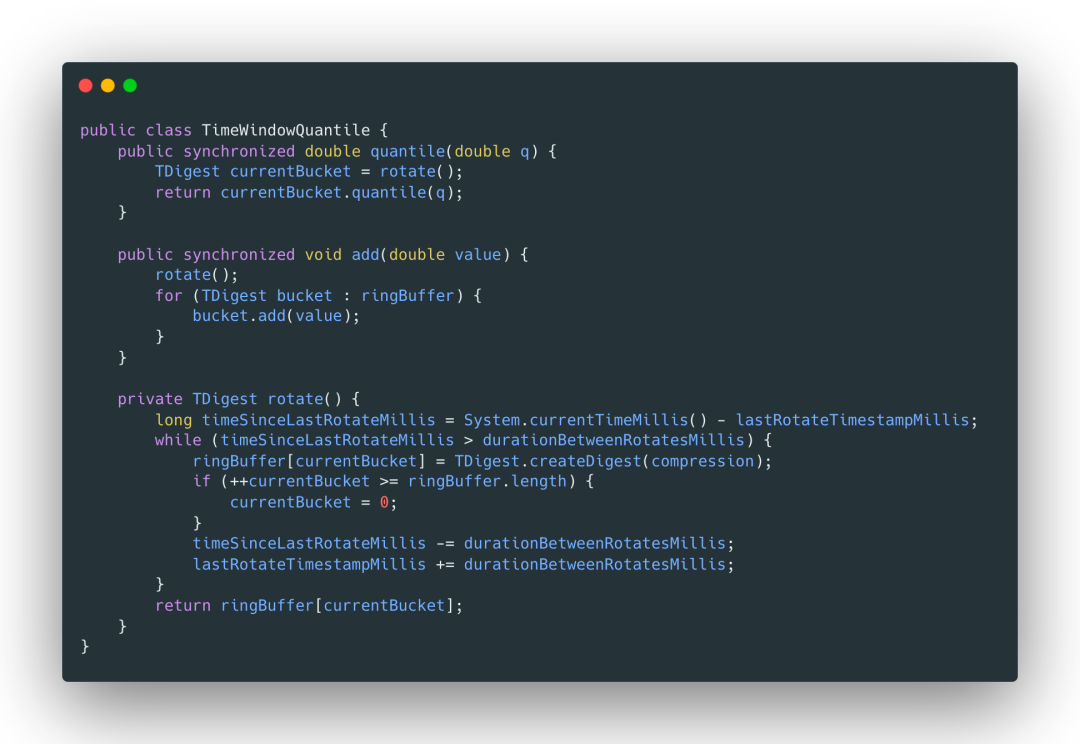
Local aggregation mainly uses sliding windows and TDigest. The principle of sliding windows is shown in the figure. Let’s assume that we initially have six buckets, and each window time (the stay time of a bucket under the current pointer) is set to two minutes. Each time metric data is written, data will be written into six buckets respectively, which means one data will be written six times. We will move a bucket every two minutes and clear the data in the original bucket. When reading metrics, we will read the metric data in the bucket pointed to by the current at that time to achieve the effect of the sliding window.
The function of the sliding window is to aggregate recent data, so the bucket we point to each time stores metric data from the current time to the past bucket lifecycle (the time interval [now -bucketLiveTime * bucketNum, now ]). The lifecycle of a bucket is controlled by the window time and the number of buckets. You can customize this parameter.
The following is an introduction to the processing of Dubbo quantile metrics. We often say that metrics (such as p99 and p95) are quantile metrics. p99 refers to the 99th value of response latency among 100 requests, which can better reflect the availability of service and is called the golden metric.
Dubbo uses the TDigest algorithm to calculate quantile metrics. TDigest is a simple, fast, accurate, and parallelizable algorithm approximates to percentile.
The idea used by TDigest is that Sketch, which is commonly used by approximation algorithms, uses a part of the data to depict the characteristics of the overall data set. It is just like a sketch. Although there is a gap with the real object, it looks similar to the real object and can show its characteristics.

Here's how TDigest works. If there are 500 numbers between -30 and 30, you can use the probability density function, which is the PDF function, to represent this data set.

The y-value of a point on the function is the probability of its x-value occurring in the overall dataset. The area of the entire function adds up to exactly 1, which can be said to depict the distribution of the data in the dataset, namely normal distribution.
With the PDF function corresponding to the dataset, the percentile of the dataset can be represented by the area of the PDF function. As shown in the figure below, the percentile P75 is the x-coordinate corresponding to the area when it accounts for 75%.

The points in the PDF function curve correspond to the data in the dataset. When the amount of data is small, we can use all the points of the dataset to calculate the function. When the amount of data is large, only a small amount of data is used to replace all the data in the dataset.
Here, the data set needs to be grouped, the adjacent data is divided into a group, and the number of this group is replaced by the average sum. These two numbers are collectively called centroid numbers. Then, it is used to calculate the PDF, which is the core idea of the TDigest algorithm.
As shown in the following figure, the average value of the centroid number is taken as the x value, and the number is taken as the y value. The PDF function of this dataset can be roughly drawn by this set of centroid numbers.

The calculation of the percentile only needs to find the centroid number of the corresponding position from these centroid numbers. Its average is the percentile value.
The larger the number of centroids means the more data it represents, the greater the loss of information, and the less accurate it is. As shown in this figure, a too large centroid number loses too much accuracy, while a too small centroid number consumes more resources (such as memory), failing to achieve the effect of a high real-time approximation algorithm.
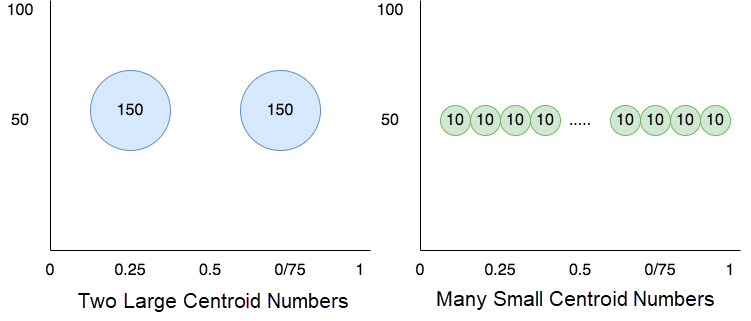
Therefore, TDigest controls the amount of data represented by each centroid number according to the percentile based on the compression ratio. The centroid number on both sides is smaller and more accurate, while the middle one is larger, thus achieving a more accurate effect of P1 or P99 than P20.
Metric push is used to store, compute, and visualize metrics provided by Dubbo. Currently, third-party servers only support Prometheus. CNCF made Prometheus open-source for application monitoring. It mainly consists of three modules: obtaining data, storing data, and querying data.
There are two ways to obtain data: Pull and Push, which are also Dubbo accessing methods. The time series database used by Prometheus to store data is not described here. Data query is a set of custom query IDL that can be connected to an alert system (such as Grafana). When the monitoring metrics are abnormal, you can use email or call.
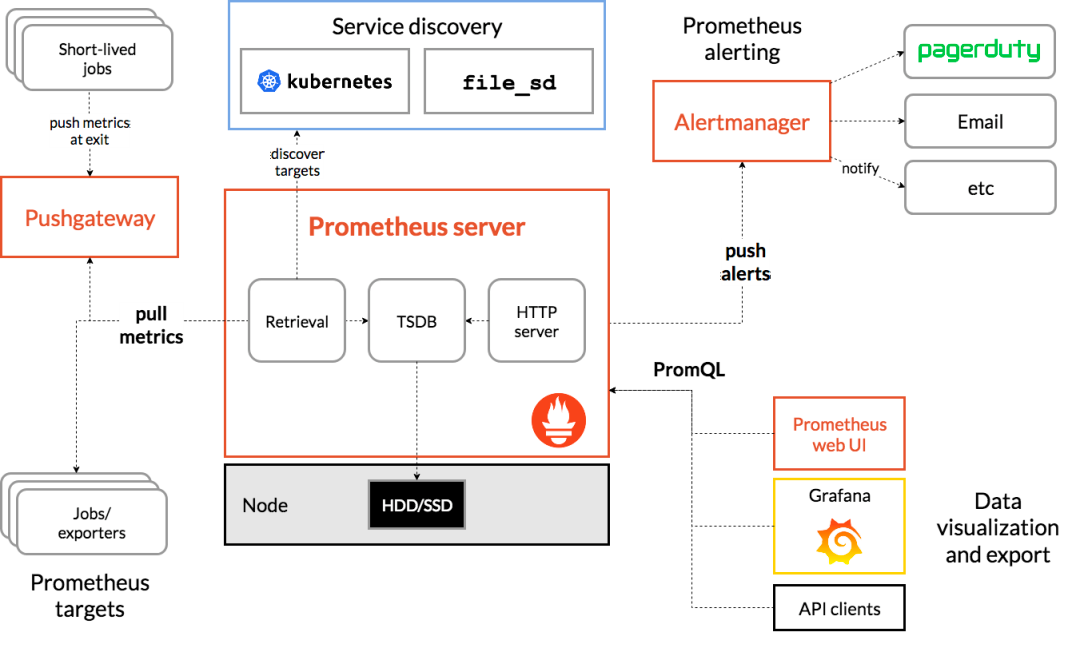
Metric push is only enabled after the user has set the configuration and configured the protocol parameter. If only metric aggregation is enabled, metrics are not pushed by default.
The interval represents the push interval.
The Dubbo Metrics feature is expected to be released in versions 3.1.2 and 3.1.3.
The observability of Dubbo 3 is an essential part of the cloud migration of Dubbo 3. Dubbo 3 has been enhanced in all aspects of the target commercial product Microservice Engine, which enhances its services in a non-intrusive manner and enables it to have complete microservice governance capabilities.
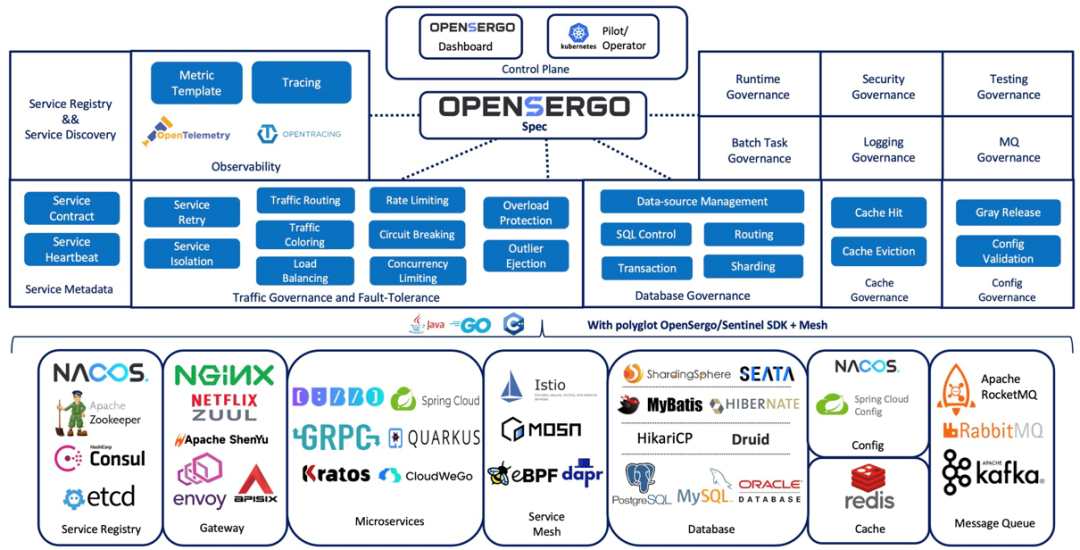
While building Dubbo observability, we are building a complete service governance system for Dubbo 3 based on the OpenSergo standard.
Koordinator V1.2.0 Supports Node Resource Reservation and Is Compatible with the Rescheduling Policy

510 posts | 49 followers
FollowAlibaba Cloud Native Community - September 12, 2023
Alibaba Cloud Native Community - July 20, 2023
Alibaba Cloud Native Community - December 19, 2023
Alibaba Cloud Native Community - January 26, 2024
Alibaba Cloud Native Community - January 26, 2024
Alibaba Cloud Native Community - March 20, 2023

510 posts | 49 followers
Follow Cloud-Native Applications Management Solution
Accelerate and secure the development, deployment, and management of containerized applications cost-effectively.
Learn More Managed Service for OpenTelemetry
Allows developers to quickly identify root causes and analyze performance bottlenecks for distributed applications.
Learn More Function Compute
Alibaba Cloud Function Compute is a fully-managed event-driven compute service. It allows you to focus on writing and uploading code without the need to manage infrastructure such as servers.
Learn More Lindorm
Lindorm is an elastic cloud-native database service that supports multiple data models. It is capable of processing various types of data and is compatible with multiple database engine, such as Apache HBase®, Apache Cassandra®, and OpenTSDB.
Learn MoreMore Posts by Alibaba Cloud Native Community