By Heqing Jiang, Alibaba Cloud R&D Engineer and Apache Dubbo PMC
With the rise of cloud-native, more and more applications are being deployed based on Kubernetes, leading to the emergence of related tools such as DevOps. Dubbo, as the mainstream solution for microservice architecture, presents a challenge for developers and architects on how to develop and manage microservices for Kubernetes deployment. This article provides a detailed analysis from various perspectives including development, deployment, monitoring, and operations on how to build efficient and reliable microservice applications based on Dubbo in the Kubernetes ecosystem.
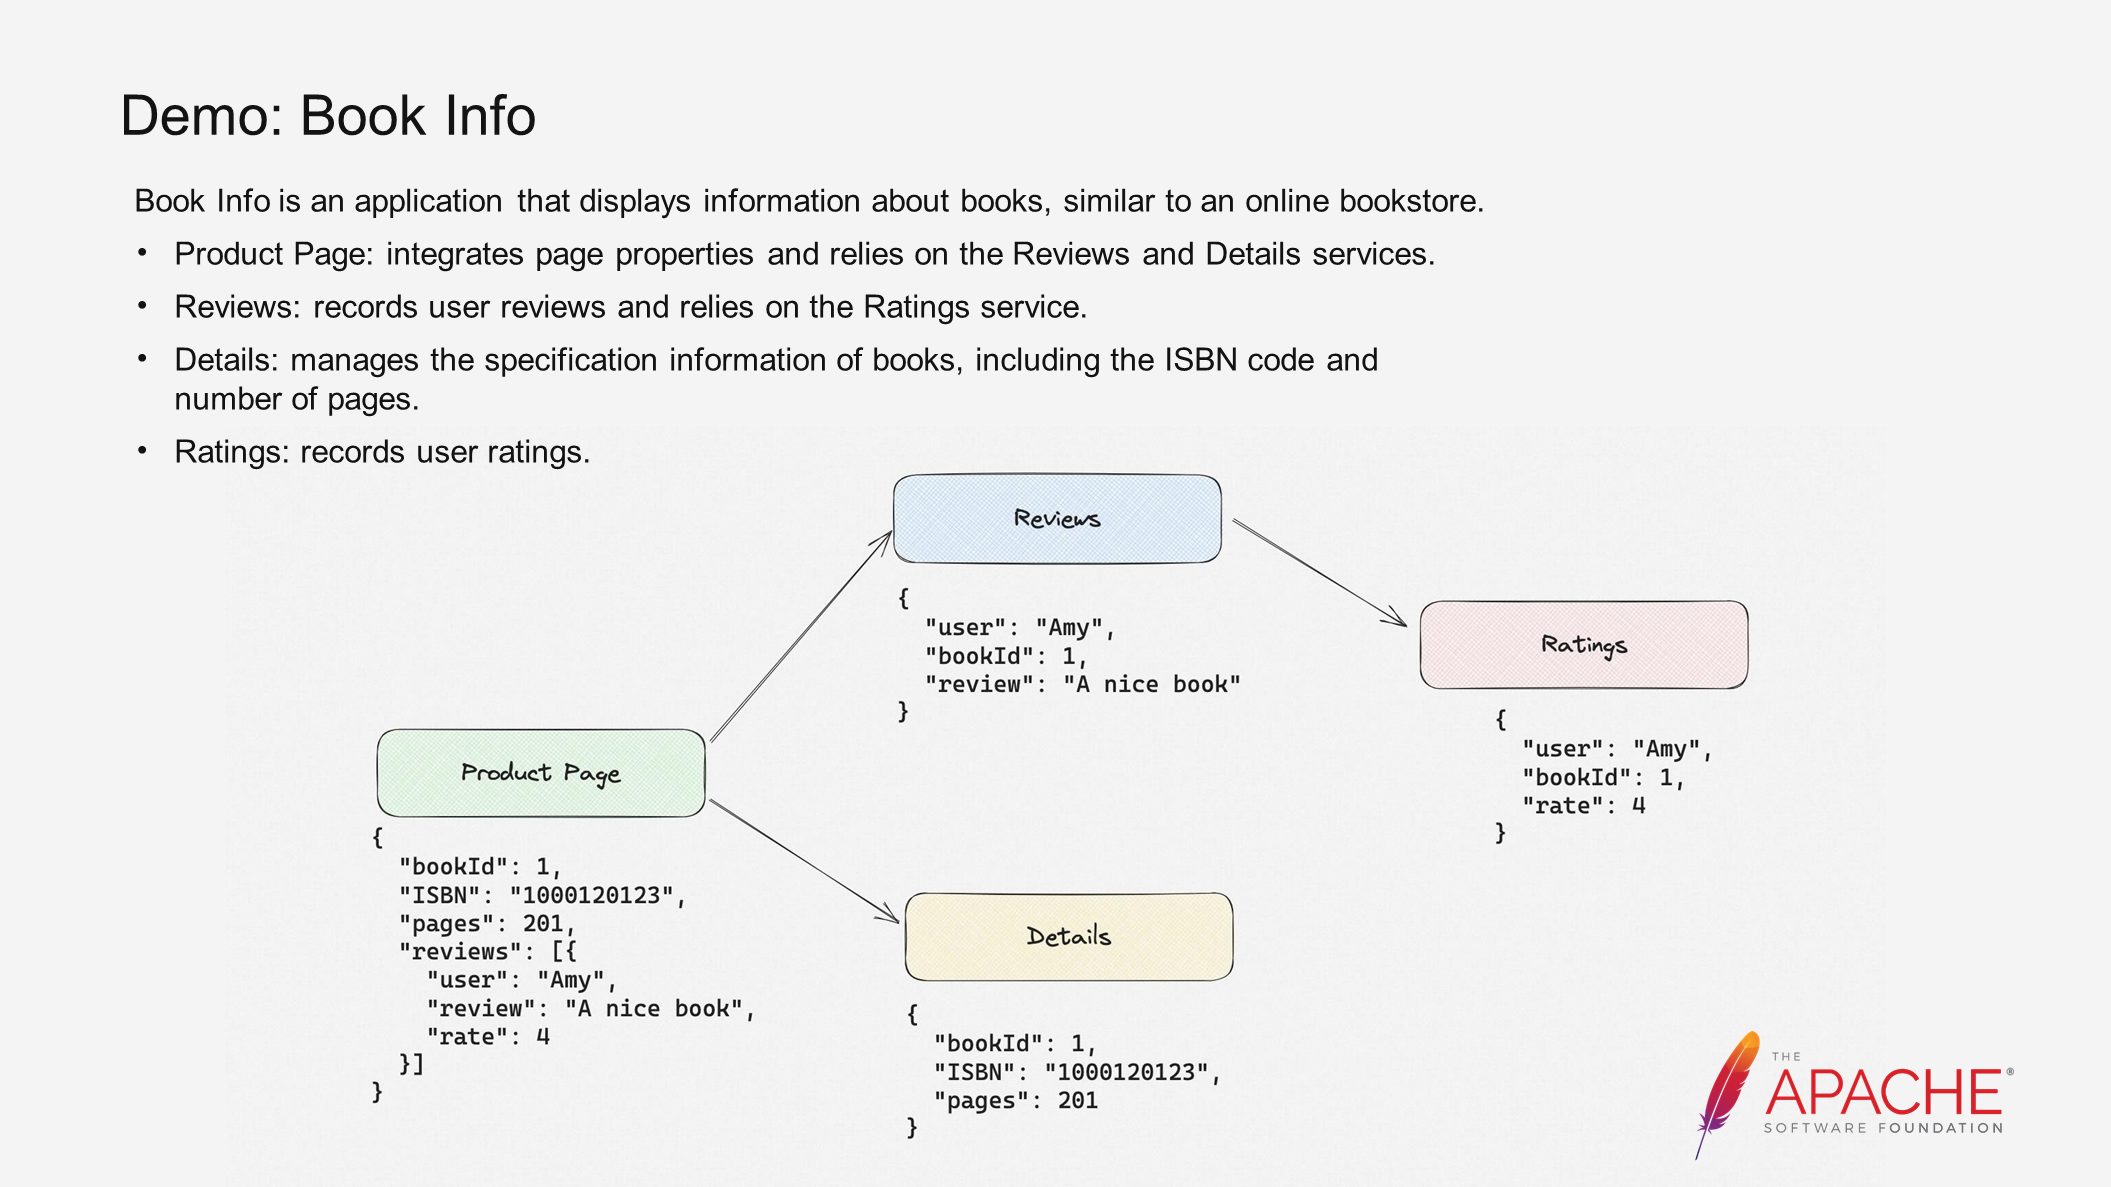
The above figure illustrates a demo project used in this article. It is based on the book info sample project from Istio and consists of four applications. The Product Page integrates the attributes of the page and exposes information through an HTTP interface. Reviews, Details, and Ratings are responsible for specific modules such as evaluation, rules, and scoring.
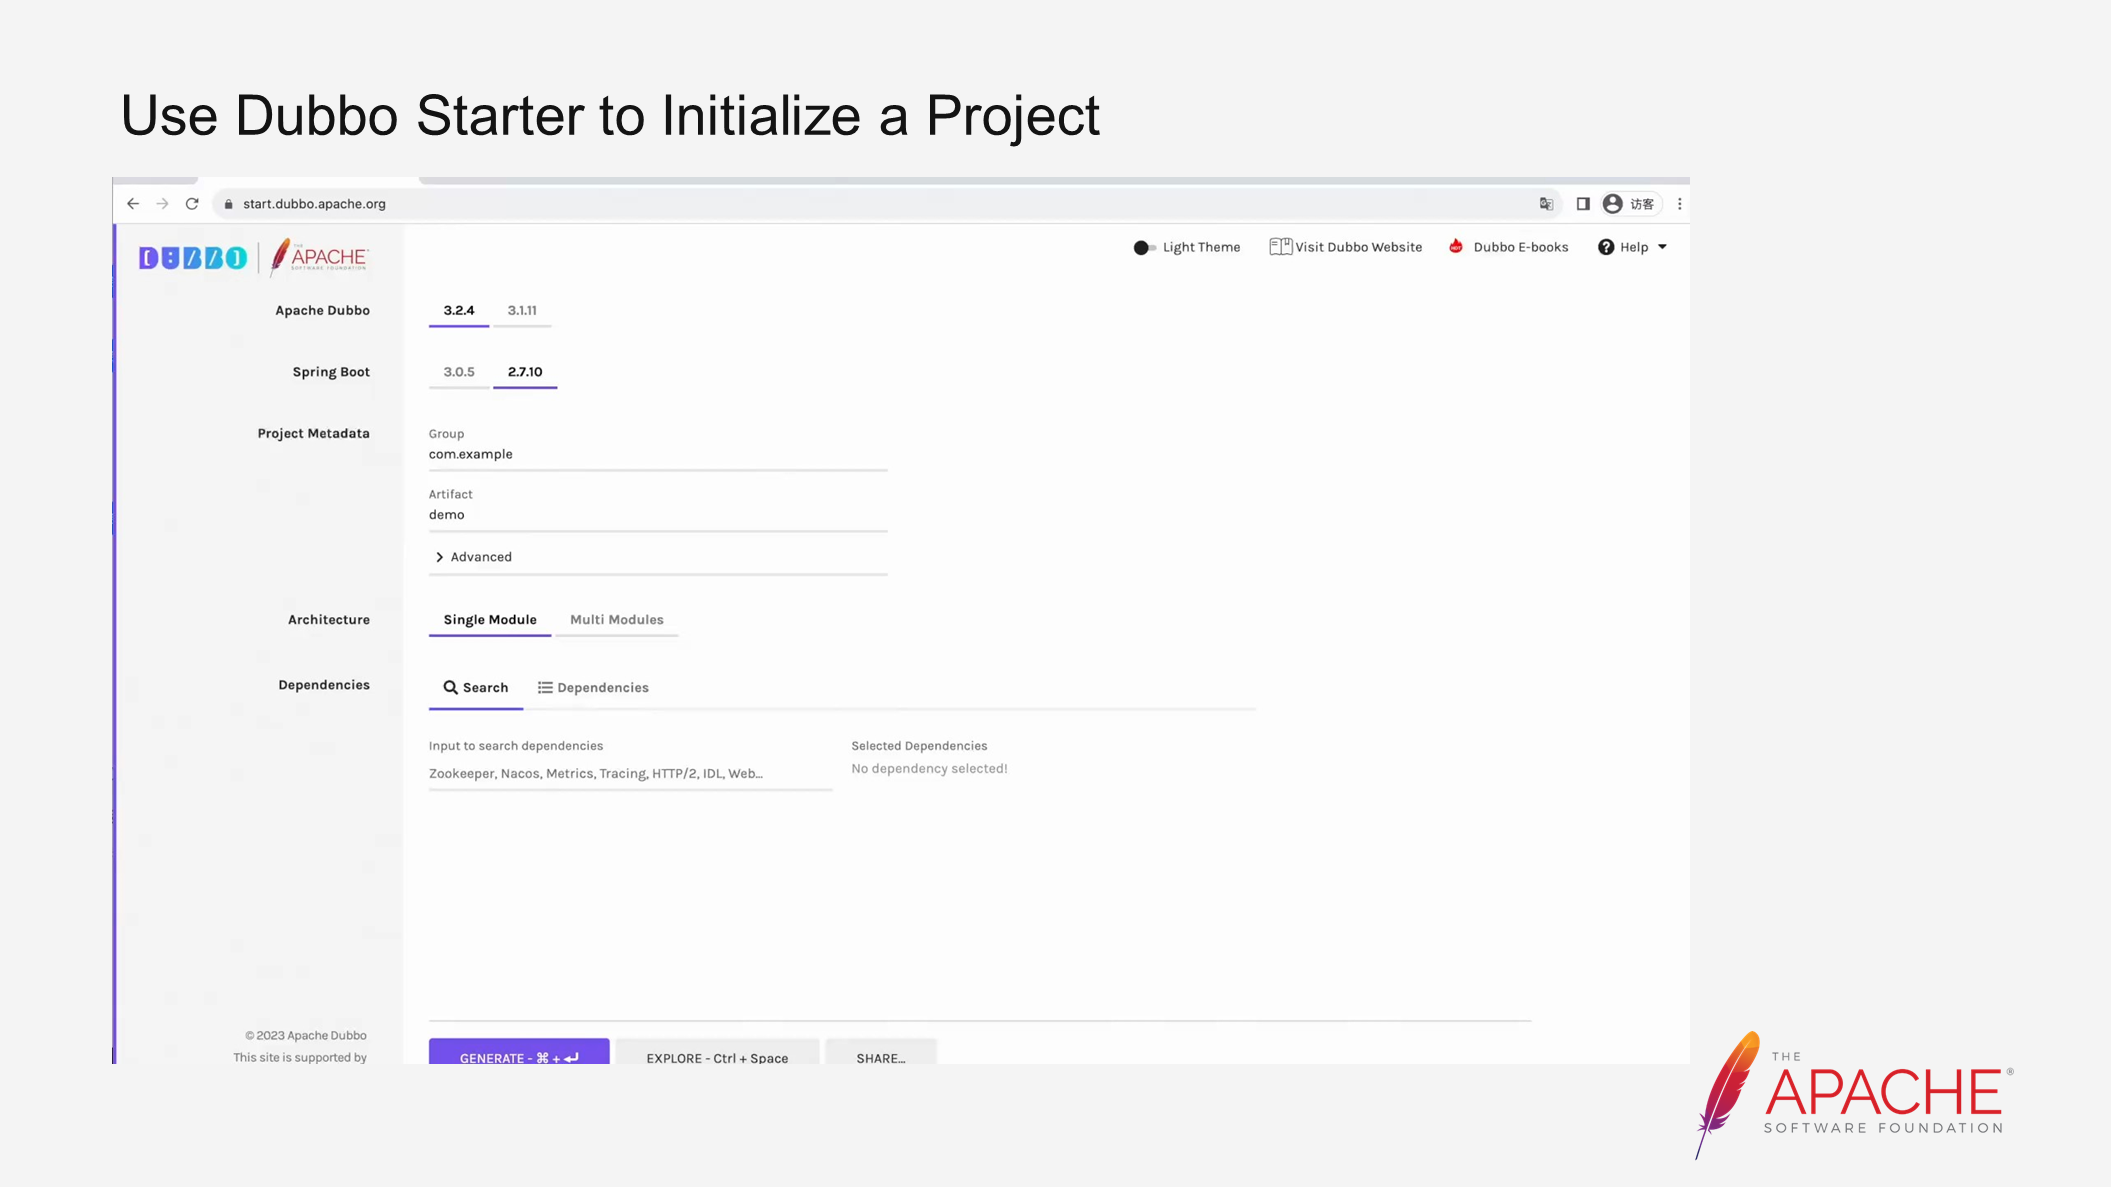
For many developers in the Java system, creating a new application usually involves creating a new project using an IDE or using a Maven template or Spring-based Initializer. In the figure above, we created our own initialization project based on Spring's initializer. You can access this page directly by clicking on the provided website. You need to enter the corresponding group and artifact, and then select the components you want to use, such as Nacos and Prometheus components.
Additionally, we provide a Dubbo plugin in the IDE. You can install this plugin as shown in the figure above. If Dubbo configurations are already used in your repository, it will prompt you to install the plugin directly. Once installed, you will have an initialized project on the right side.
The figure above provides an example of creating a Dubbo project. You need to select the required component information and click Create. This will create a brand new project locally, on which you can start development.
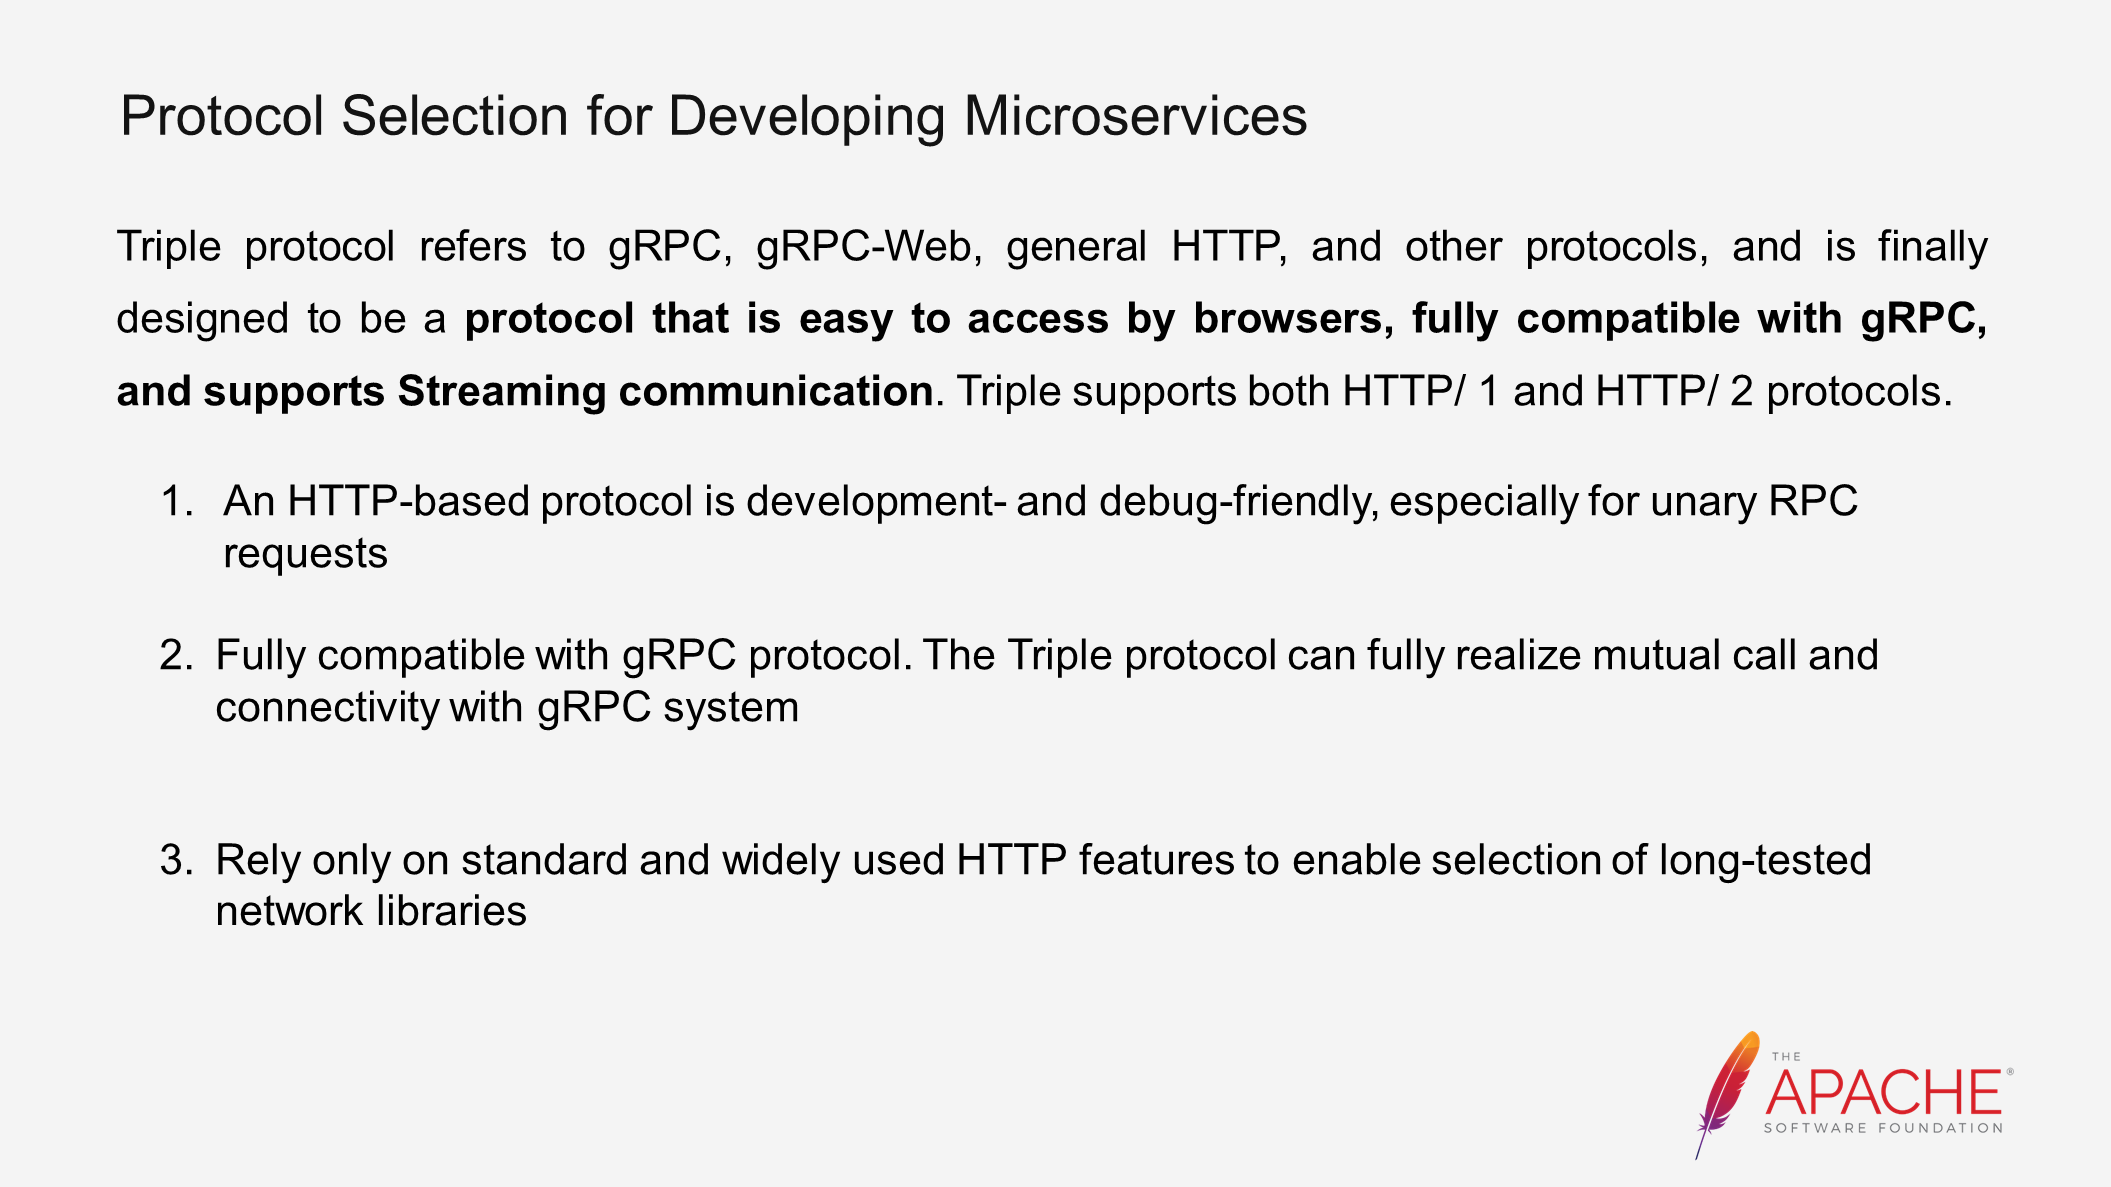
After the application is initialized, the next step is to develop services. In this case, we will focus on the protocol selection, which is closely related to Dubbo.
Dubbo's Triple protocol is designed to be easily accessible for browsers and fully supports gRPC. This protocol achieves protocol unification from the frontend clusters to the backend clusters.
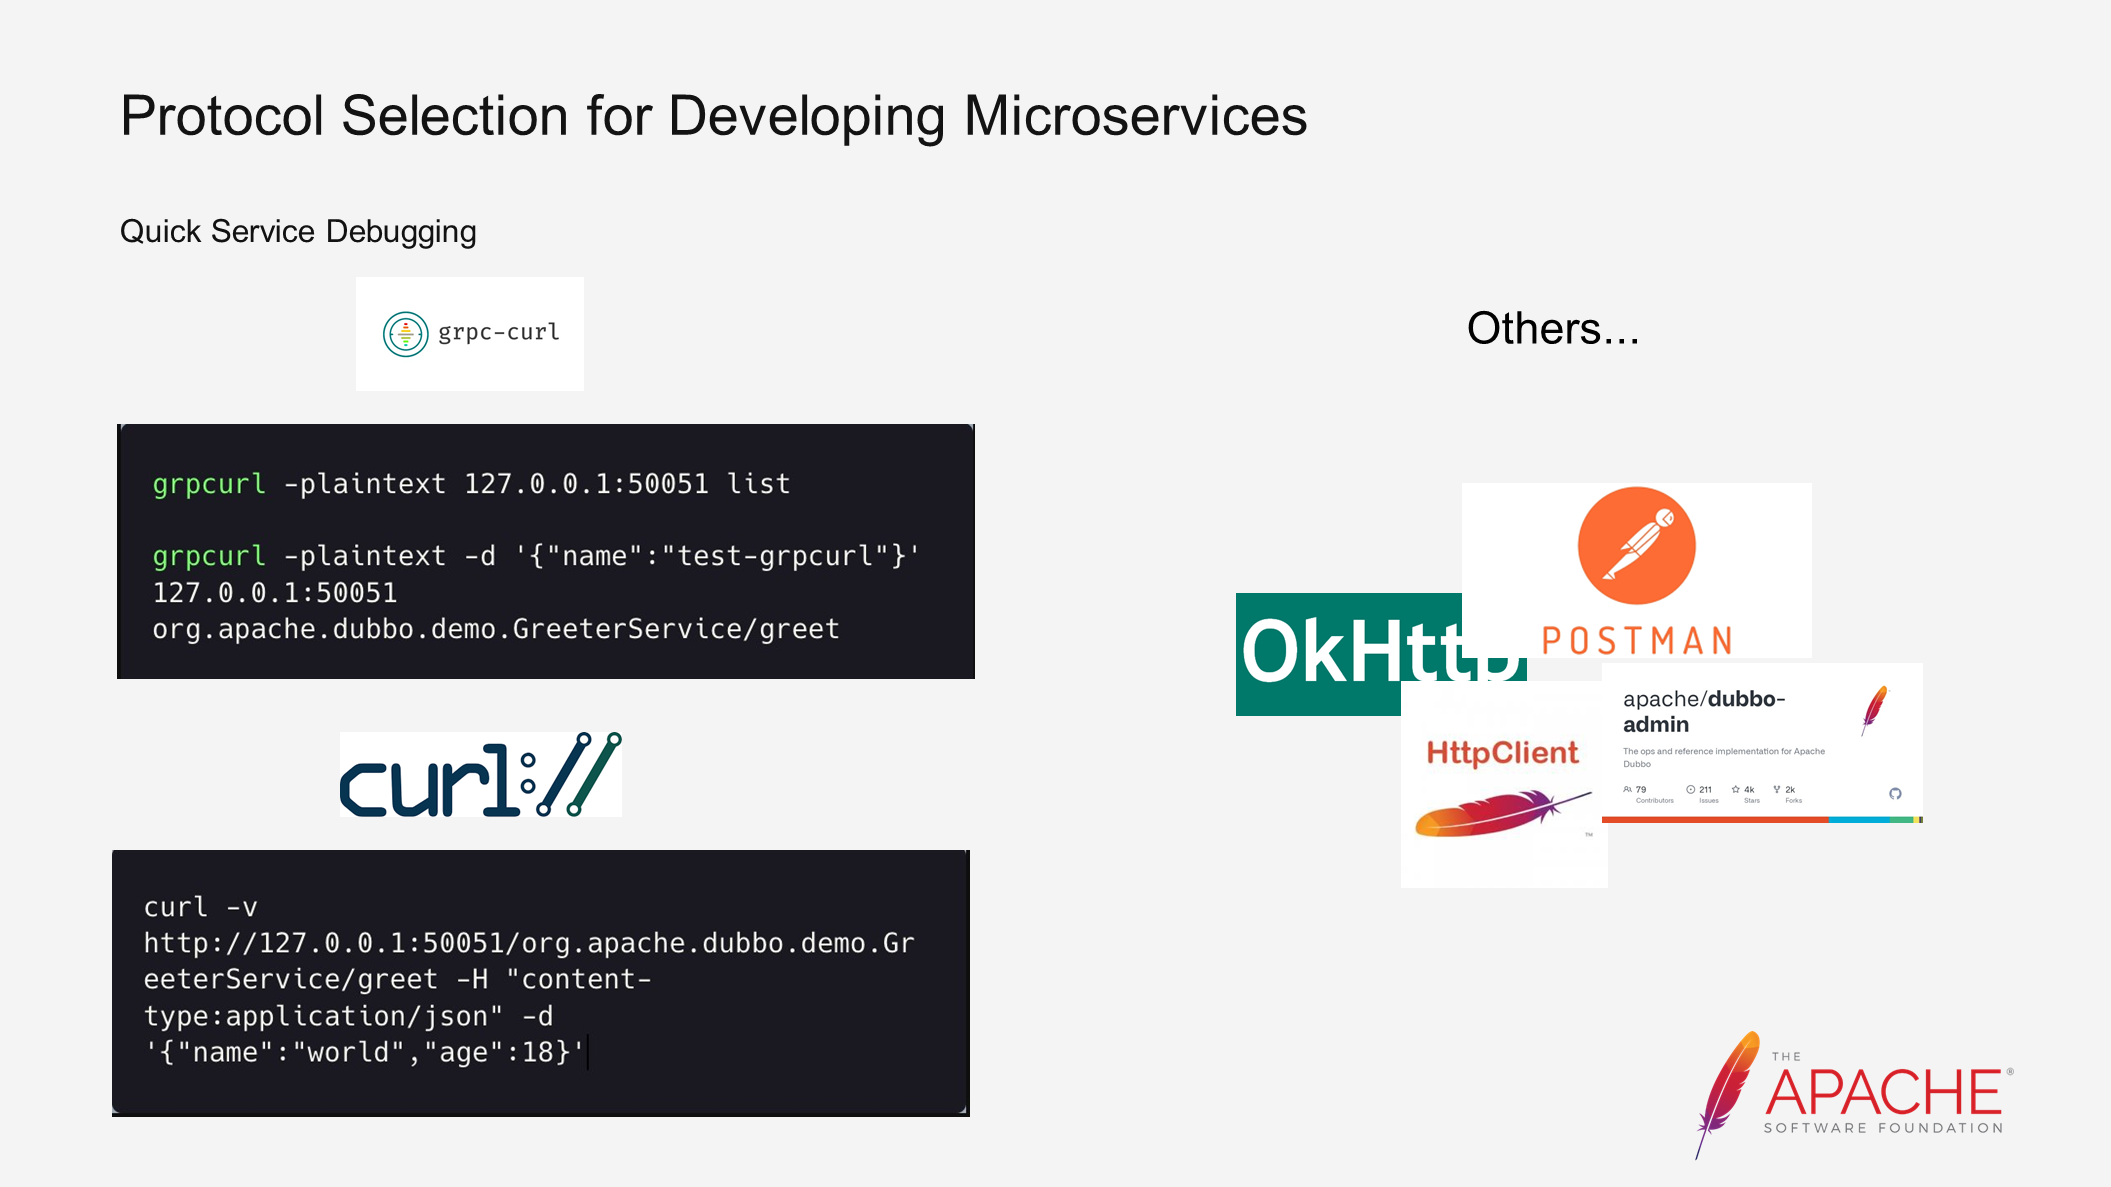
Let's take a look at our project. This is the project we just established. I am now starting the application and configuring some registry addresses. This follows the standard Spring startup process. Here, we define an interface that returns the content information of a "hello". Then, using a simple command, we can directly return the result of our hello world. This is very helpful for testing purposes, as we can directly test the interface after local startup.
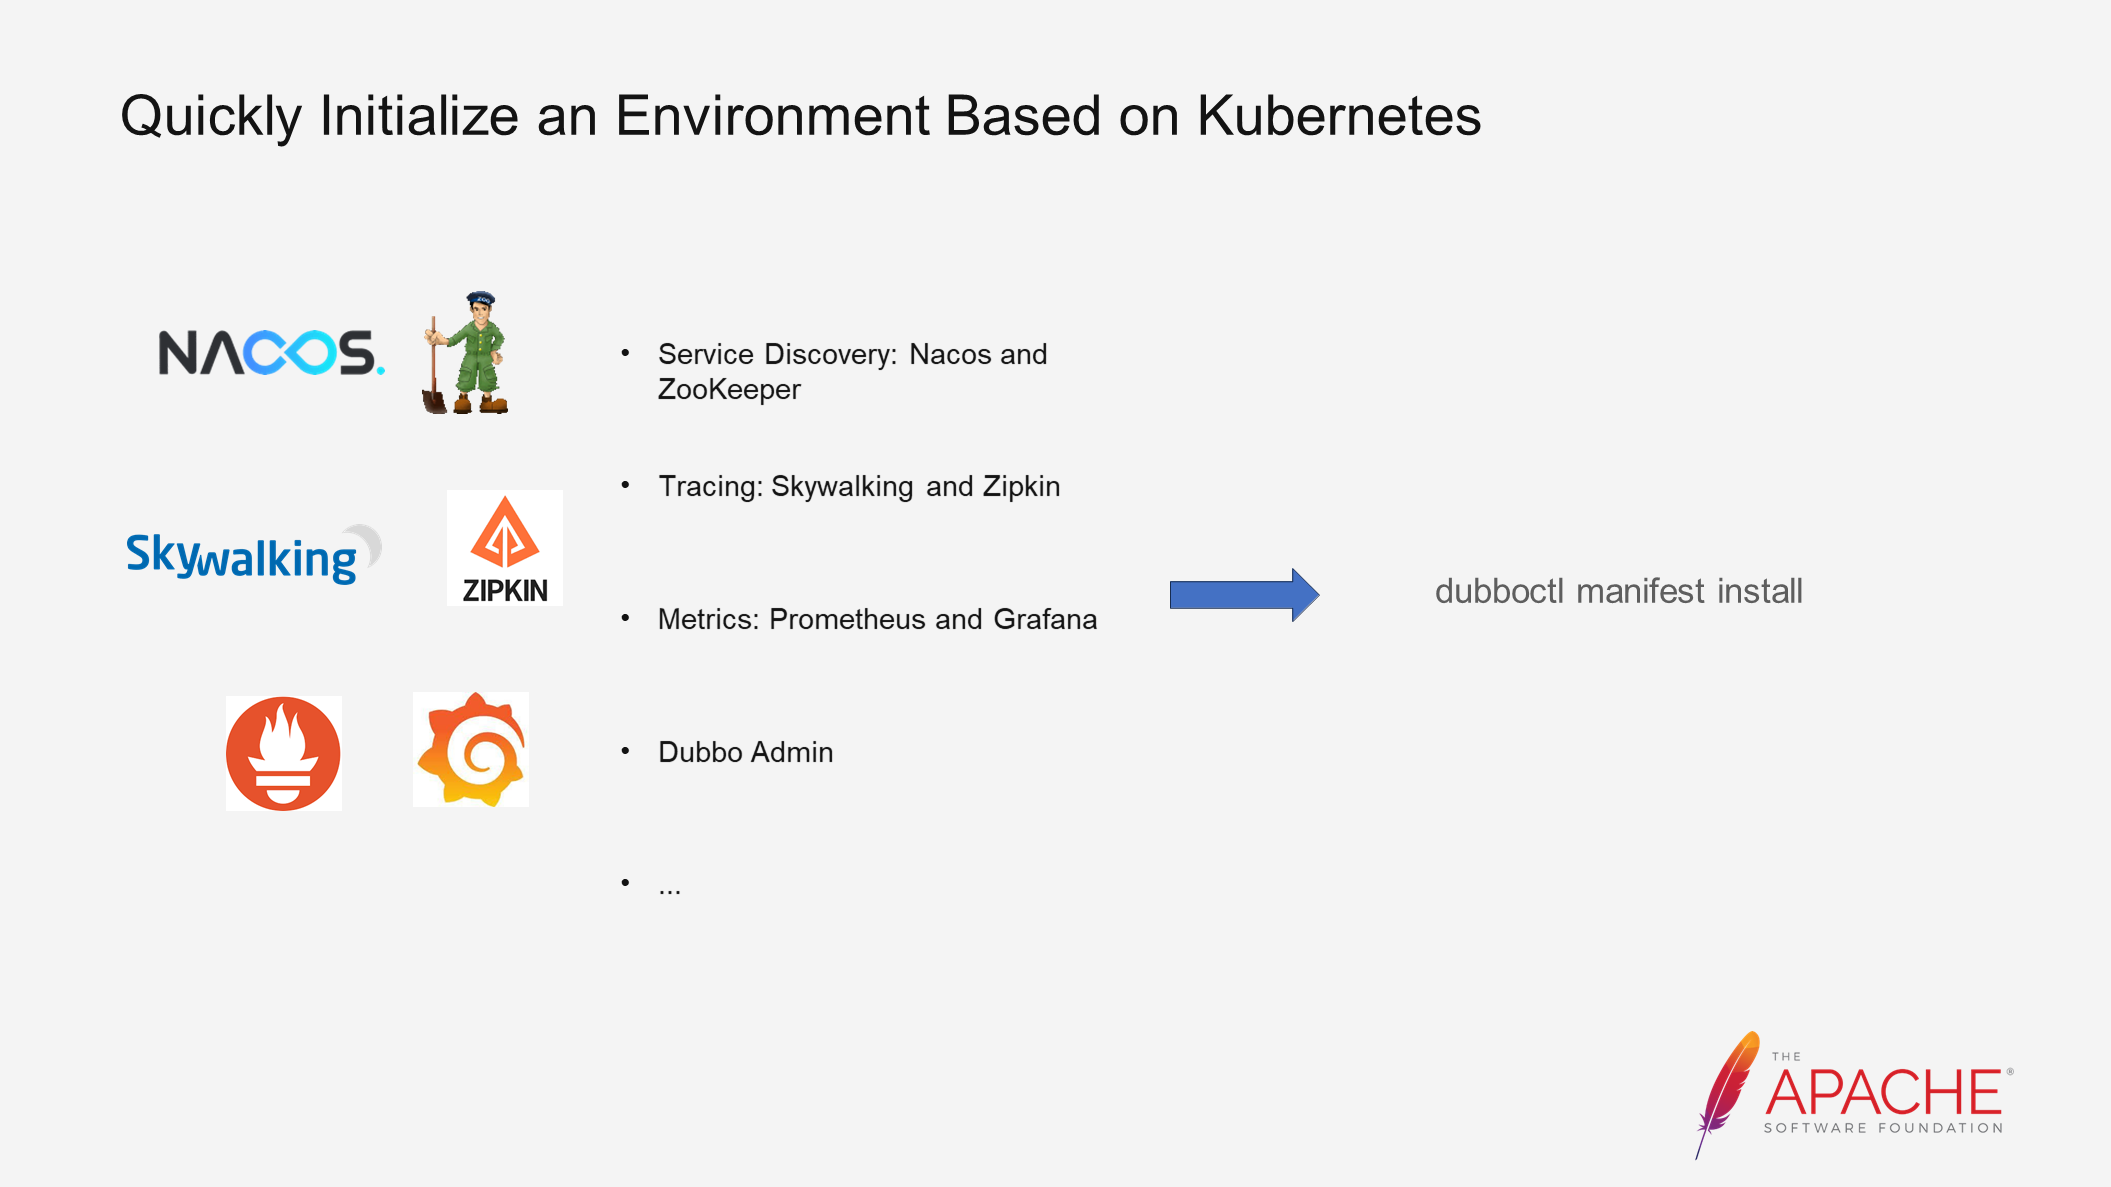
When deploying a microservice application in a new environment, there is a need to pre-deploy components such as the registry, configuration center, and observability. This process can be time-consuming and labor-intensive, both in terms of the number of components and the complexity of deploying a single component. To address this, Dubbo provides a tool to quickly set up the environment. By clicking on dubboctl manifest install once, several components mentioned above can be deployed in the Kubernetes environment, significantly reducing the overall deployment difficulty.
Here is a simple example. After pulling up the environment, all the components will be automatically set up. We will continue to use Prometheus here. The addresses of Nacos and ZooKeeper will be provided directly to you.
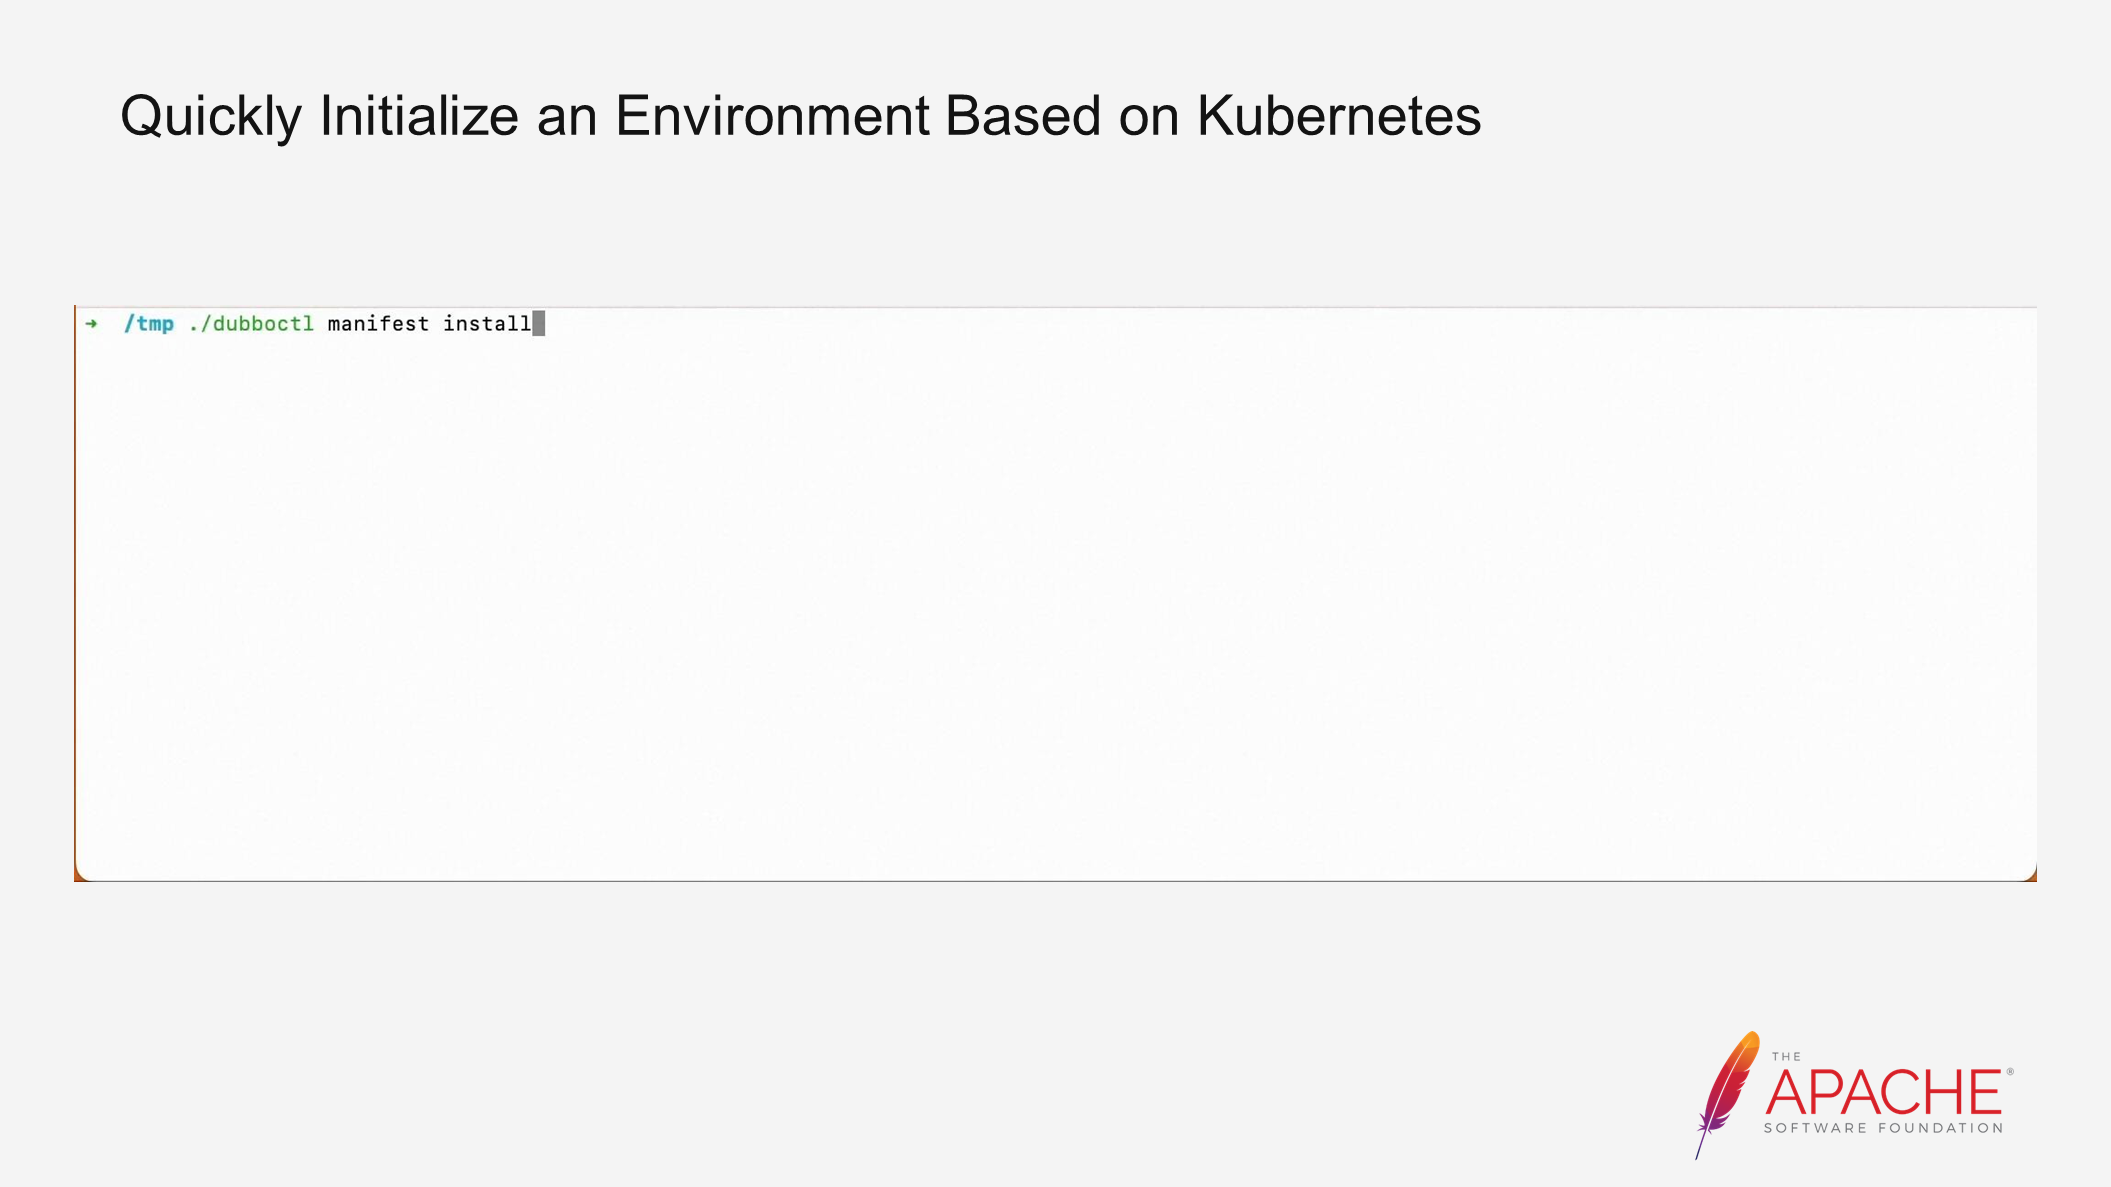
This is also an example. By running a simple command, the local Kubernetes configuration will be ready, automatically creating all the necessary components. This allows us to deploy all services with just one click.
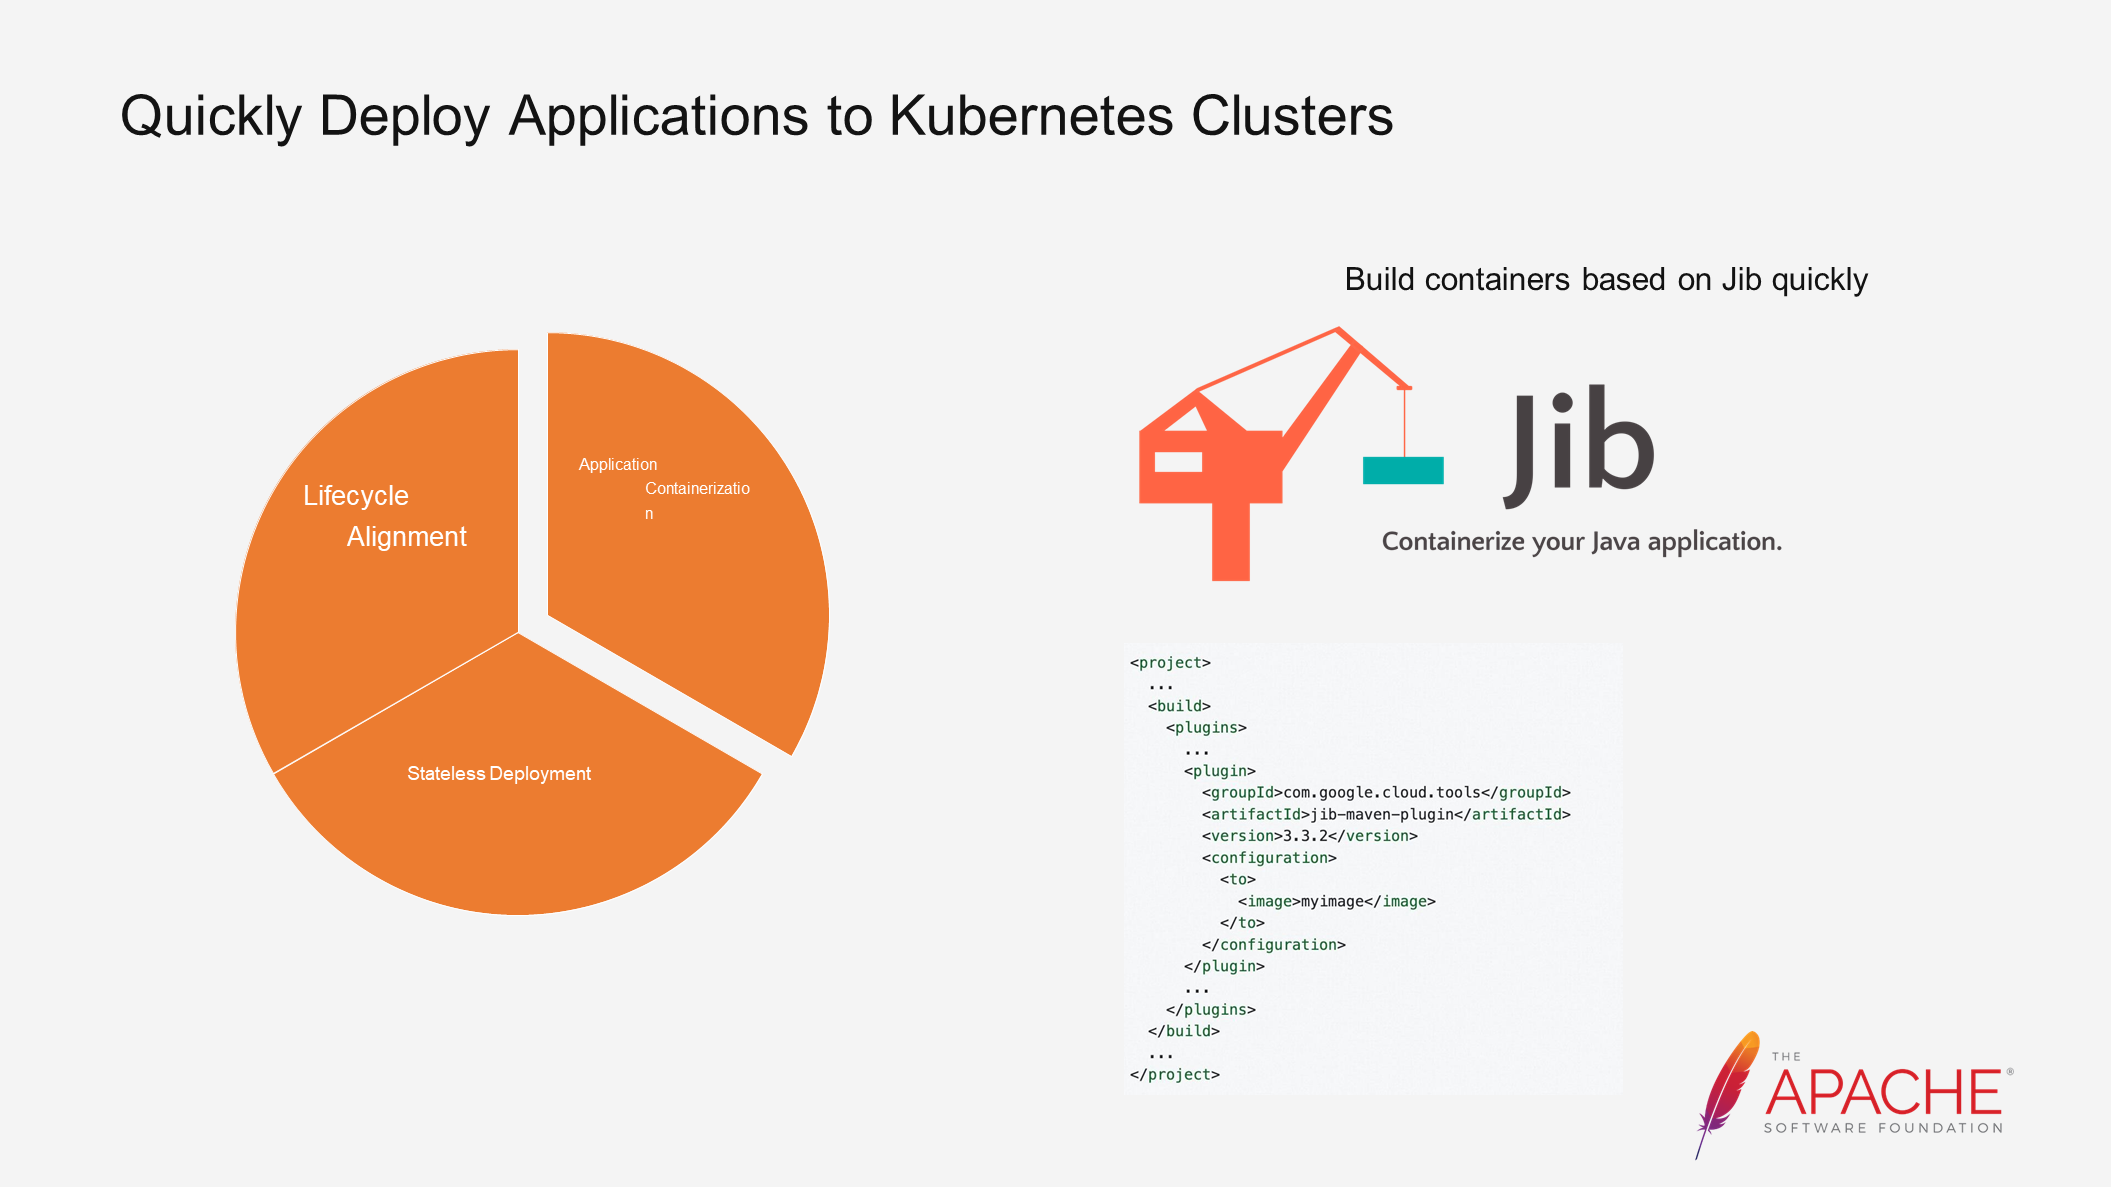
To deploy applications to Kubernetes, there are three steps that need to be completed: containerization, stateless deployment, and lifecycle alignment. The first step is application containerization, which means running the application in a container. Normally, this requires preparing a Dockerfile and packaging it through a series of scripts. However, it is possible to complete all these operations through a Maven plugin. Today, we will introduce a Maven-based automated build plugin that can automatically package the compilation results into a container during the Maven packaging process, enabling rapid build.
As you can see, all I need to do is add a corresponding configuration item dependency to my pom file. The one-click Maven compilation mode can help build the image during Maven packaging and then push it directly to the remote repository. All of this can be done with just one command. Once configured, all future image updates can be automated without the need to write cumbersome Dockerfiles.
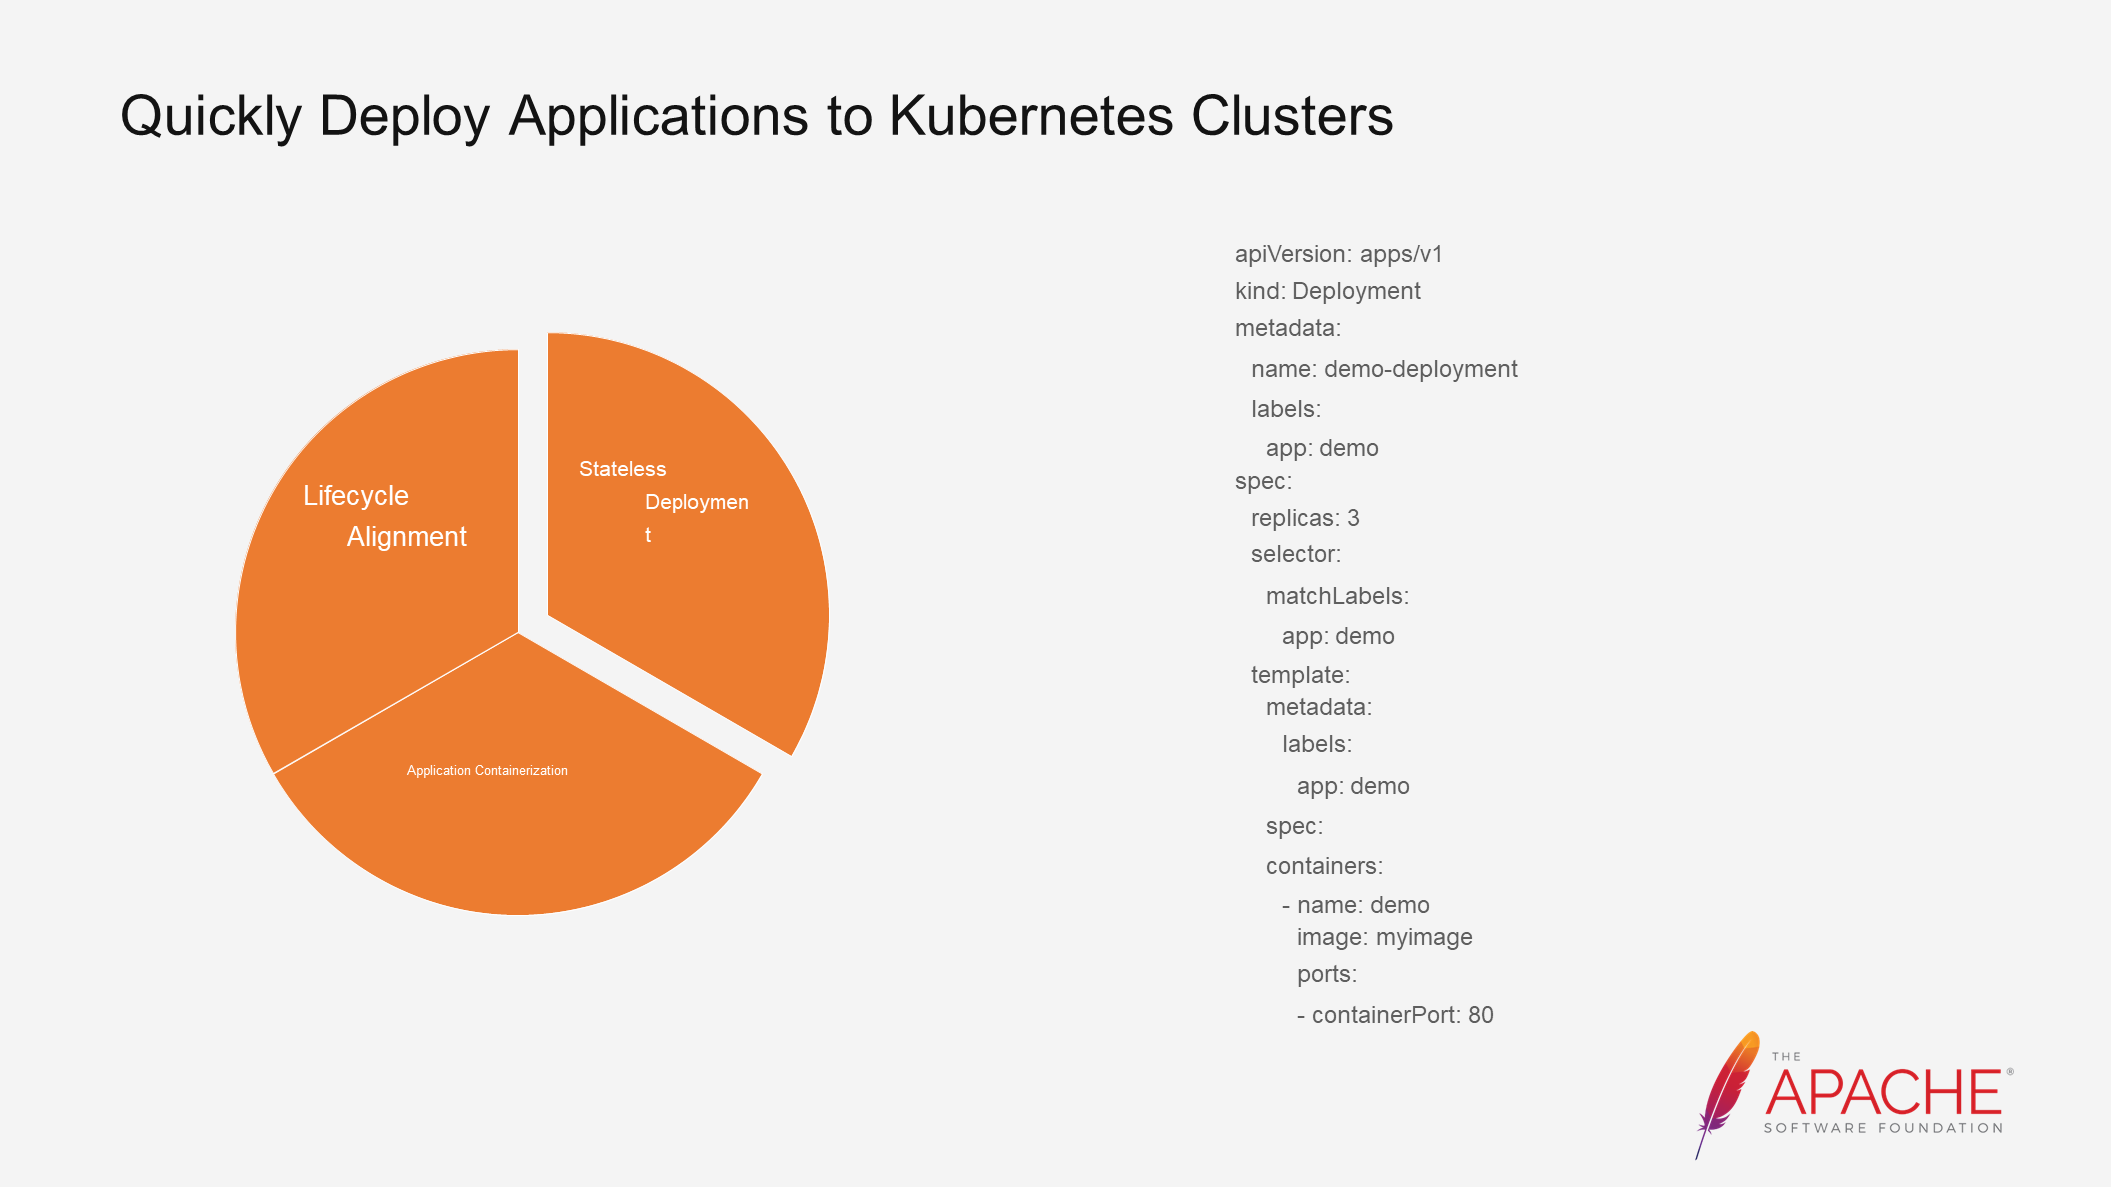
After the application is containerized, the next step is to configure Kubernetes resources to run the image in a Kubernetes container. The template on the right is a simple template for stateless deployment in Kubernetes.
This is a simple example. After the deployment is configured and the image is specified, I declare a service. This service is important as it will be used as the configuration for the frontend application portal, but it is an Ingress gateway. After applying the image, we can run the environment on the Kubernetes system. Let's do a simple test by introducing a curl container. Similarly, we can use the curl command to access my newly deployed container node and verify that it returns the data information of Hello World. In summary, we can run the container on Kubernetes through the deployment and provide external services that can be accessed via curl commands.
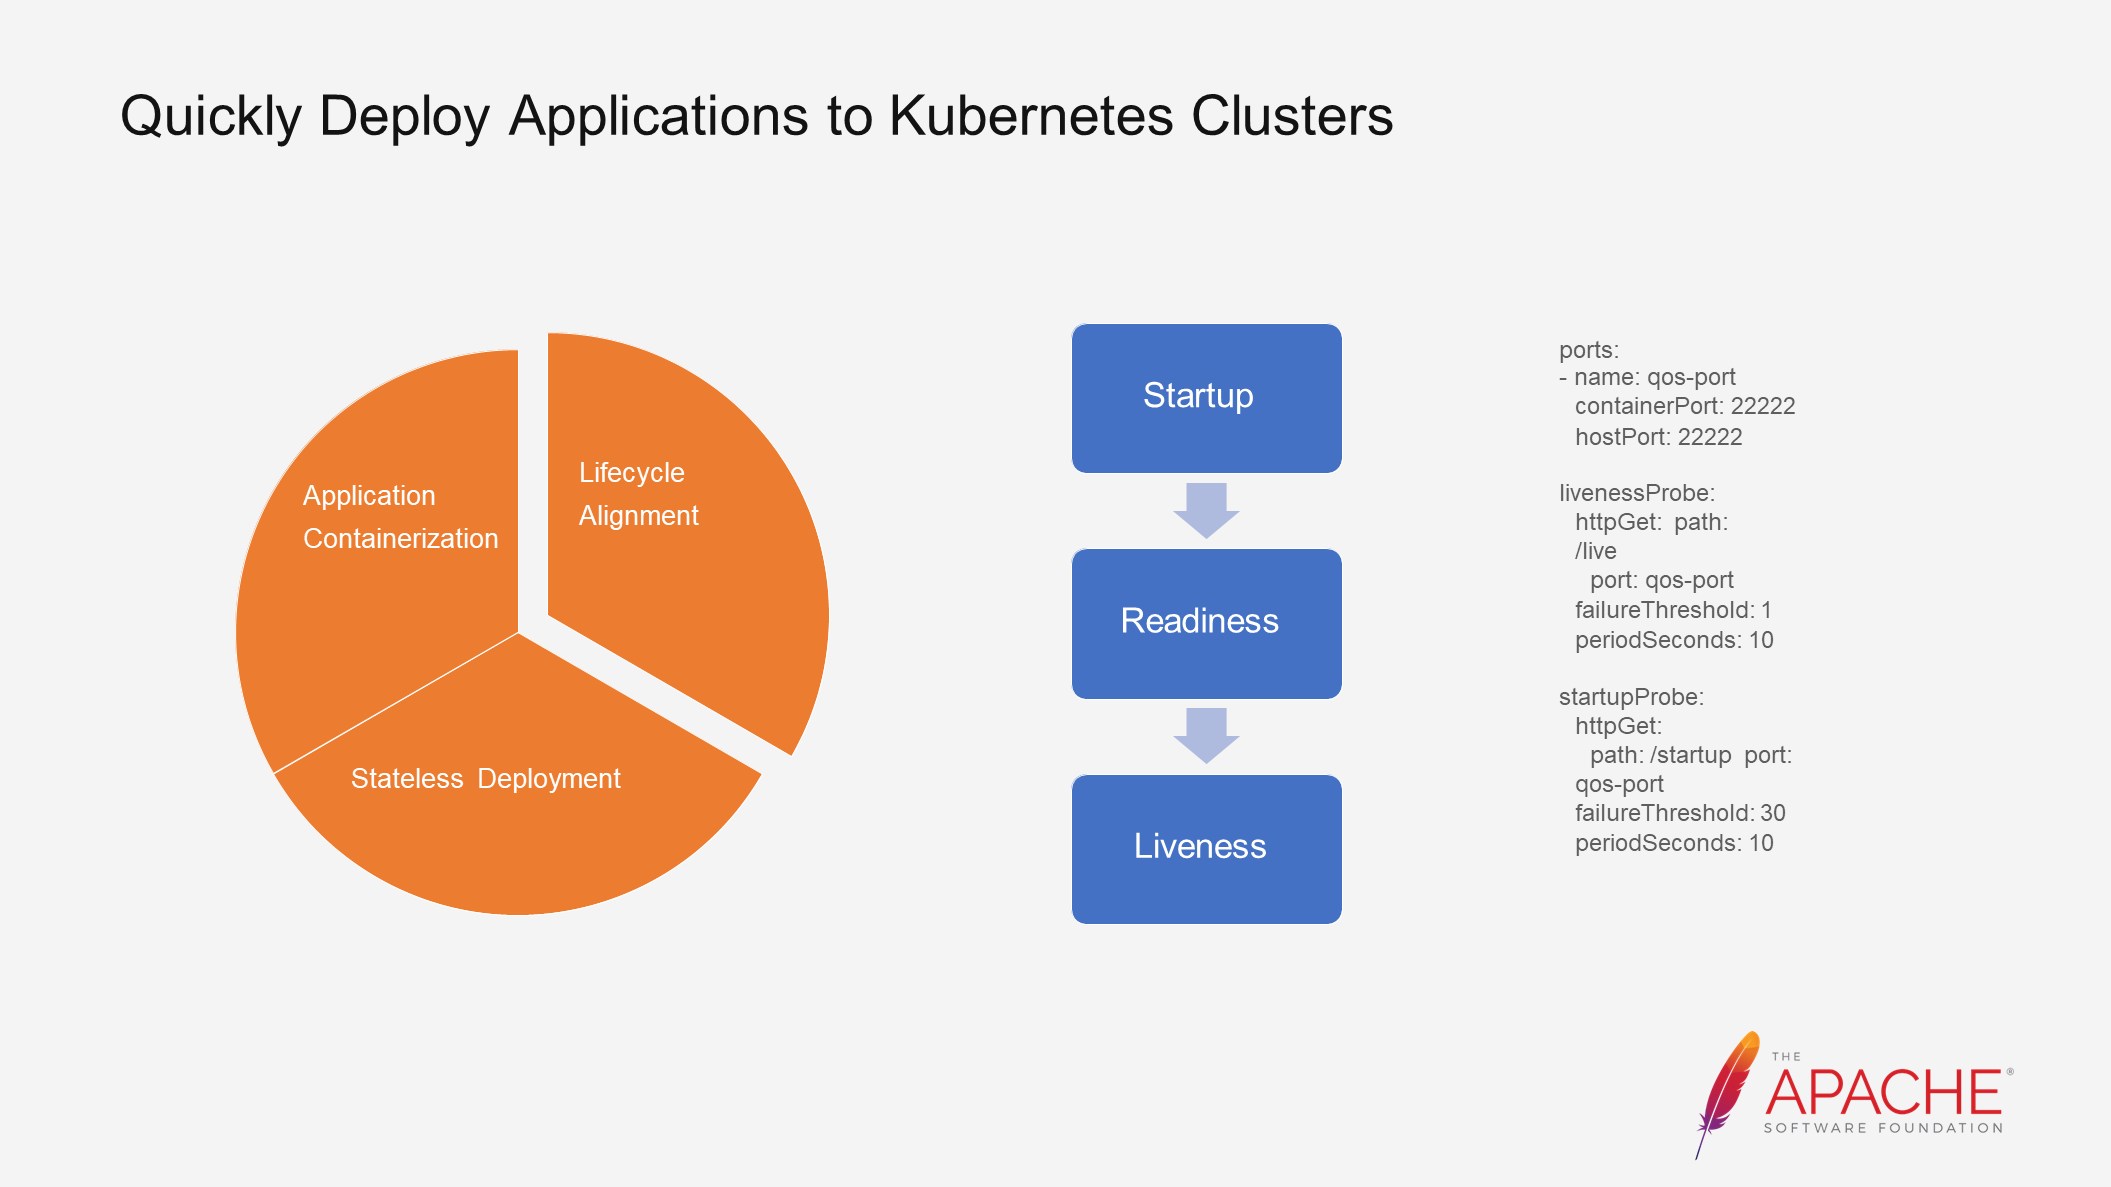
Finally, after the applications are deployed to the Kubernetes clusters, Kubernetes schedules them based on the lifecycle of pods. Applications are scheduled based on the health status of pods during batch rotation. If the corresponding health status is not configured, applications in the next batch may be released before the applications in the previous batch start. To solve this problem, Dubbo provides several QoS commands for Kubernetes to call and query the application status.
The above example demonstrates this. The application sleeps for 20 seconds during startup and then configures the corresponding probe information. By setting the wait time to 20 seconds, we ensure that the application takes more than 20 seconds to wake up. After modifying the code, it needs to be recompiled and pushed using the one-click Maven compilation mode. The deployment needs to be applied, after which all pods are not ready and in the zero state. This is because Dubbo has not started yet after the 20-second sleep. Once the sleep period is over, the pods become ready and can be batched. This is the process of lifecycle alignment. By knowing when an application starts successfully or fails to start, Kubernetes can perform better scheduling.
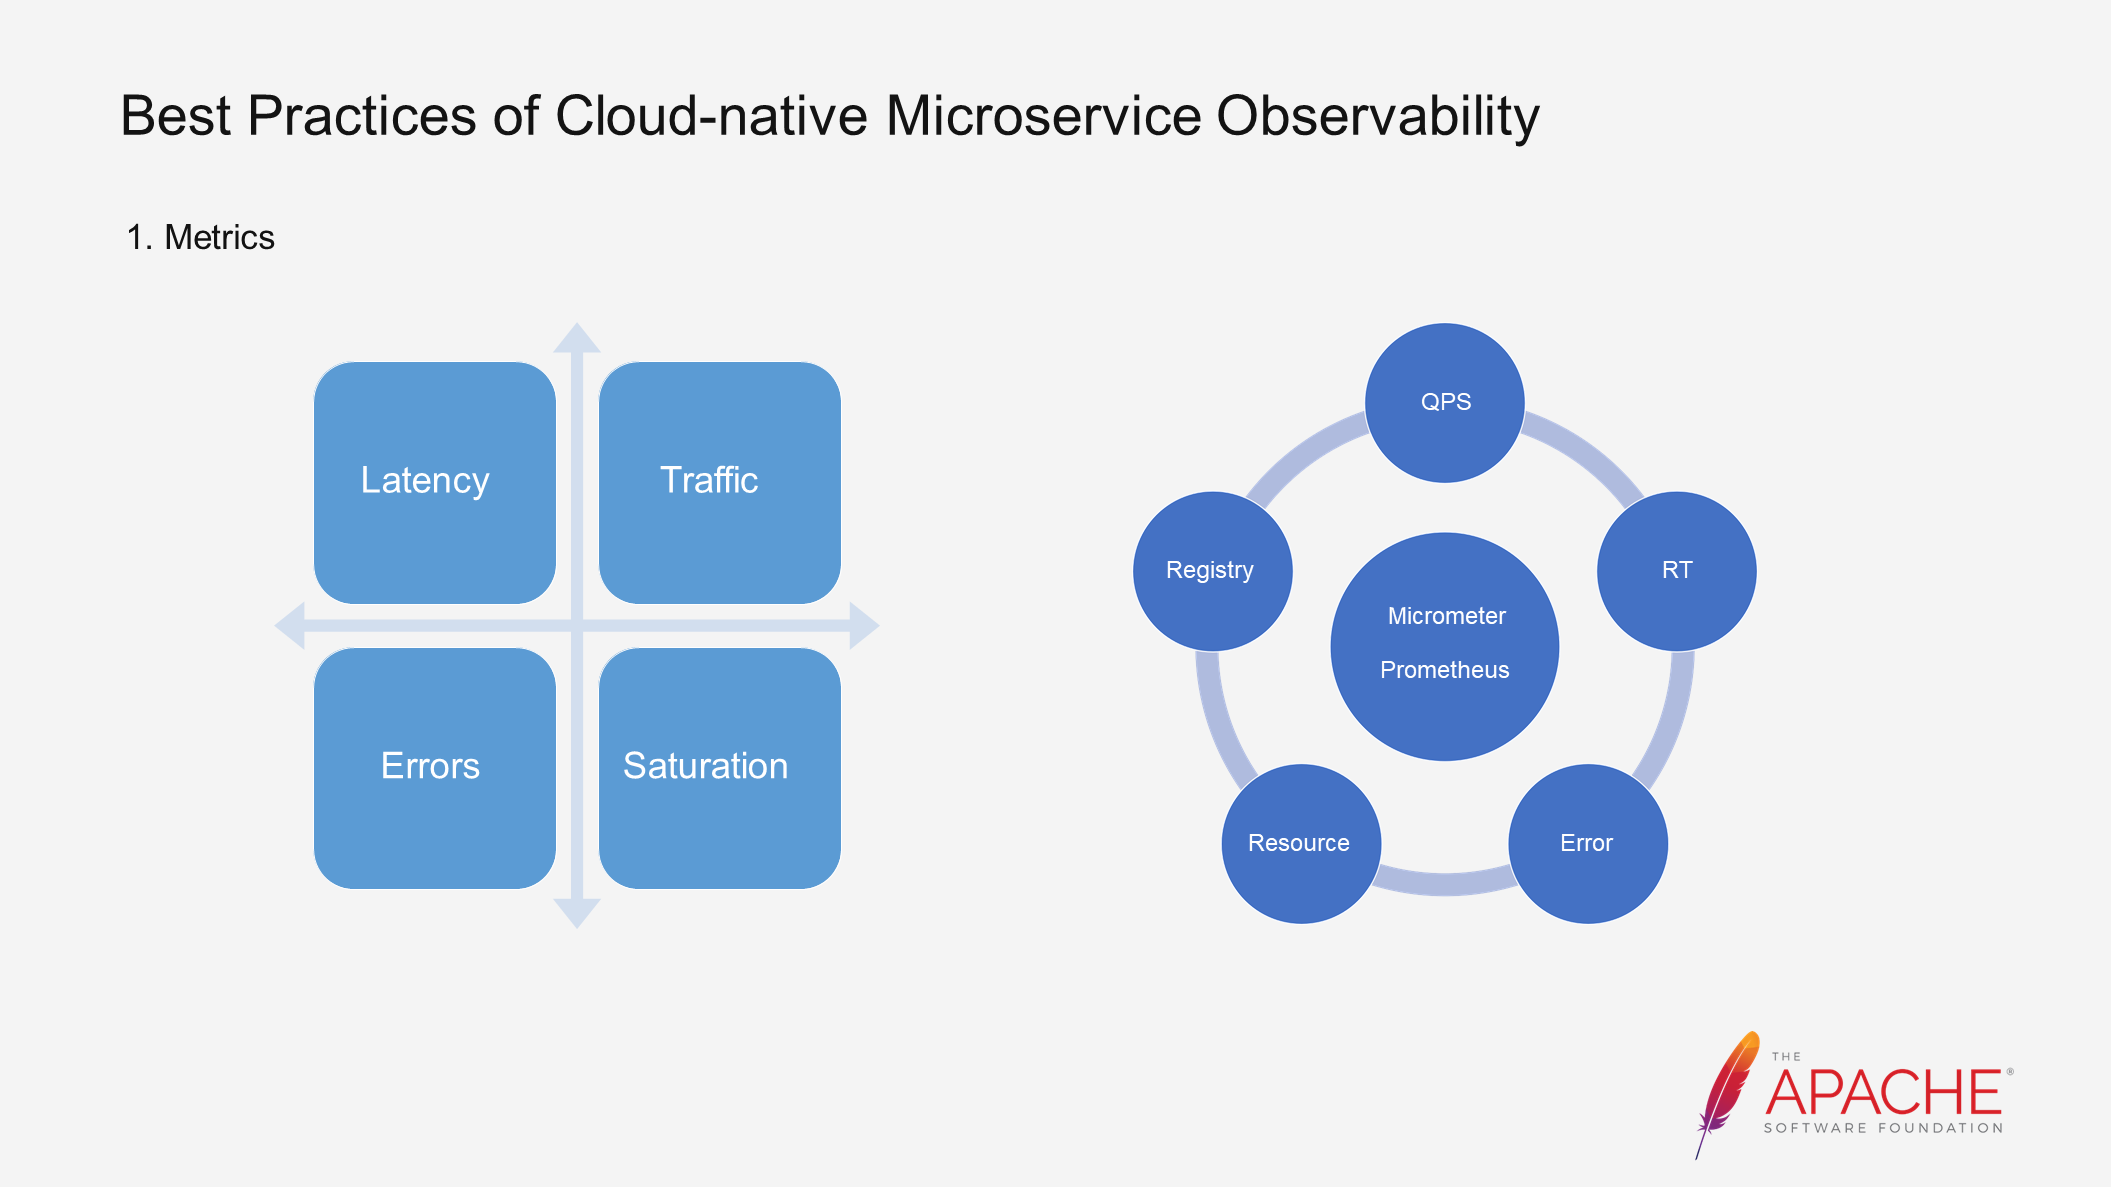
The observable system consists of three modules: Metrics, Tracing, and Logging. First, let's talk about Metrics. We focus on several core metrics such as latency, traffic, and abnormal conditions, which correspond to QPS, RT, and other metrics in Dubbo.
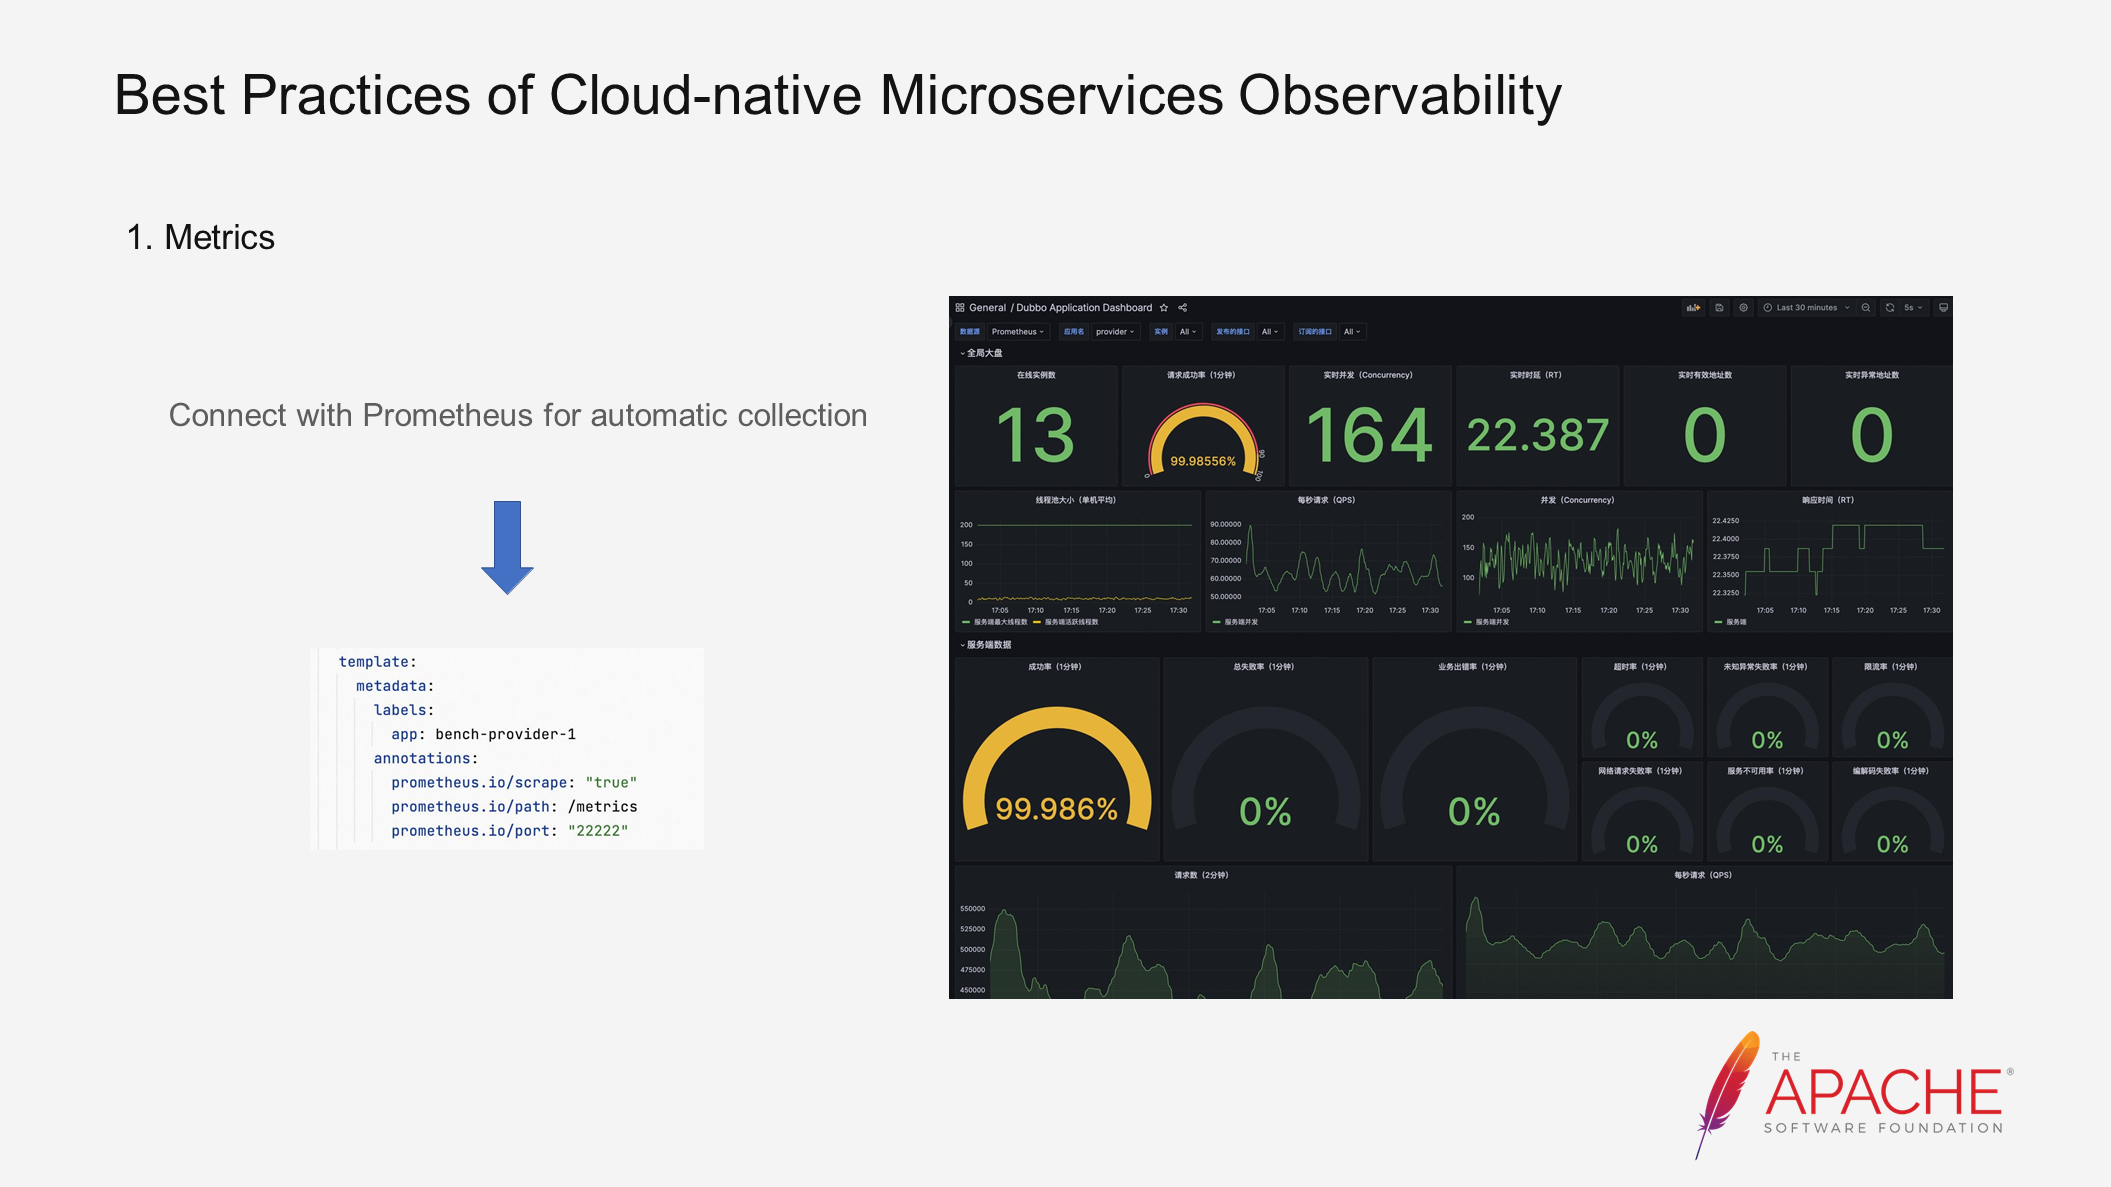
In the latest version of Dubbo, the metrics collection capability is integrated by default. If you have Prometheus deployed in your clusters, you only need to configure a few parameters to automatically collect metrics.
Here is a demo. We added metrics collection information to the previous deployment example and applied it. Then, we can use Grafana to export the metrics. After running for a period of time, the corresponding traffic information, such as QPS, RT, and success rate, will be displayed. With these metrics, we can set up alerts. For example, if the QPS suddenly drops from 100 to 0 or the success rate decreases significantly, we need to send an alert to notify everyone about the current problem. We can proactively push alerts based on Prometheus collection.
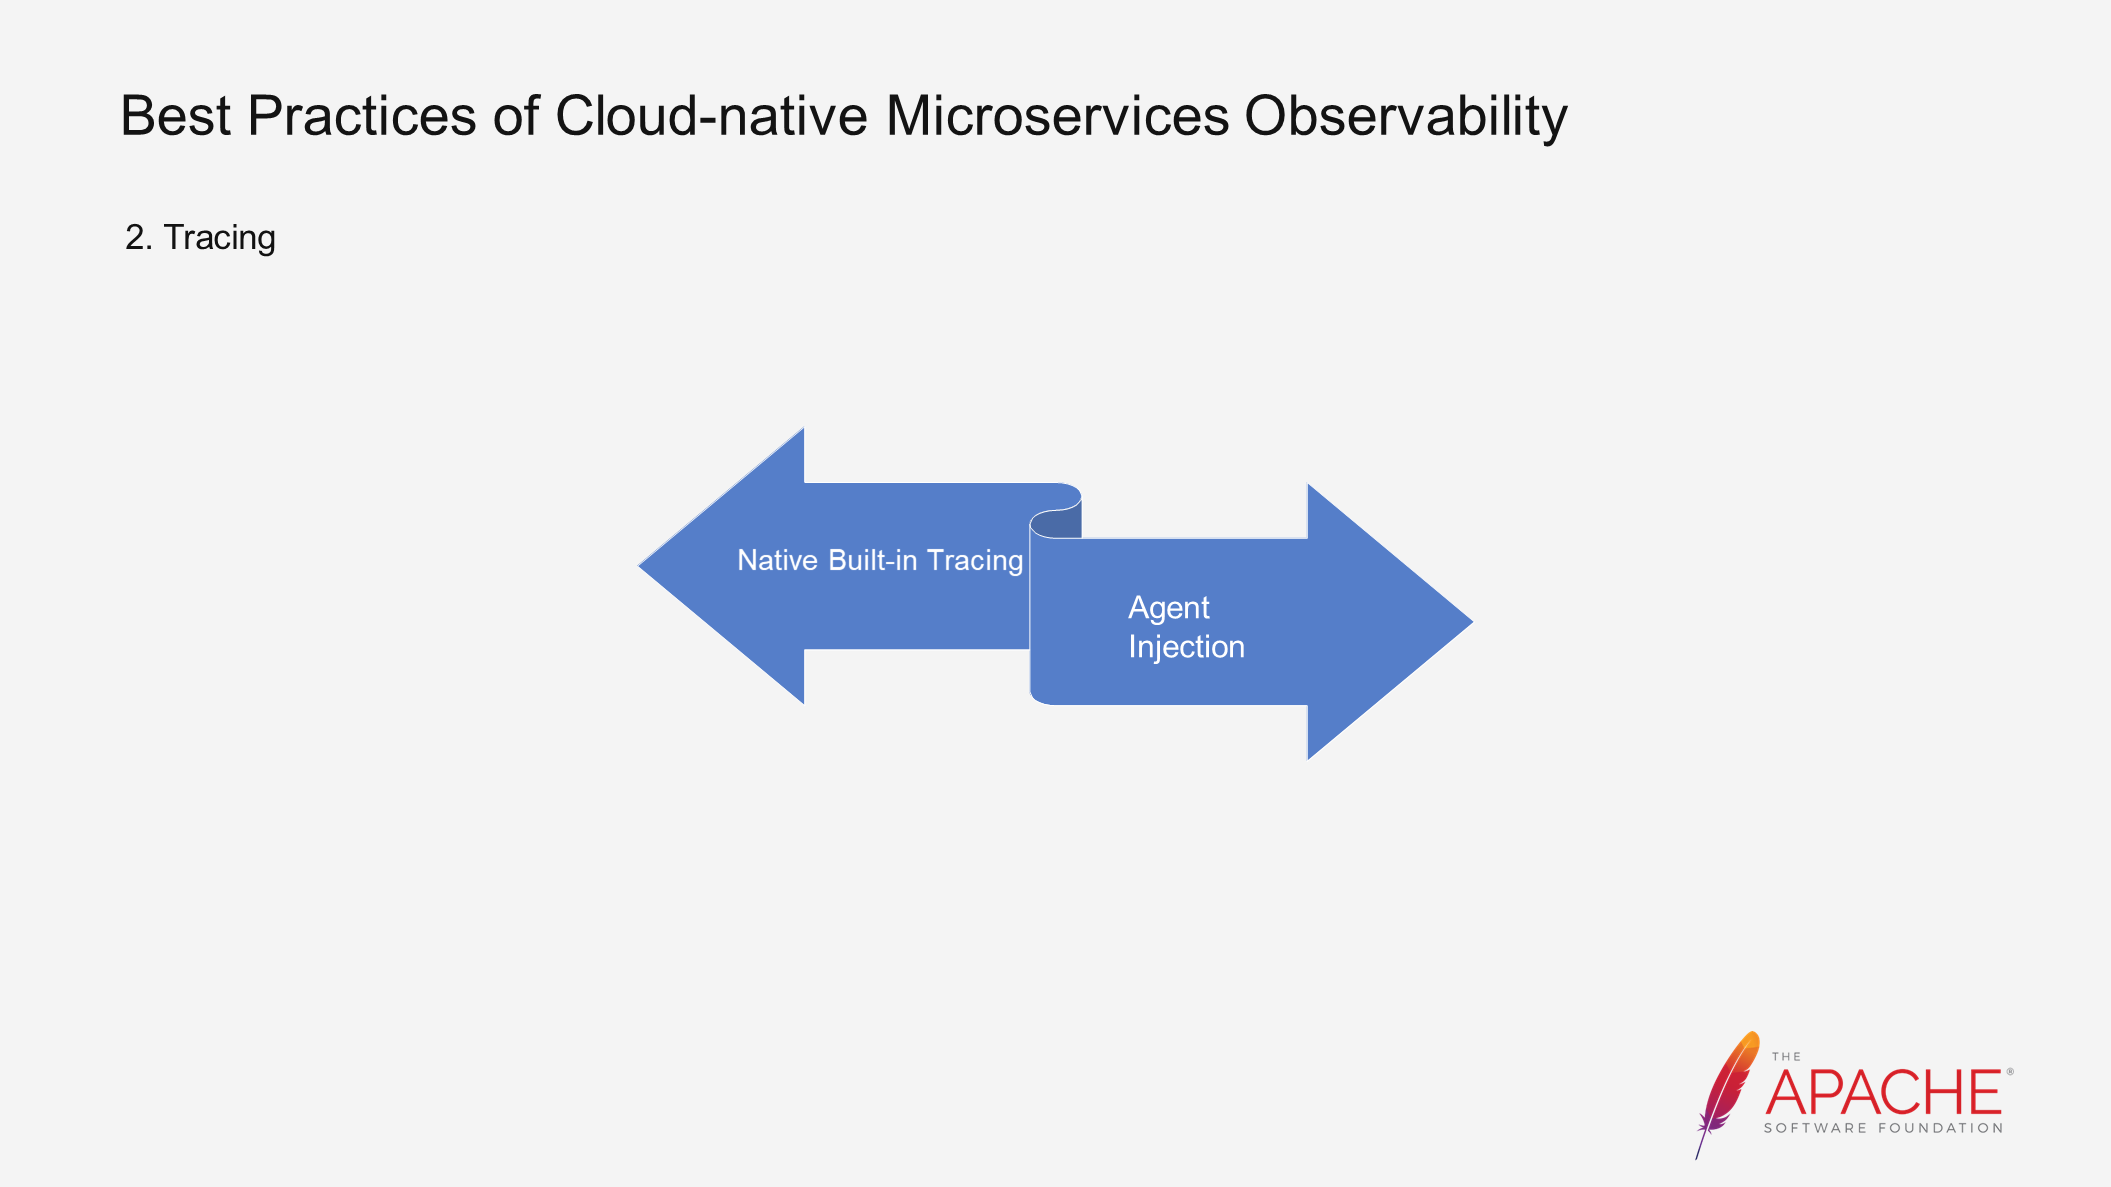
Tracing is another important component of observability. Currently, there are two mainstream solutions to implement tracing capabilities. One is to introduce tracing-related components through SDK dependencies and deploy them statically. The other is to automatically inject them into the code and deploy them dynamically through the Agent mode.
As you can see, all you need to do is add Dubbo's Starter as a dependency and enable tracing capability in the configuration items to start reporting metrics. The backend of our Zipkin is 9411.
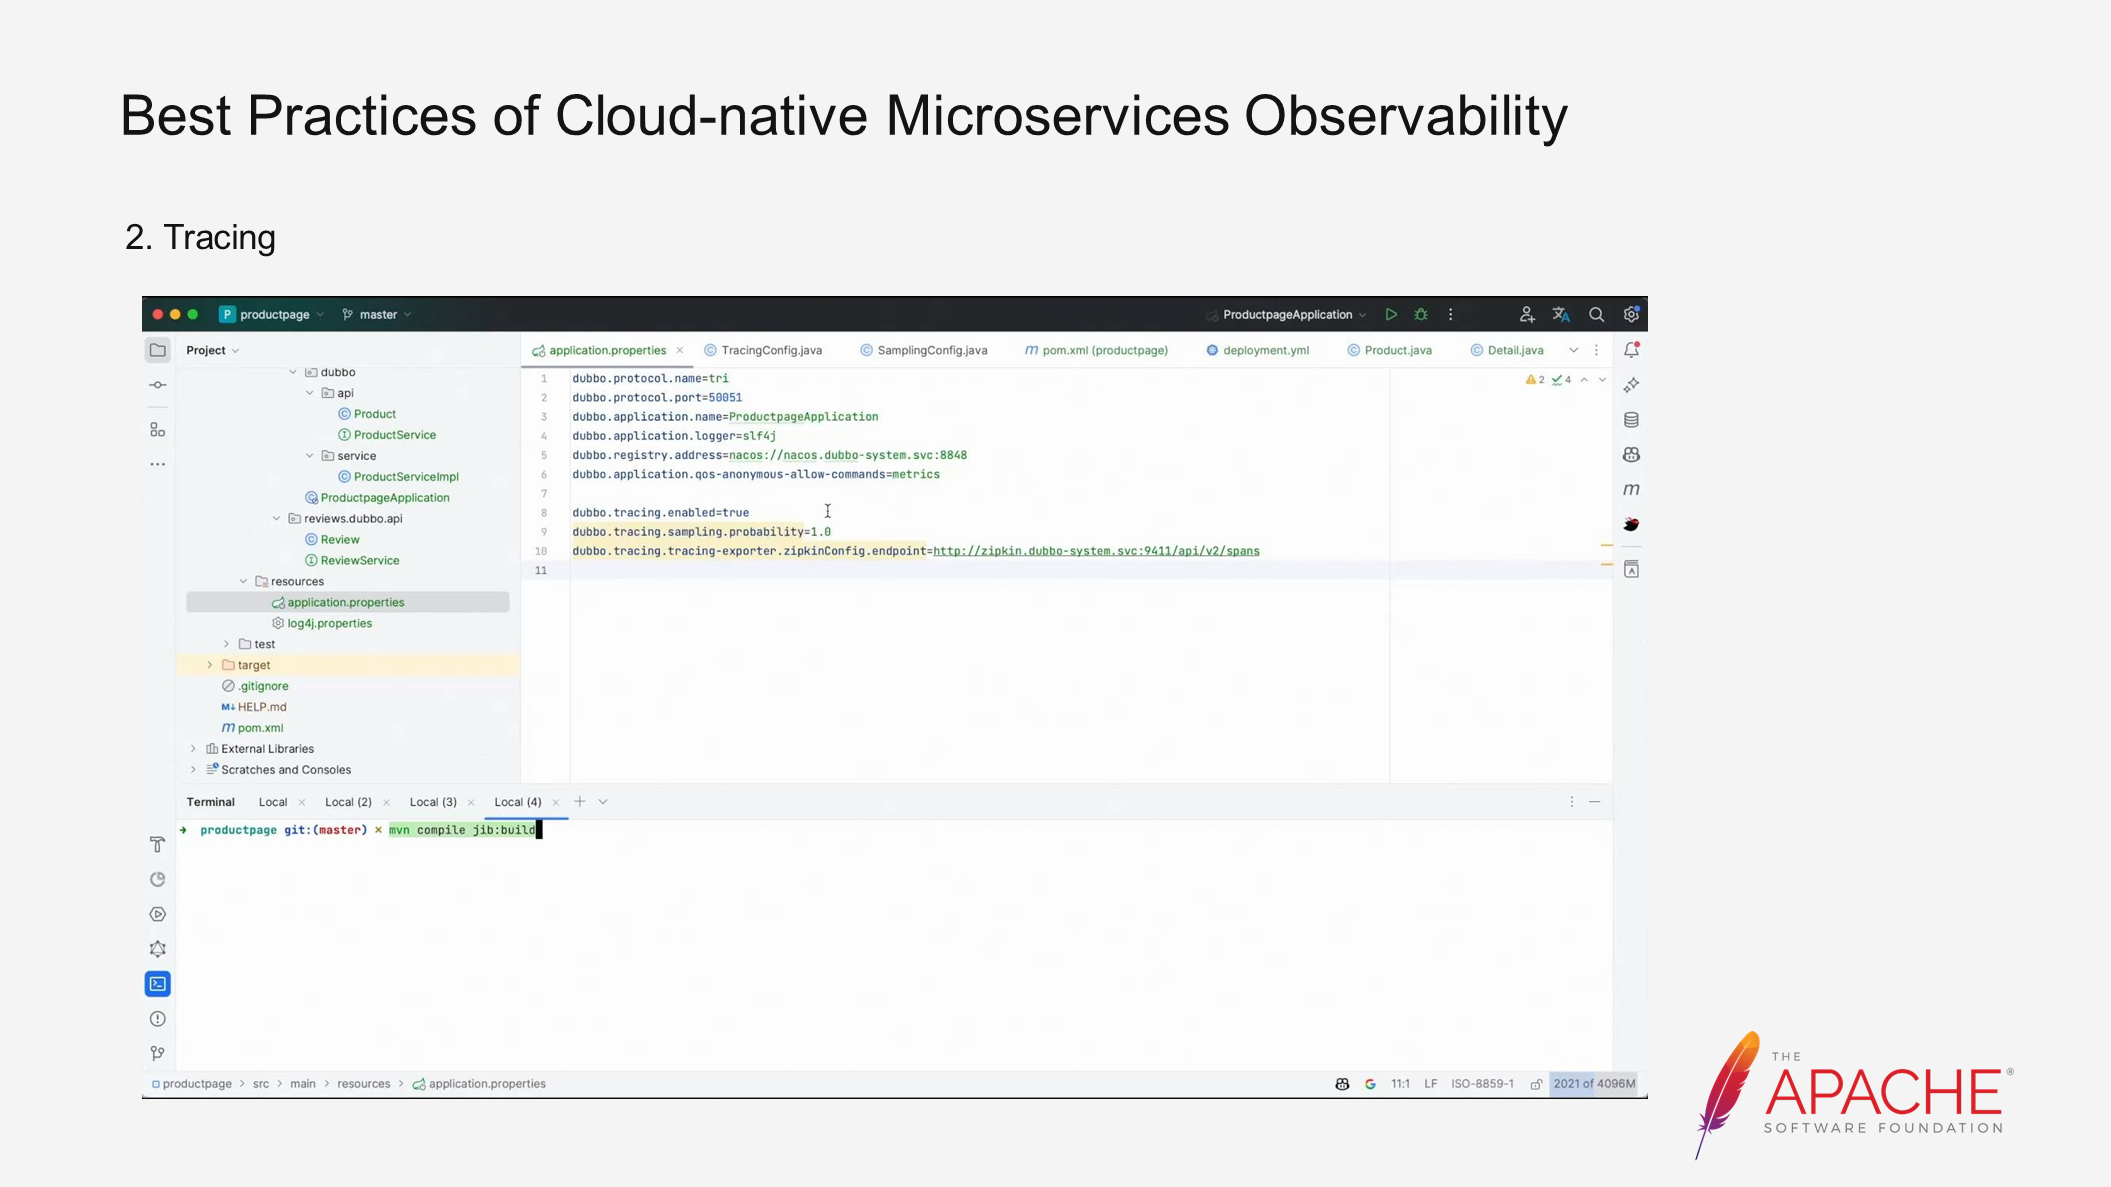
Here is another example. By configuring these settings, the data will be reported to Zipkin. The dependency is added directly. Similarly, package the application with the command mentioned earlier, push the image, and wait. During the push, you can check the Zipkin component, which was also pulled up when we initialized the environment based on Kubernetes. So, you can have all of them in the previous one-time deployment. Then, simply run a curl command to generate traffic. After the deployment, run the curl command to see what we have received. This actually completes the backend development and returns the actual result. Next, let's go to Zipkin and see if we can find this tracing. First, map 9411, and we can see the corresponding metric information after curling. The entire call information of the link can be seen here, representing the end-to-end access process. After adding the dependency and reporting configuration mentioned earlier, all the following processes will be completed and reported automatically. By looking at the corresponding results, we can understand what happened throughout the link.
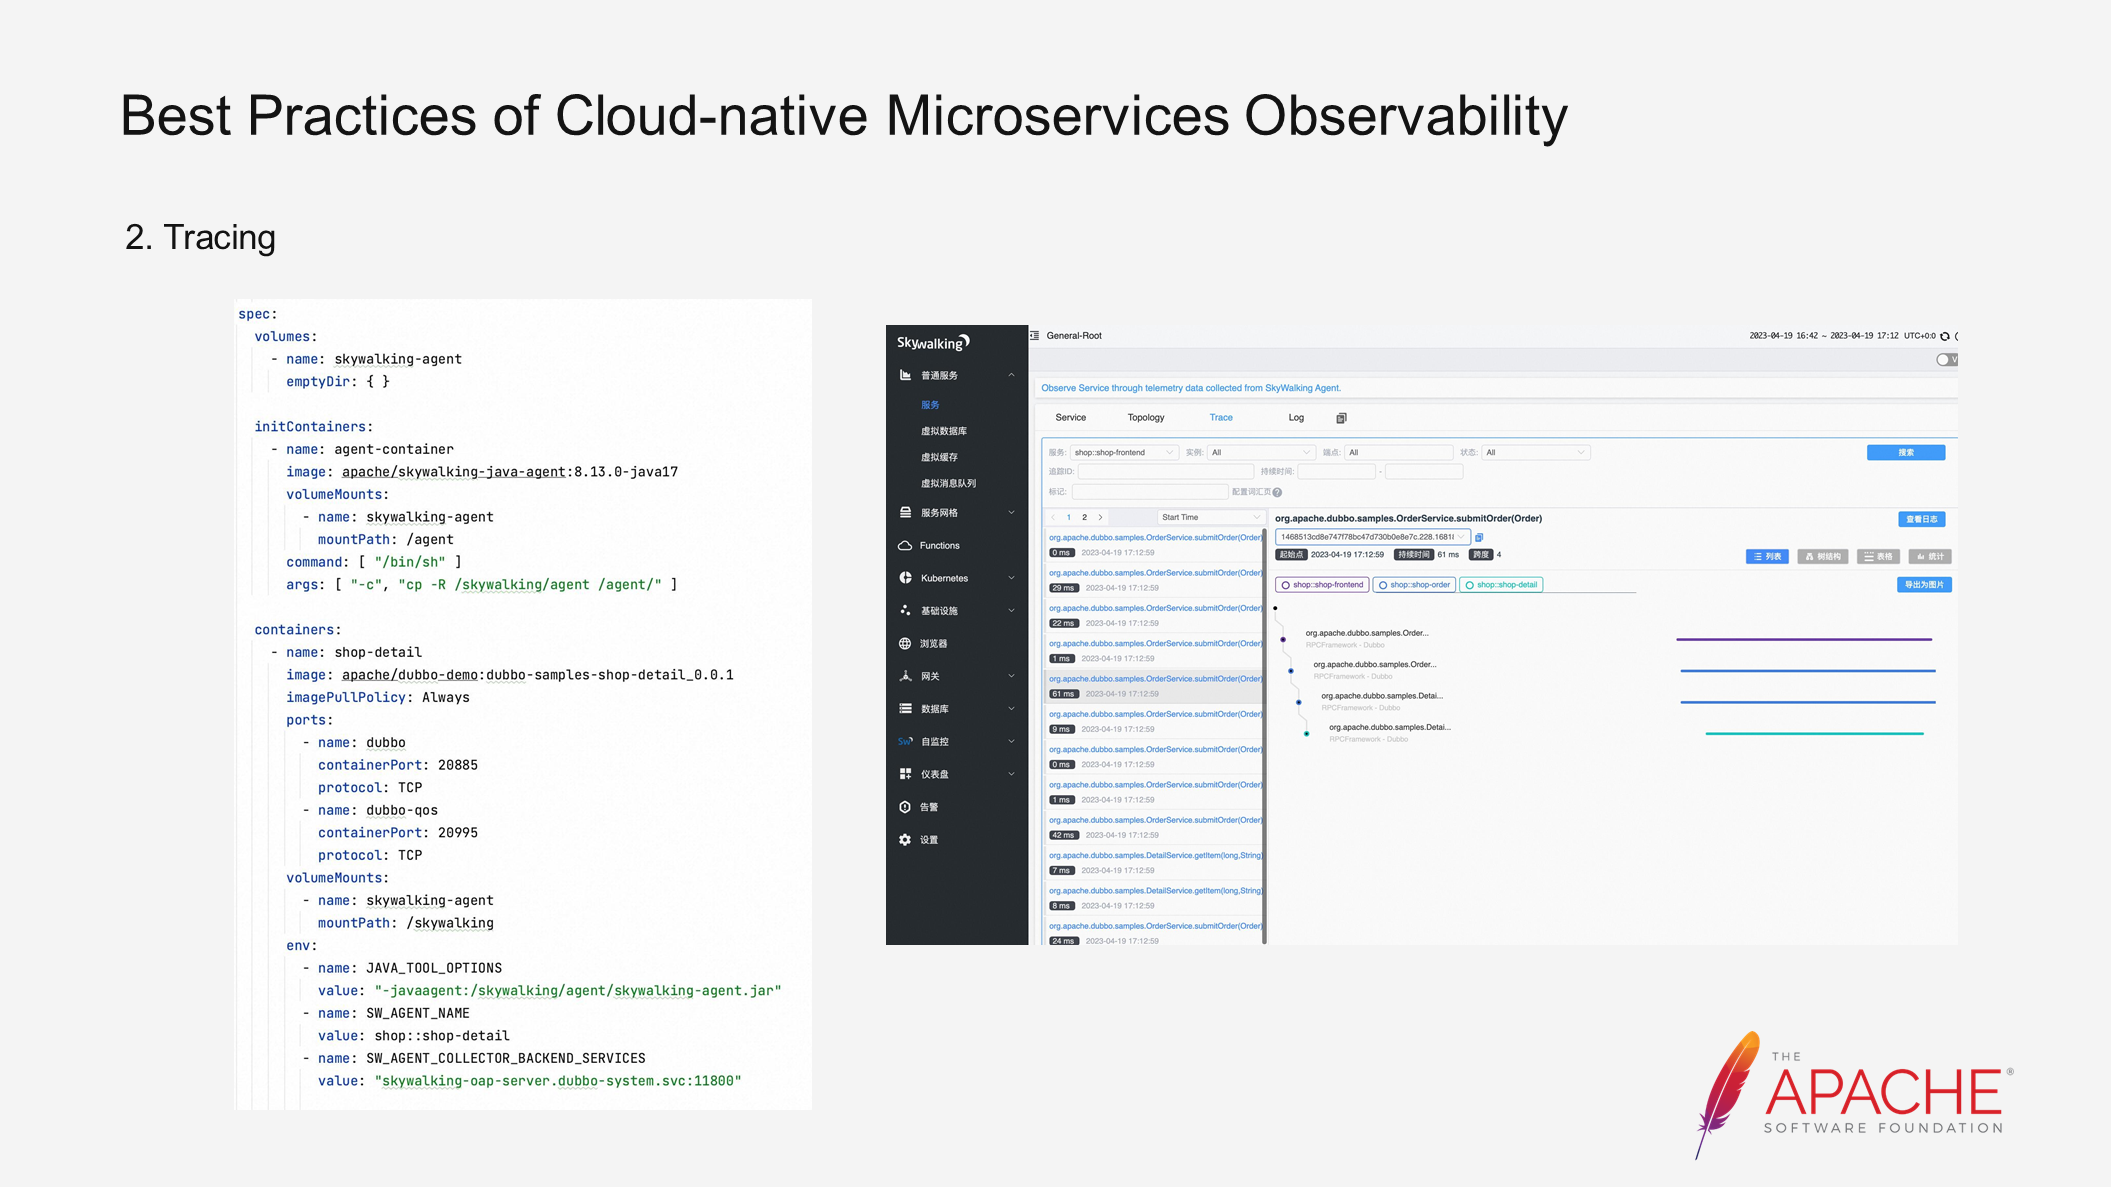
Tracing can also be deployed in agent-based mode. This example is based on the default configuration of Skywalking. By modifying the deployment configuration, the Javaagent can be automatically mounted to the application.
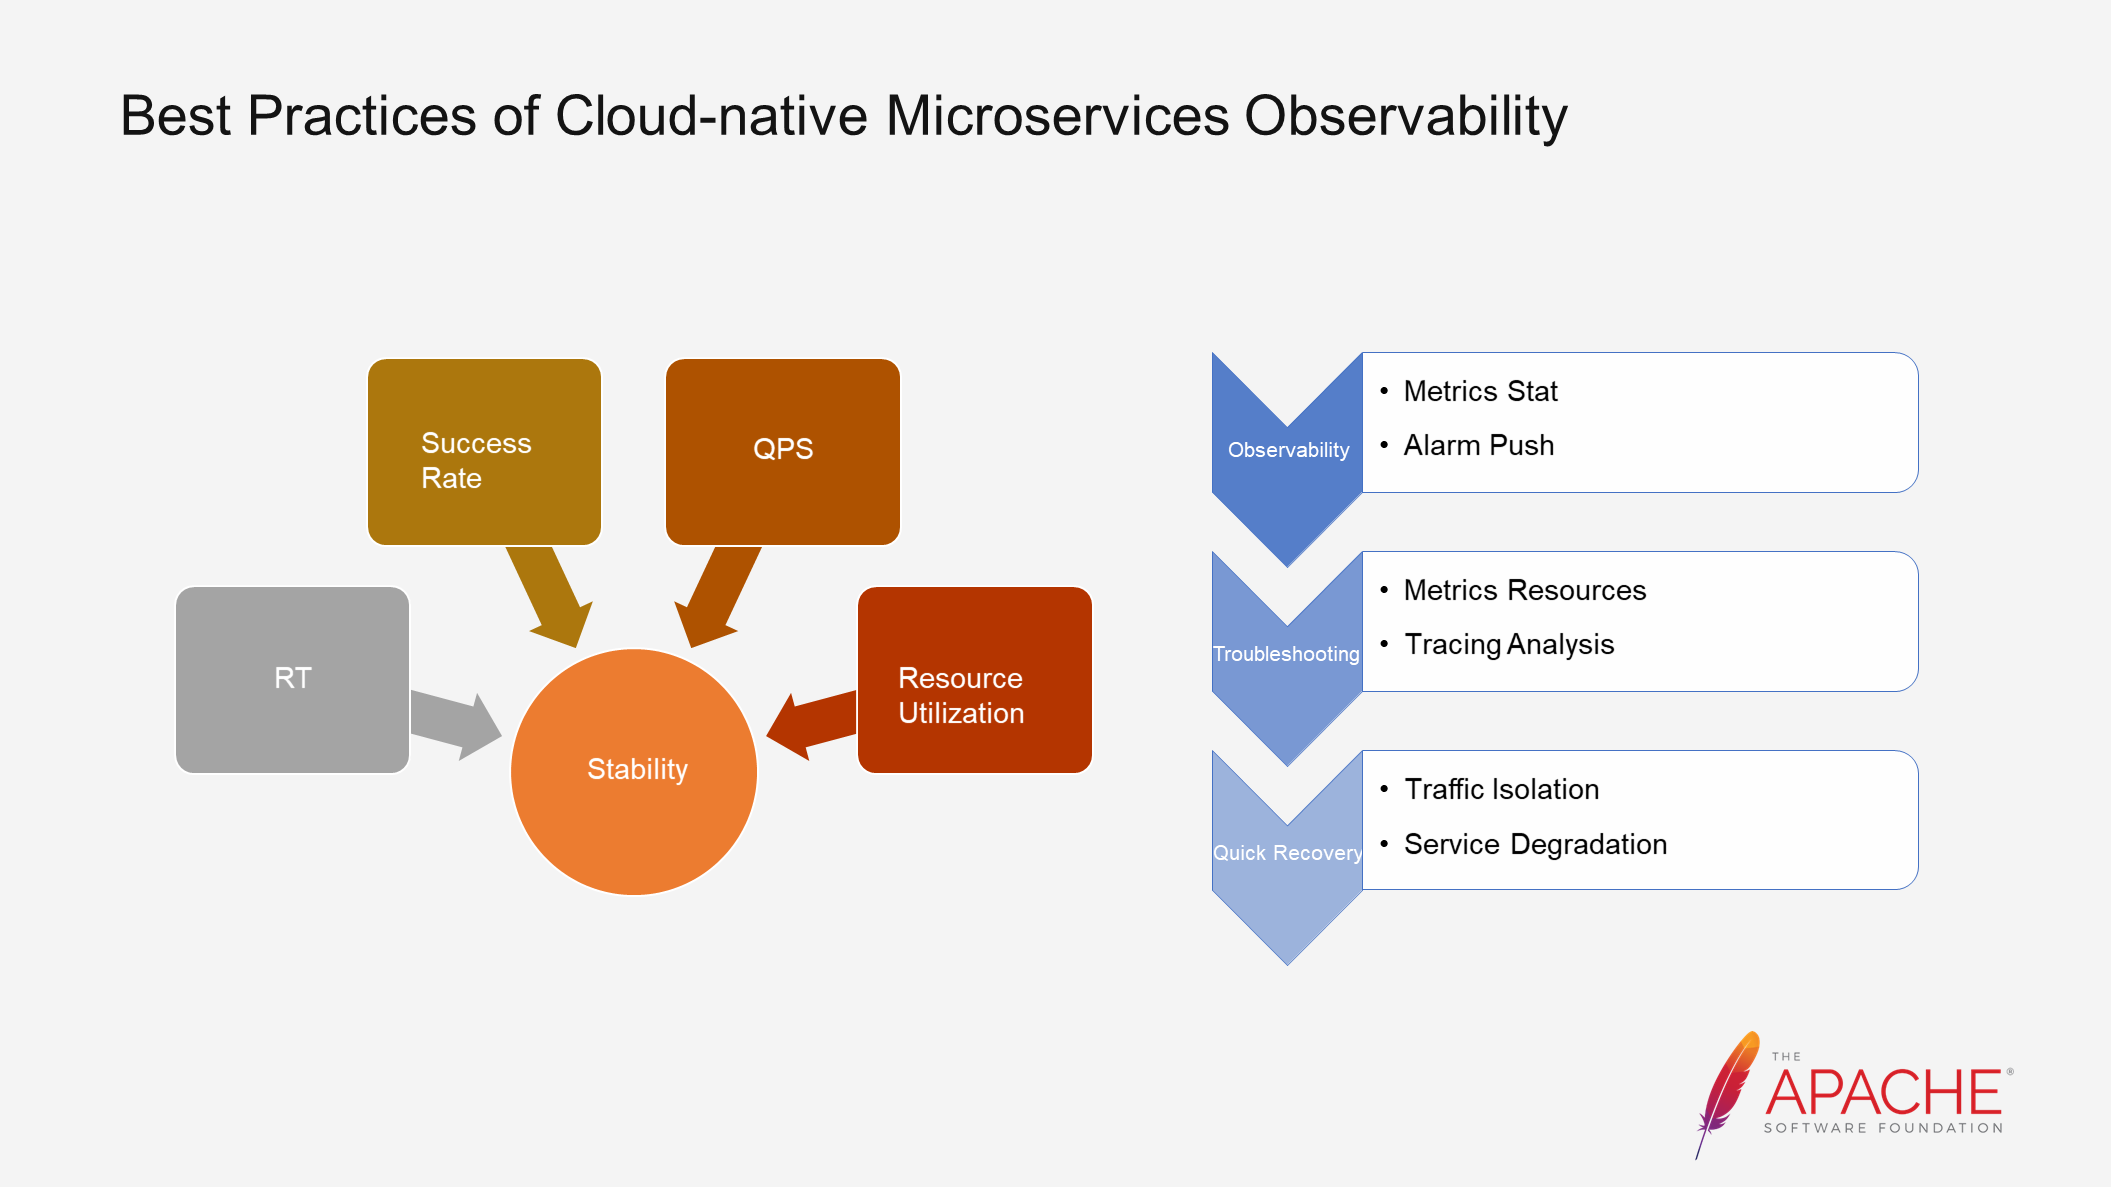
For complete observability, we can view QPS and RT information through Metrics and view end-to-end access information through Tracing. This provides a good solution for observing services first. By observing services, we can better troubleshoot overall problems and immediately know if the application is suspended. For example, if the availability rate drops to zero at 2 am, automated mechanisms can alert you about the problem, and you can take measures to quickly recover the application. Fast recovery can be achieved through rollback or quickly isolating traffic. By quickly transitioning from observation to troubleshooting to rapid recovery, a secure and stable system can be built in the production environment. Therefore, our goal after observation is to ensure the stability of the entire application.
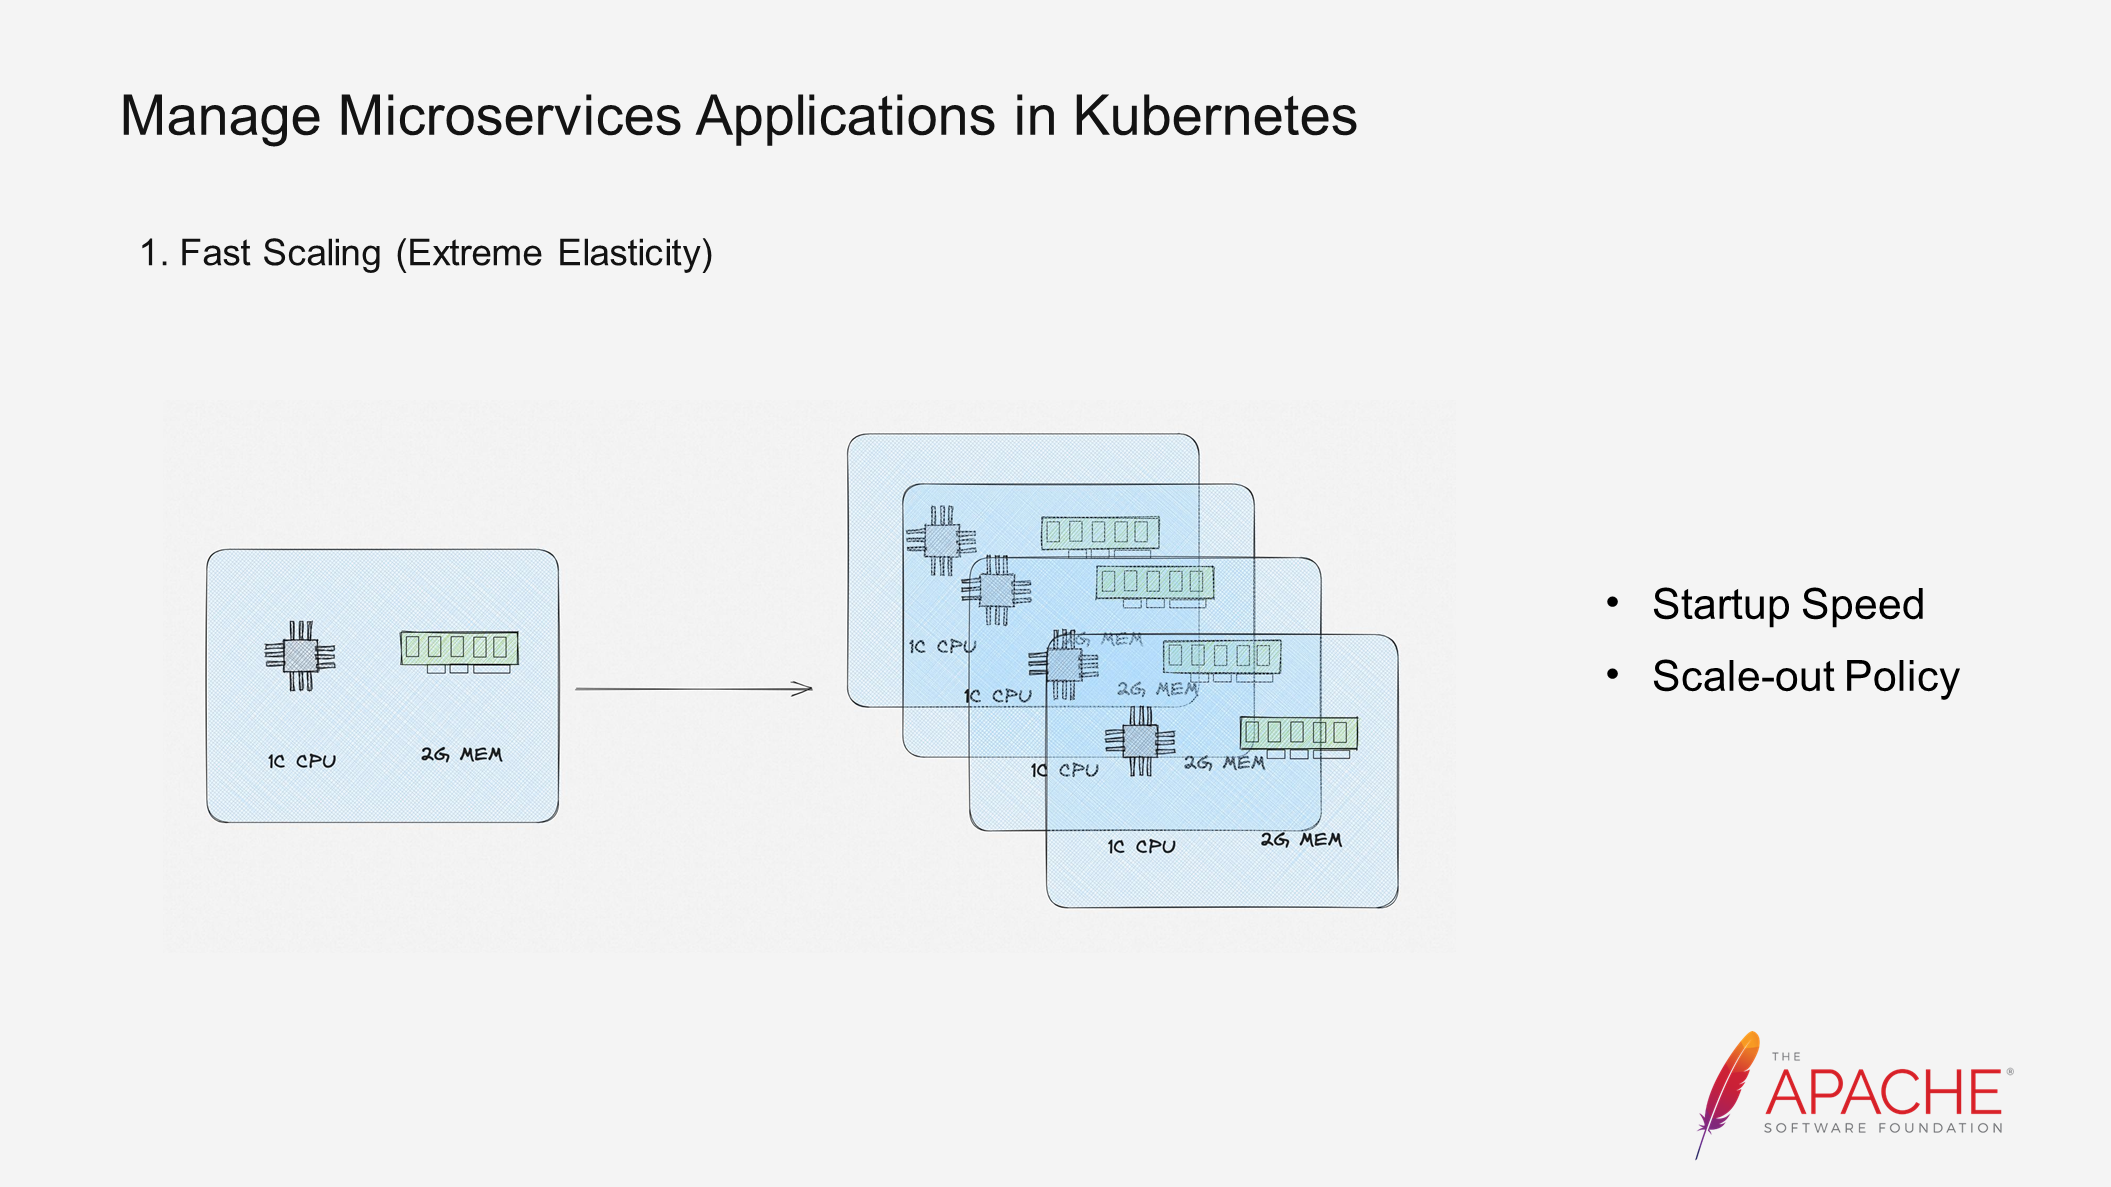
The benefits of Kubernetes include rapid scaling, which allows for quick transformation of one pod into multiple pods based on Kubernetes. Since Kubernetes is based on the deployment process of the entire image, once the image is packaged, the environment remains fixed and scaling out is the only requirement. However, rapid scale-out also presents several challenges. For example, if it takes several minutes to pull an application, even if the application is scaled out quickly, the business peak may have already passed. In such cases, Native Image is introduced to enable scaling out of the entire serverless service. With millisecond-level startup, the pods can be scaled out multiple times during traffic peaks and scaled down when traffic decreases, resulting in cost reduction. Metrics-based observation is crucial for determining when to scale out. By analyzing historical data, the traffic volume at a specific time can be predicted, allowing for proactive scaling or automated scale-outs.
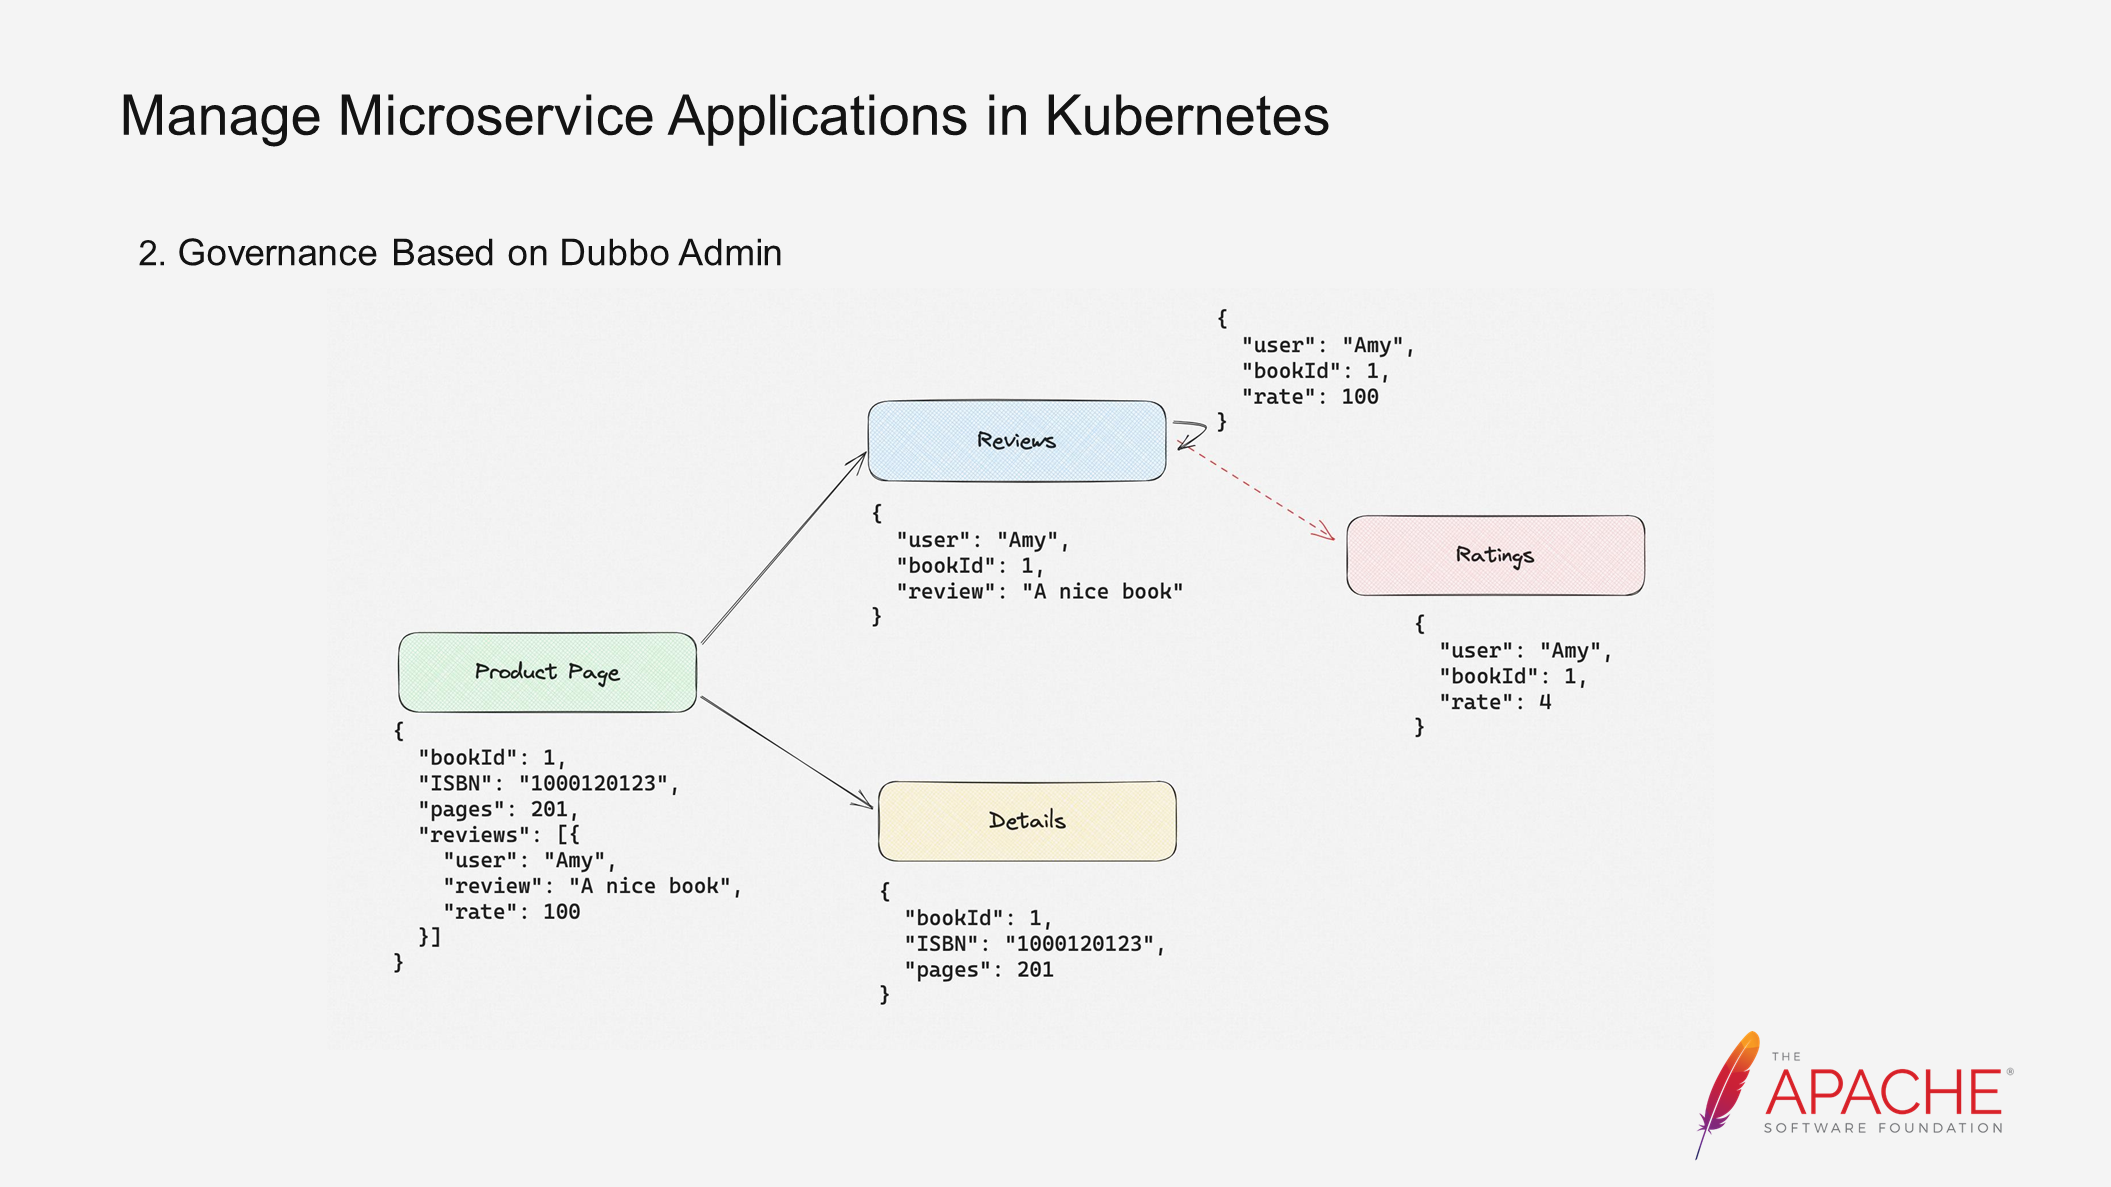
Here's a simple example: if there are issues with the rating, it can be removed and a Mock result can be returned.
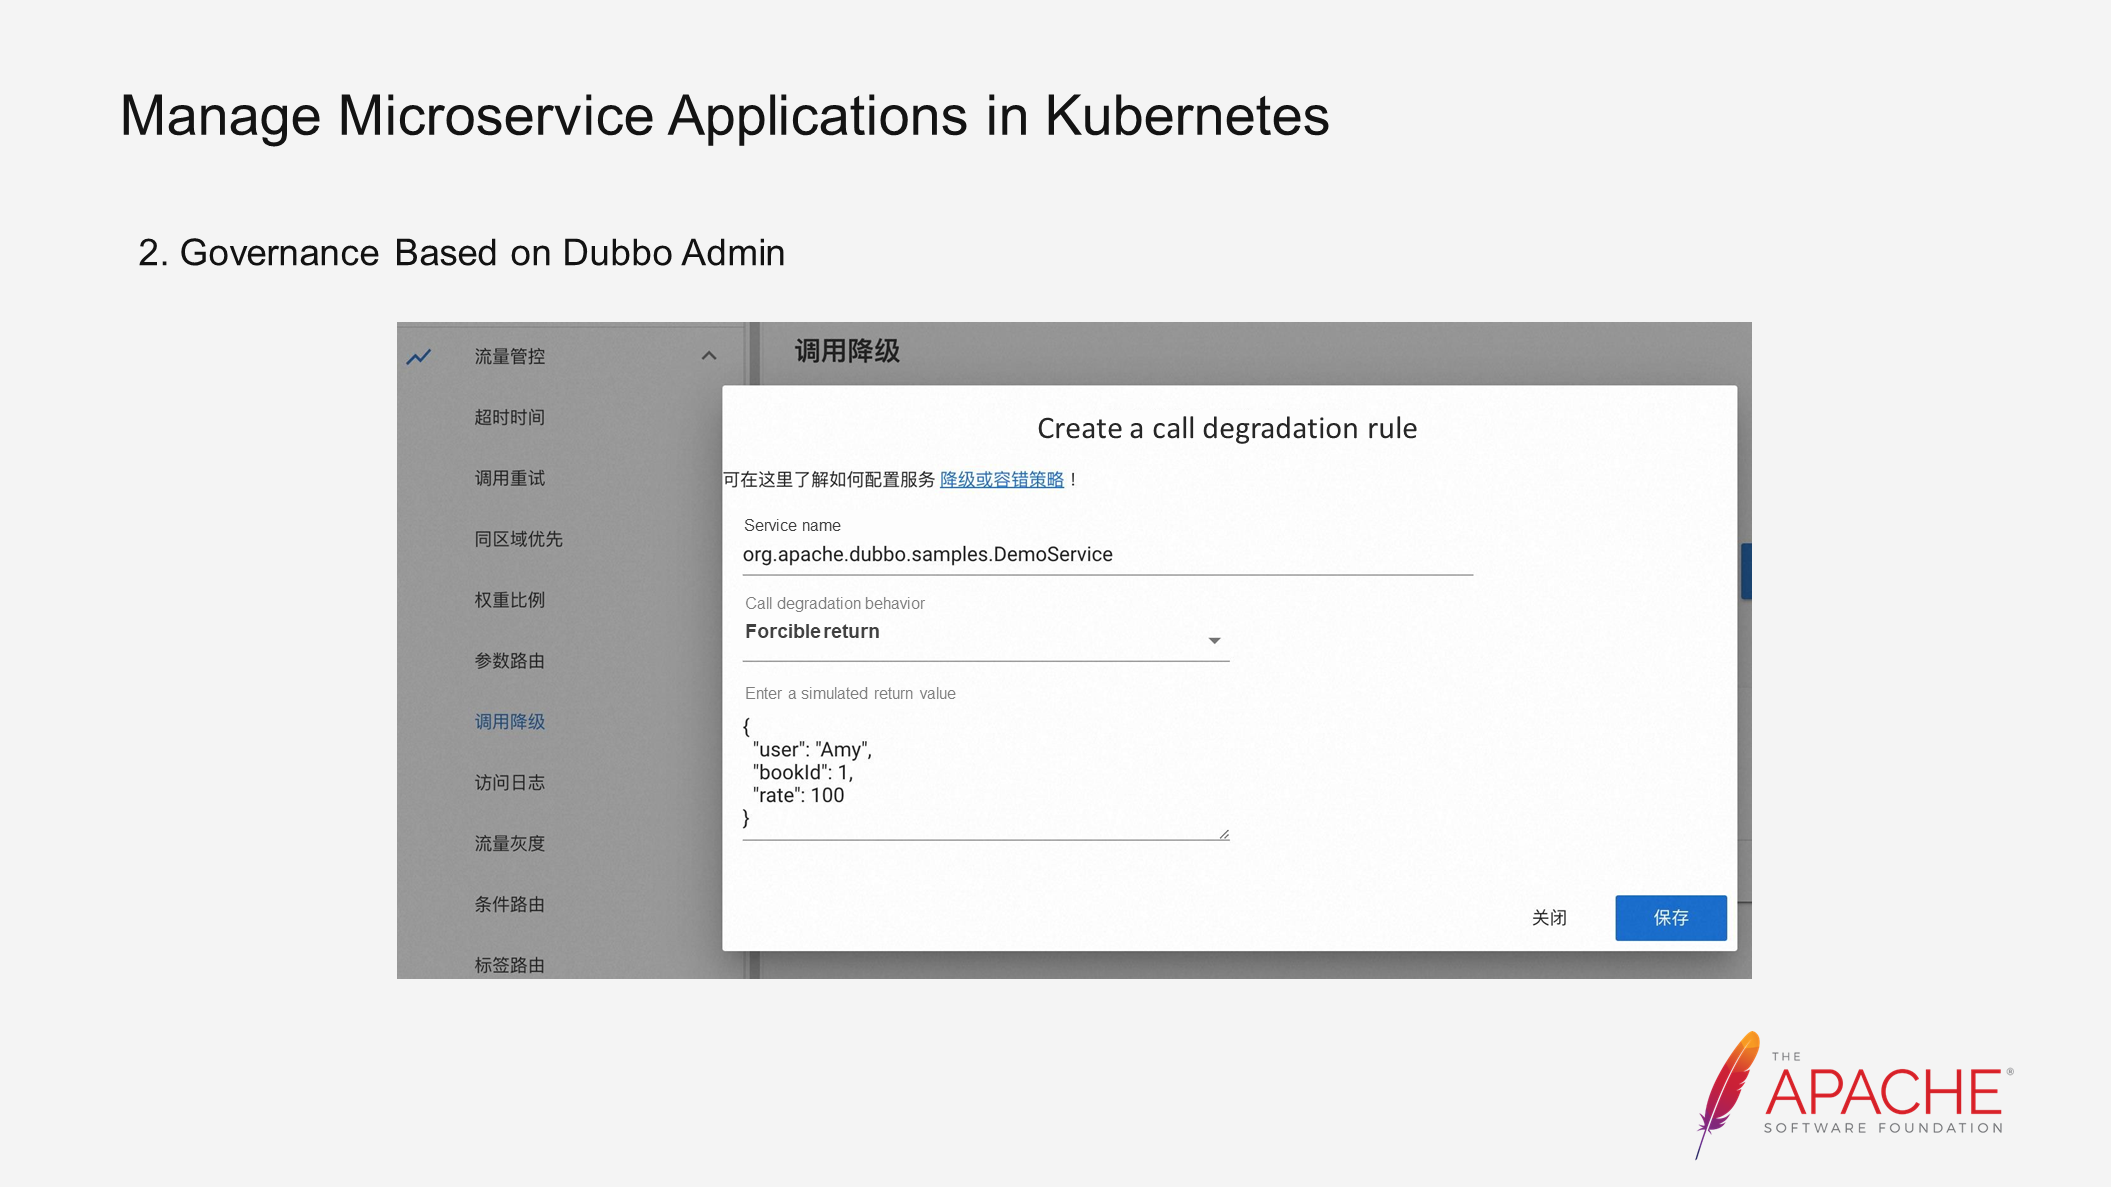
To do this, simply configure the rule shown in the above figure. This is the Admin usage process, which will not be further explained here. The reconstruction capability of the Go version mentioned earlier will be further improved later.
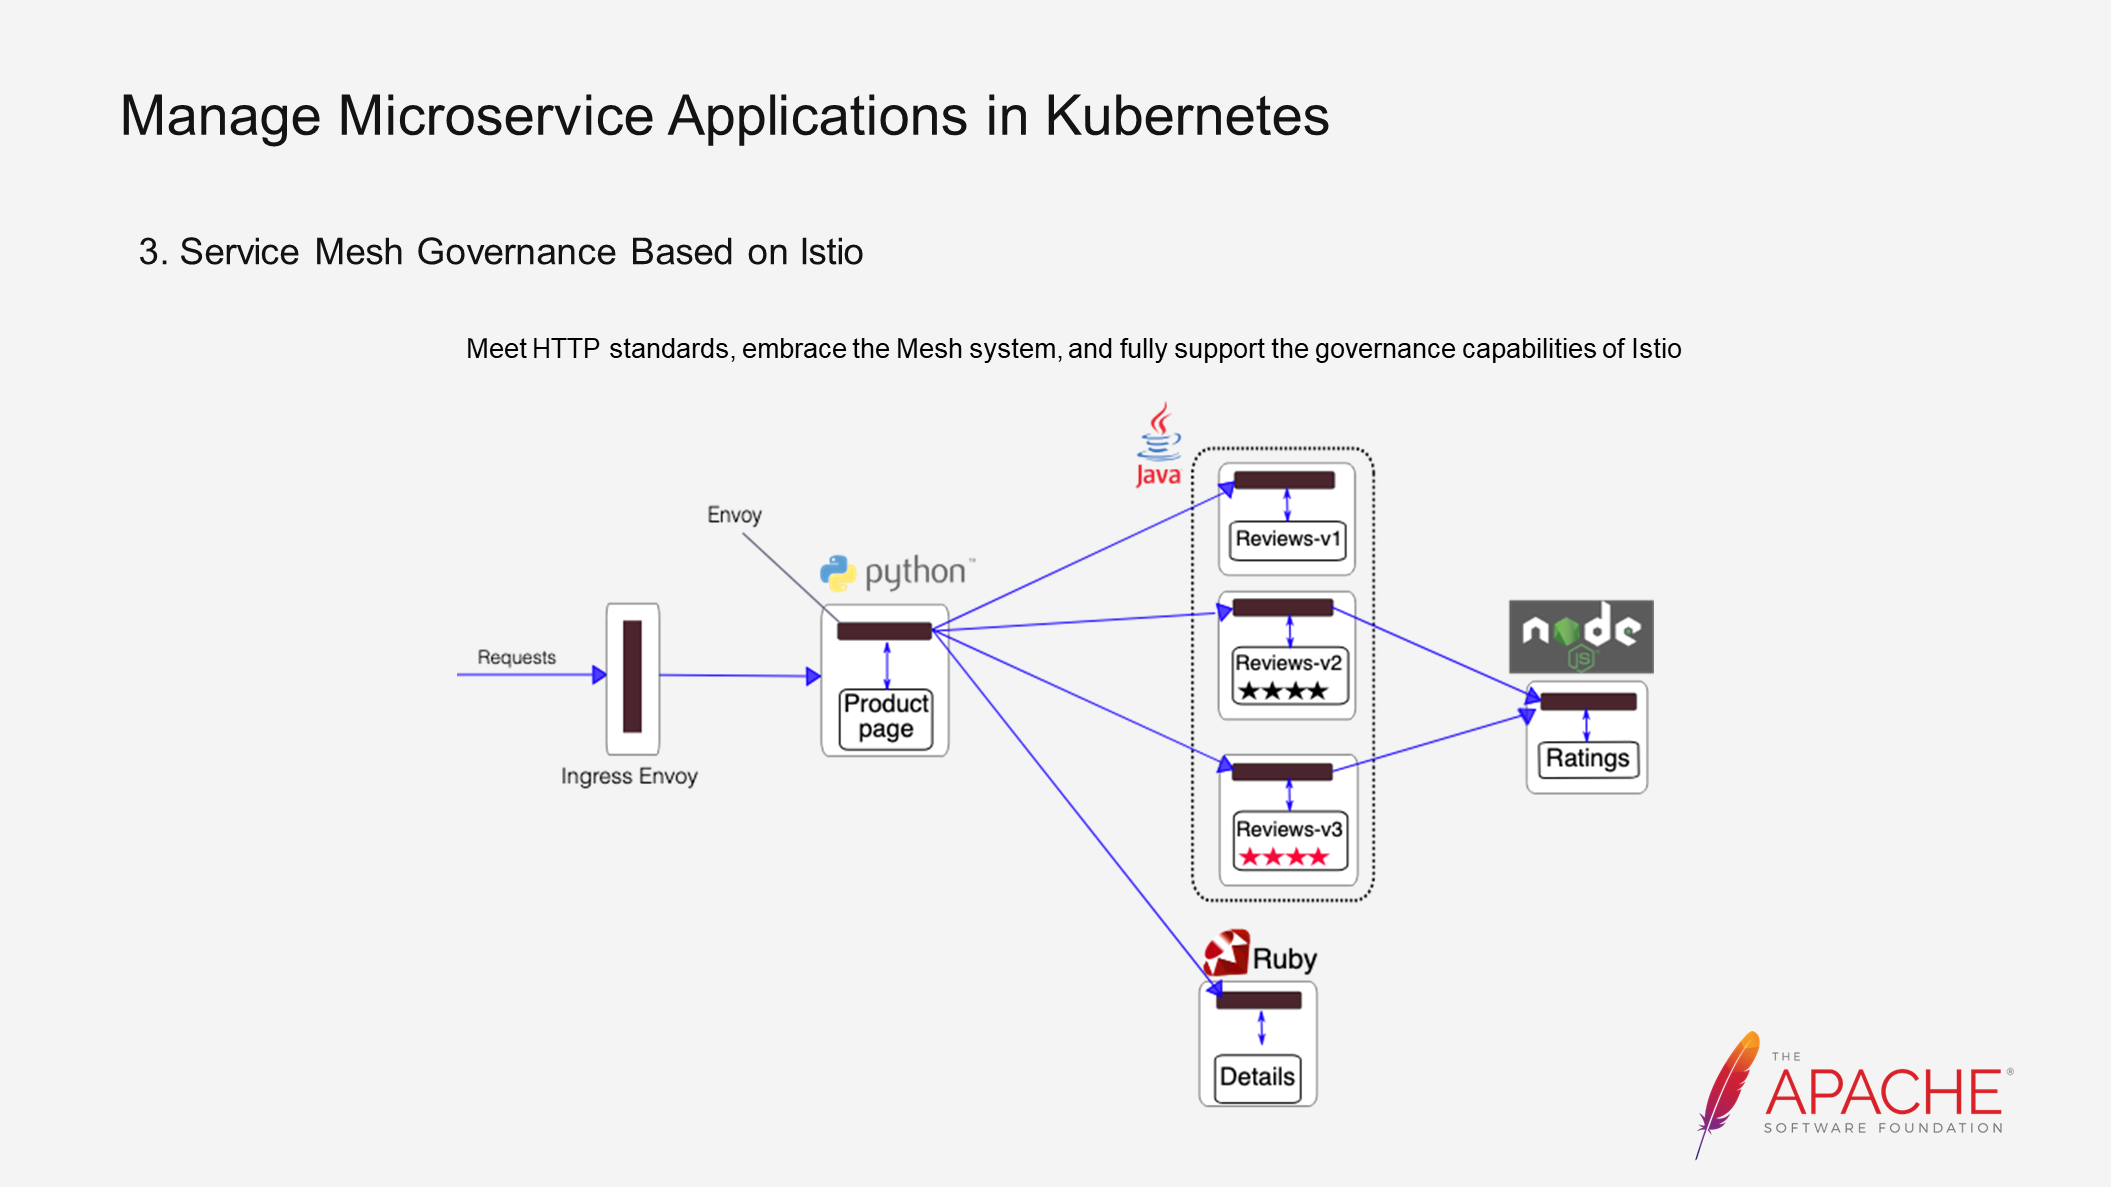
In addition, by utilizing Istio's Service Mesh governance, we have selected the Triple protocol, which is based entirely on HTTP standards. Therefore, after implementing Istio's entire system, all that is required is to mount the sidecar, which will handle traffic governance. However, it is important to note that the protocol must be visible to Istio for this to work.
For instance, if you were originally using the private TCP protocol of Dubbo 2, Istio would have difficulty deciphering the content of your protocol. By using the Triple protocol, which is based on HTTP standards, the content in your header can be understood and traffic can be forwarded accordingly. This allows for full integration with the Mesh system and supports all of Istio's governance capabilities.
This article uses the Bookinfo example to explain how to initialize a project using the new version of Starter, deploy applications rapidly using various cloud-native tools, and perform online diagnosis and analysis using Dubbo's native observability. It provides a comprehensive guide from project initialization to online deployment, serving as a replicable and scalable template for users interested in developing microservices under Kubernetes.
Best Practices of OpenSergo and Dubbo Microservices Governance
Triple-based Implementation of Full Access to the Web Mobile Backend

514 posts | 50 followers
FollowAlibaba Developer - October 13, 2020
Alibaba Cloud Native - September 8, 2022
Alibaba Cloud Native - November 3, 2022
Alibaba Developer - May 20, 2021
Aliware - August 18, 2021
Alibaba Cloud Native - October 9, 2021

514 posts | 50 followers
Follow Best Practices
Follow our step-by-step best practices guides to build your own business case.
Learn More Microservices Engine (MSE)
MSE provides a fully managed registration and configuration center, and gateway and microservices governance capabilities.
Learn More Managed Service for Prometheus
Multi-source metrics are aggregated to monitor the status of your business and services in real time.
Learn MoreMore Posts by Alibaba Cloud Native Community