Bolster the growth and digital transformation of your business amid the outbreak through the Anti COVID-19 SME Enablement Program. Get a $300 coupon package for all new SME customers or a $500 coupon for paying customers.
By Guo Xudong from the MVP team.
Faced with the grave danger of the coronavirus outbreak, China has taken strict precautions. Since January, real-time data about the outbreak has been constantly feed through different channels, like WeChat social media accounts, as well as Alipay's real-time outbreak tracking, and real-time epidemic news from the Sina News platform. All of these various social media platforms in China were able to display real-time epidemic dynamics to allow people to quickly understand the situation as it evolved and changed over time.
However, both all of these data pushes and presentation services gave the same information to everyone. In other words, users cannot personalize these services to display the data of what they're most interested in. Therefore, it is necessary to create a dashboard to dynamically display epidemic data.
When considering dashboards, we naturally thought first of Grafana, a multi-platform open-source analytic and interactive visualization software released in 2014. When connected to supported data sources, Grafana dashboards display web-based charts and can send alerts. Users can expand the capabilities of Grafana by using plug-ins. This allows for interactive queries and the display of complex monitoring dashboards.
To clarify our objectives, we need to customize a dashboard to display the epidemic status. As I am currently in Shanghai, I want to display the number of confirmed cases, suspected cases, recoveries, and deaths nationwide and in Shanghai. At the same time, I want to display the case curve to observe the development trend of the epidemic and show the situation in each province and each district in Shanghai.
Grafana is simply a tool for displaying data, so you need to obtain data sources first. Currently, no available epidemic data source can be directly integrated with Grafana. So, it make it happen, you need to do the following:
Here, we use Python Bottle to develop a data source. You can also choose Flask, which is the alternative with equivalent capabilities. The reason we decided to use Bottle is that it had been used to develop previous Grafana data sources. The debugging configuration and even the Dockerfile for building the Docker image and the deploy.yaml file for deploying Kubernetes are also available and ready to use. It is very easy to use Python to develop Grafana data sources. You simply need to ensure that the data meets the format requirements of SimpleJson. You can read Oz Nahum Tiram's blog post titled Visualize Almost Anything with Grafana and Python to learn how to use Python to develop data sources for Grafana.
You can use two following types of data during data source customization.
Timeseries Type DataTo present real-time epidemic trends for China and specifically for Shanghai, we can show the numbers of confirmed cases, suspected cases, recoveries, and deaths, and the changes in this data compared with previous data. Also, we can draw curves to compare between confirmed and suspected cases and between recoveries and deaths.
For confirmed cases, we just need to combine the national number of confirmed cases, gntotal with the current timestamp and return the data. The other metrics can be processed in the same way.
@app.post('/query')
def query():
    print(request.json)
    body = []
    all_data = getDataSync()
    time_stamp = int(round(time.time() * 1000))
    for target in request.json['targets']:
    name = target['target']
    if name == 'gntotal':
        body.append({'target': 'gntotal', 'datapoints': [[all_data['gntotal'], time_stamp]]})
    body = dumps(body)
    return HTTPResponse(body=body, headers={'Content-Type': 'application/json'})
Table Type DataWe can use a table that maps the numbers of confirmed cases, suspected cases, recoveries, and deaths for each Chinese province and another table that gives the same data for each district in Shanghai.
We can extract names, confirmed cases, suspected cases, recoveries, and deaths from the data and append them to rows.
@app.post('/query')
def query():
    print(request.json)
    body = []
    all_data = getDataSync()
    sh_data = getShDataSync()
    if request.json['targets'][0]['type'] == 'table':
        rows = []
        for data in all_data['list']:
            row = [data['name'], data['value'], data['susNum'], data['cureNum'], data['deathNum']]
            rows.append(row)
        sh_rows = []
        for data in sh_data['city']:
            row = [data['name'], data['conNum'], data['susNum'], data['cureNum'], data['deathNum']]
            sh_rows.append(row)
        bodies = {'all': [{
            "columns": [
                {"text": "省份", "type": "name"},
                {"text": "确诊", " type": "conNum"},
                {"text": "疑似", " type": "susNum"},
                {"text": "治愈", "type": "cureNum"},
                {"text": "死亡", "type": "deathNum"}
            ],
            "rows": rows,
            "type": "table"
        }],
            'sh': [{
                "columns": [
                    {"text": "省份", "type": "name"},
                    {"text": "确诊", " type": "value"},
                    {"text": "疑似", " type": "susNum"},
                    {"text": "治愈", "type": "cureNum"},
                    {"text": "死亡", "type": "deathNum"}
                ],
                "rows": sh_rows,
                "type": "table"
            }]}

        series = request.json['targets'][0]['target']
        body = dumps(bodies[series])
return HTTPResponse(body=body, headers={'Content-Type': 'application/json'})In general, four panels are used for data display.
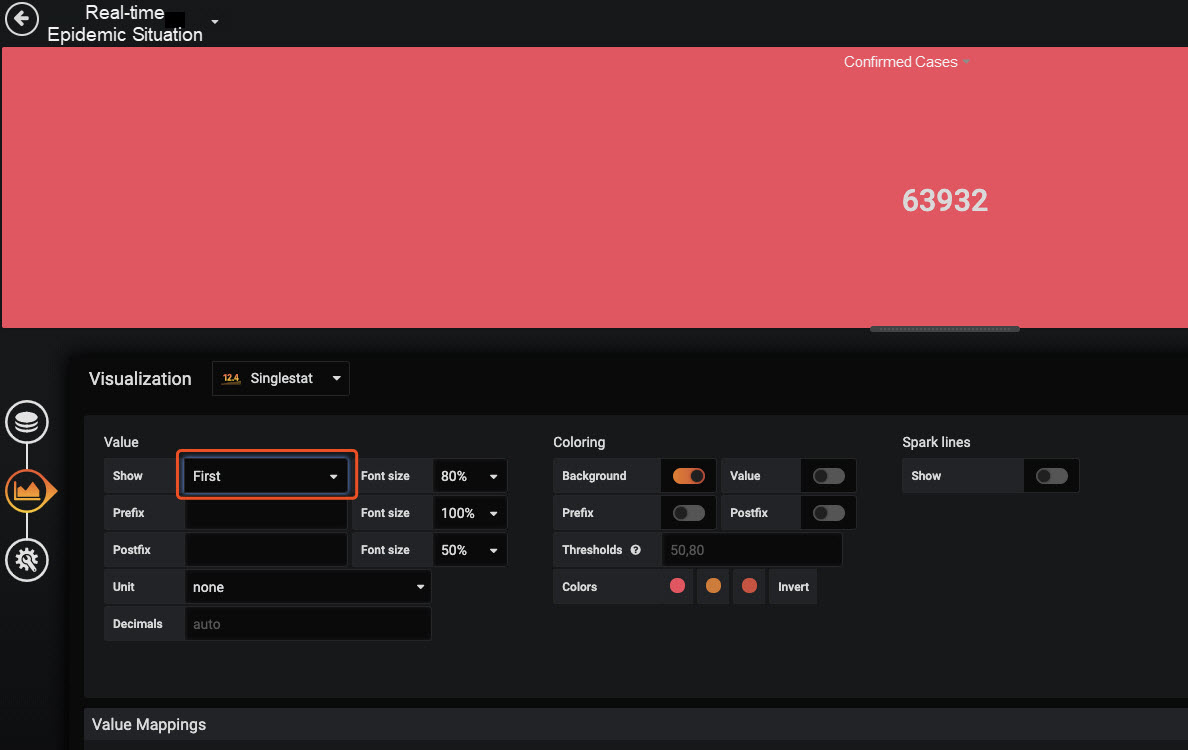
Singlestat is used to display case numbers.Graph is used to display comparison curves.Table is used to display tables.Text is used for text titles.Now, it's time to configure the data source.
There is only one value here, so you can choose First.
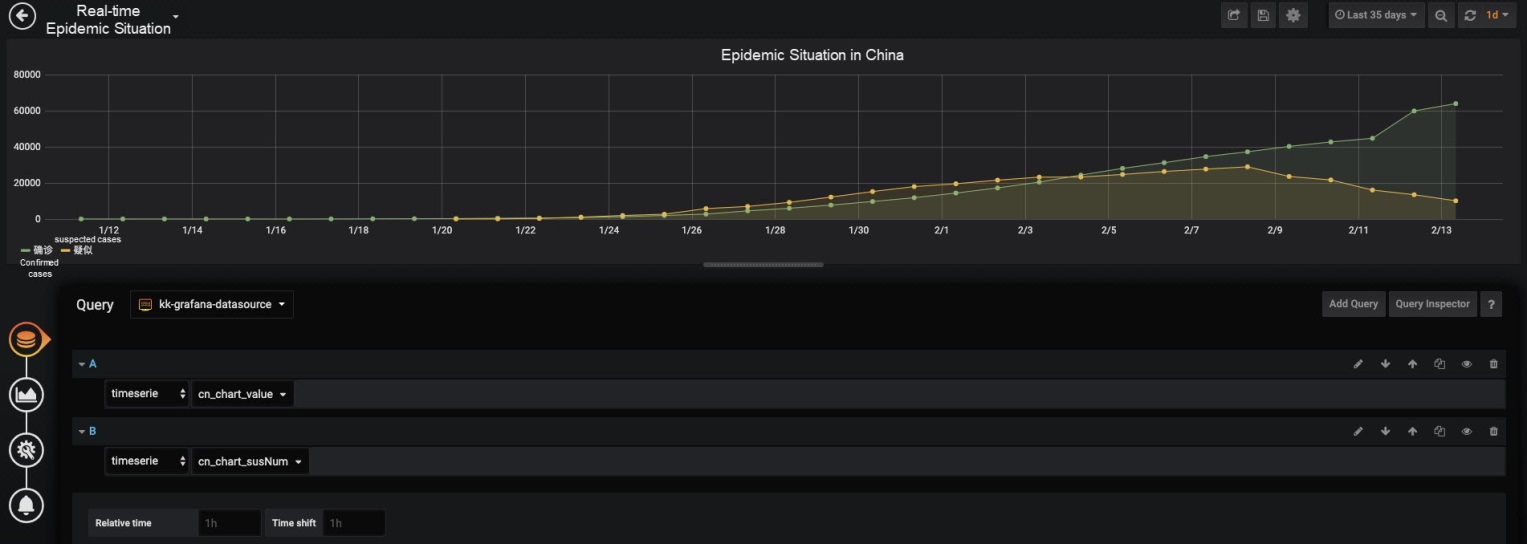
These graphs compare the numbers of confirmed and suspected cases and recoveries and deaths.
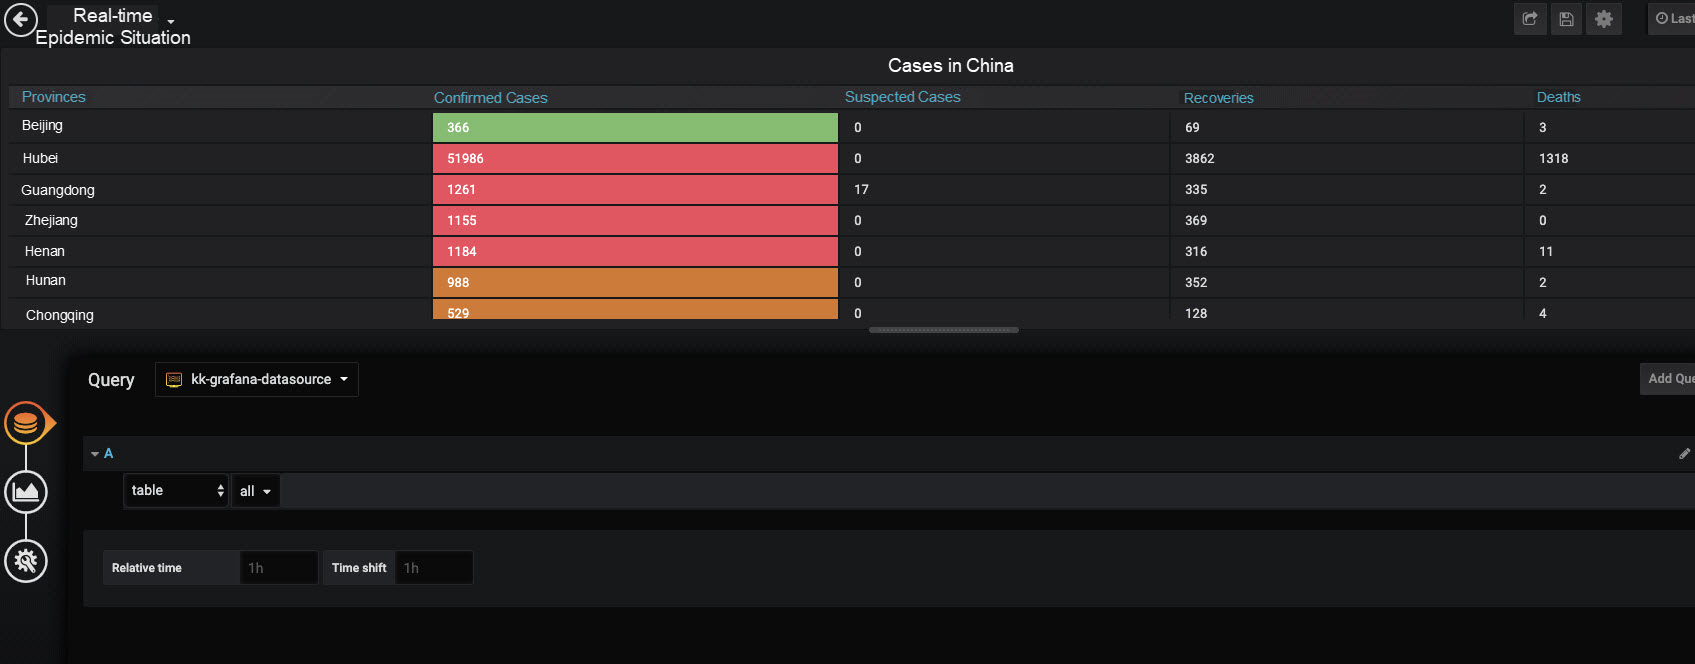
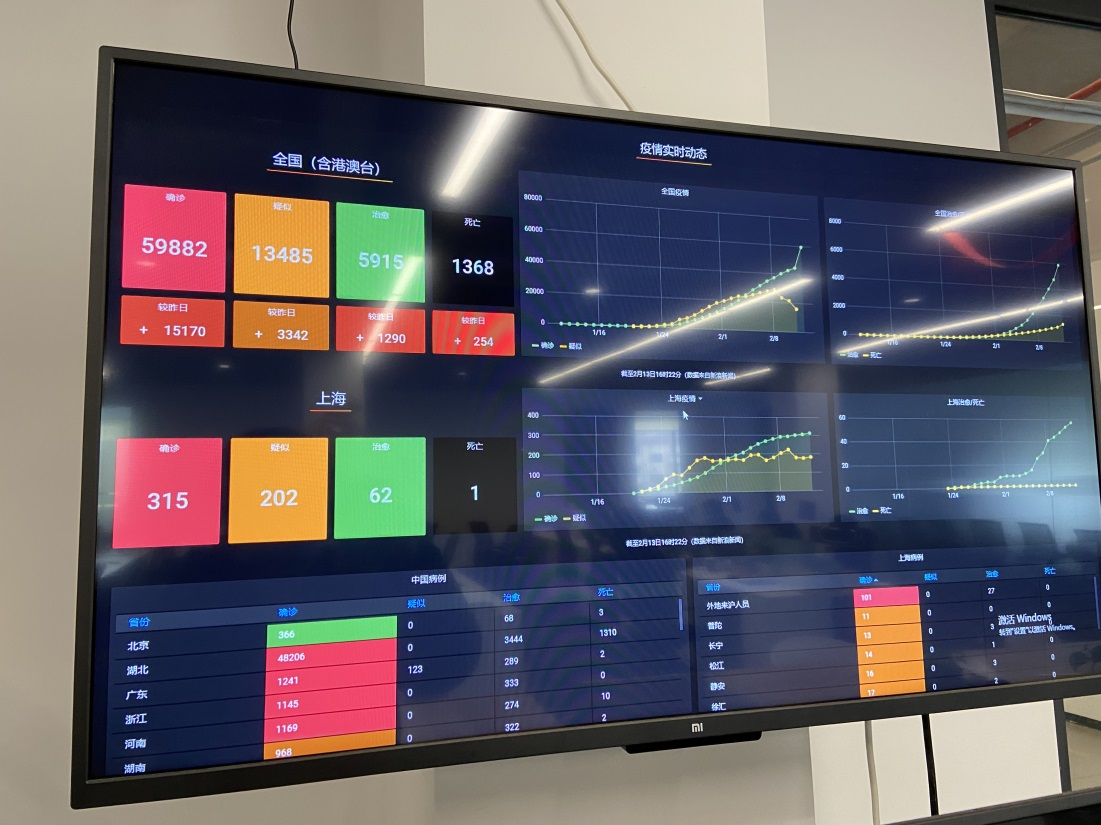
The overall result is acceptable and is used as the company's epidemic situation dashboard. Here, our company uses a TV with a relatively small screen, so the font and display panels have been enlarged for better demonstration purposes.
After the code is packaged into a Docker image, you can run the code in any environment or in a Kubernetes cluster. The image has been uploaded to Docker Hub, from where you can pull it for immediate use.
# Dockerfile
FROM python:3.7.3-alpine3.9

LABEL maintainer="sunnydog0826@gmail.com"

COPY . /app

RUN echo "https://mirrors.aliyun.com/alpine/v3.9/main/" > /etc/apk/repositories \
    && apk update \
    && apk add --no-cache gcc g++ python3-dev python-dev linux-headers libffi-dev openssl-dev make \
    && pip3 install -r /app/requestments.txt -i http://mirrors.aliyun.com/pypi/simple --trusted-host mirrors.aliyun.com

WORKDIR /app

ENTRYPOINT ["uwsgi","--ini","uwsgi.ini"]docker pull guoxudongdocker/feiyan-datasourcedocker run -d --name datasource -p 8088:3000 guoxudongdocker/feiyan-datasourceSelect a SimpleJson data source, click Add, and enter the data source address.
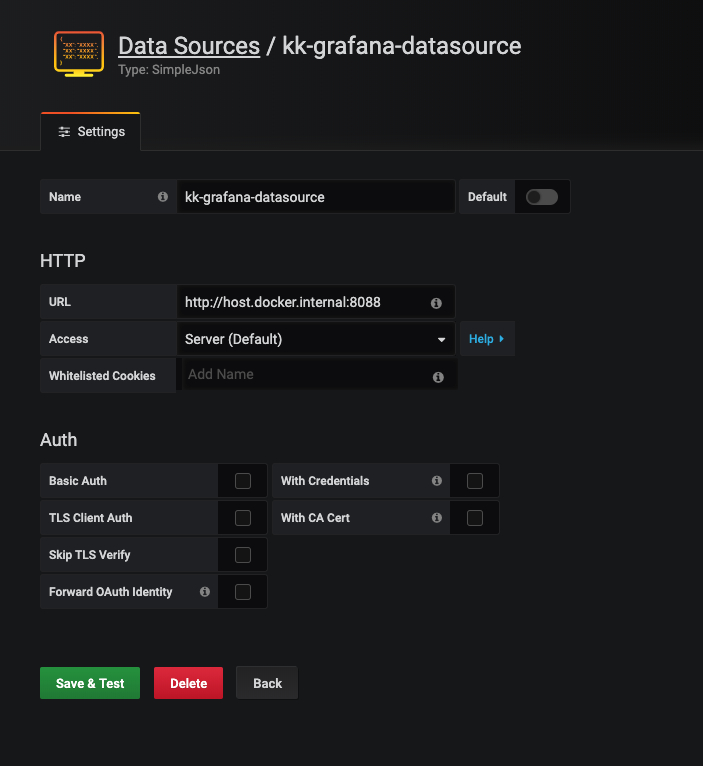
Click Upload.json file and select wuhan2020-grafana/dashboard.json.
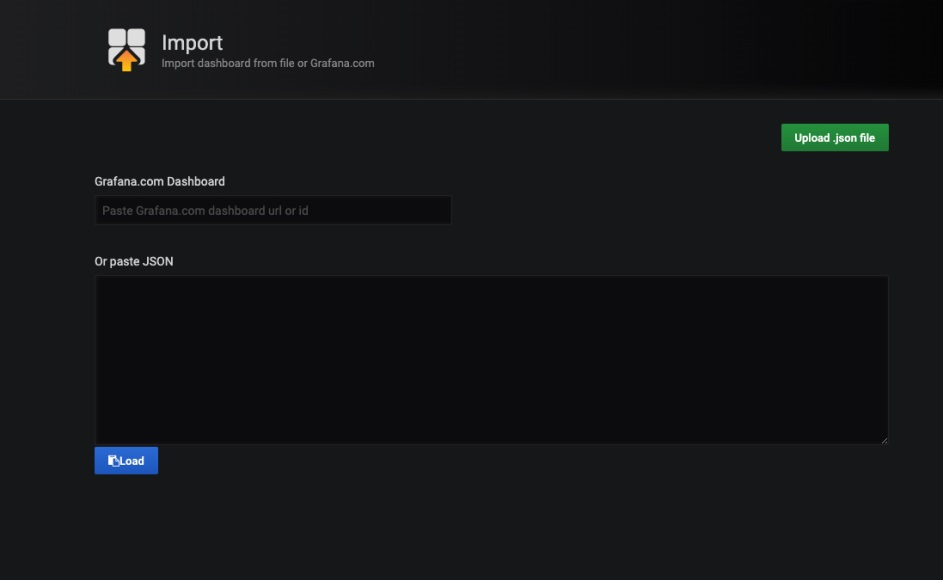
kubectl apply -f deploy.yamlAt the time I'm writing this in mid February, the number of confirmed cases in China is still increasing quickly, but fortunately the growth rate in the number of suspected cases has begun to decline. We can see that the rate of growth in confirmed cases is steadily increasing, and the number of recoveries is also increasing. Compared with other regions, Shanghai has not seen a large increase in the number of cases even though many people have returned to work. As a part of this, the strict control measures adopted by residential communities are beginning to show an effect. Currently, Shanghai still has only one death as well as the first recorded recovery in China. In general, as long as we pay attention to prevention and stay at home, we can definitely overcome the epidemic and get through this difficult time.
The JSON file for importing the dashboard and the YMAL file for deploying Kubernetes can be found on GitHub. The project address is here: https://github.com/sunny0826/wuhan2020-grafana.
While continuing to wage war against the worldwide outbreak, Alibaba Cloud will play its part and will do all it can to help others in their battles with the coronavirus. Learn how we can support your business continuity at https://www.alibabacloud.com/campaign/fight-coronavirus-covid-19
Alibaba Cloud's Providing Efficient Gene Sequence Retrieval for COVID-19 Sequence Analysis
See How a Professional Translation Platform's Helping Experts Fight the Coronavirus

2,593 posts | 793 followers
FollowAlibaba Clouder - April 26, 2020
Alibaba Clouder - April 3, 2020
Alibaba Clouder - April 29, 2020
Alibaba Clouder - April 3, 2020
Alibaba Cloud Native Community - July 22, 2022
Alibaba Clouder - March 24, 2020

2,593 posts | 793 followers
Follow Container Service for Kubernetes
Alibaba Cloud Container Service for Kubernetes is a fully managed cloud container management service that supports native Kubernetes and integrates with other Alibaba Cloud products.
Learn More MaxCompute
Conduct large-scale data warehousing with MaxCompute
Learn More Platform For AI
A platform that provides enterprise-level data modeling services based on machine learning algorithms to quickly meet your needs for data-driven operations.
Learn MoreMore Posts by Alibaba Clouder