In order to win this inevitable battle and fight against COVID-19, we must work together and share our experiences around the world. Join us in the fight against the outbreak through the Global MediXchange for Combating COVID-19 (GMCC) program. Apply now at https://covid-19.alibabacloud.com/
By Ding Laiqiang (Chengzhe) from Alibaba Cloud Storage team
Based on the current situation of the COVID-19 outbreak in China, Alibaba Cloud has built a free real-time and visualized COVID-19 analysis platform by using Alibaba Cloud Log Service technologies. This platform keeps the public informed about the COVID-19 outbreak in real time, and facilitates research that uses the outbreak data. Ding Laiqiang, an Alibaba Cloud Log Service expert, introduced the mechanism of the outbreak situation dashboard, and analyzed the current trends based on the data from the dashboard.
On January 20, 2020, Alibaba Cloud built a real-time outbreak situation dashboard and analysis platform using publicly available data provided by governmental authorities. The following figure shows the structure of the platform. Alibaba Cloud organizes scattered data and draws different visual graphs based on various data analysis methods. On the platform, users can not only view relevant data as needed, but also integrate data in real time based on the platform and customize early warning services about the outbreak situation.
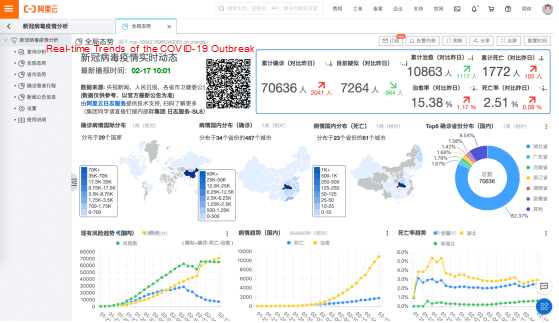
Free Outbreak Analysis Platform
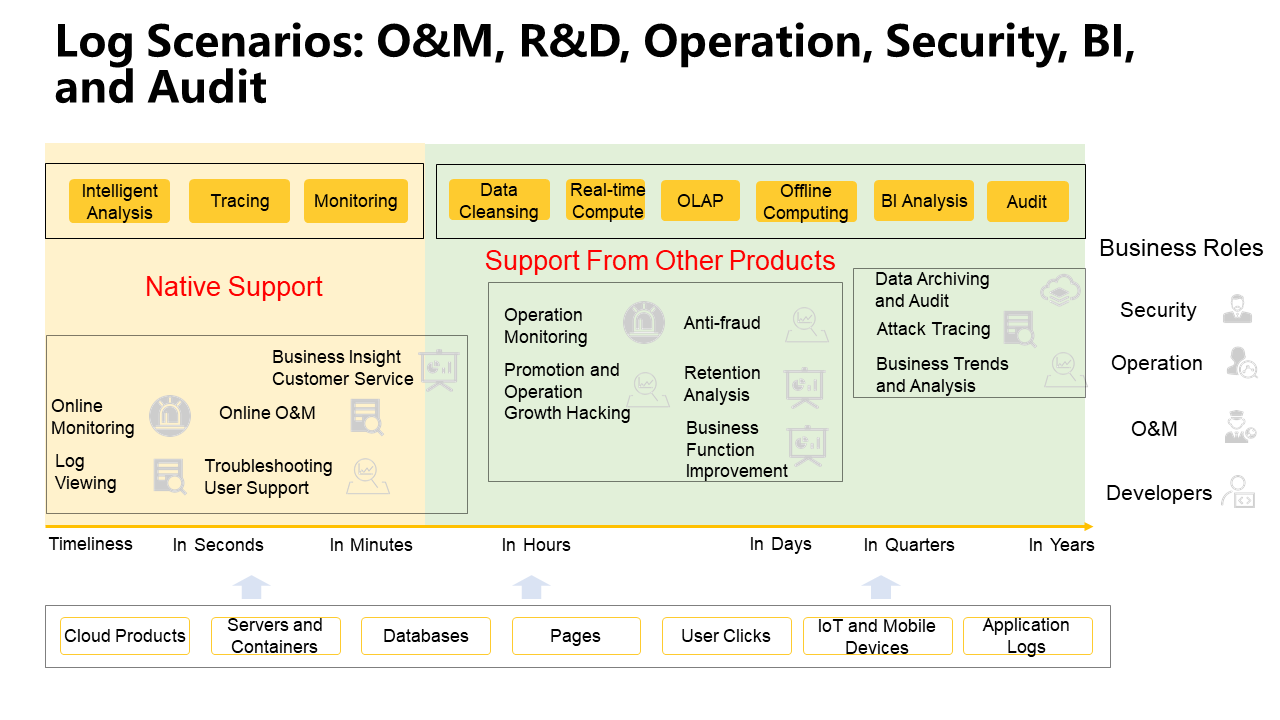
The real-time outbreak analysis platform is built based on Alibaba Cloud Log Service technologies. Log Service is an integrated log data service provided by Alibaba Cloud. It helps customers quickly collect, consume, deliver, query, and analyze log data without performing development. In addition, it helps improve the O&M and operating efficiency, enabling users to process a massive volume of logs in the DT era. The following figure shows the scenarios of Alibaba Cloud Log Service.
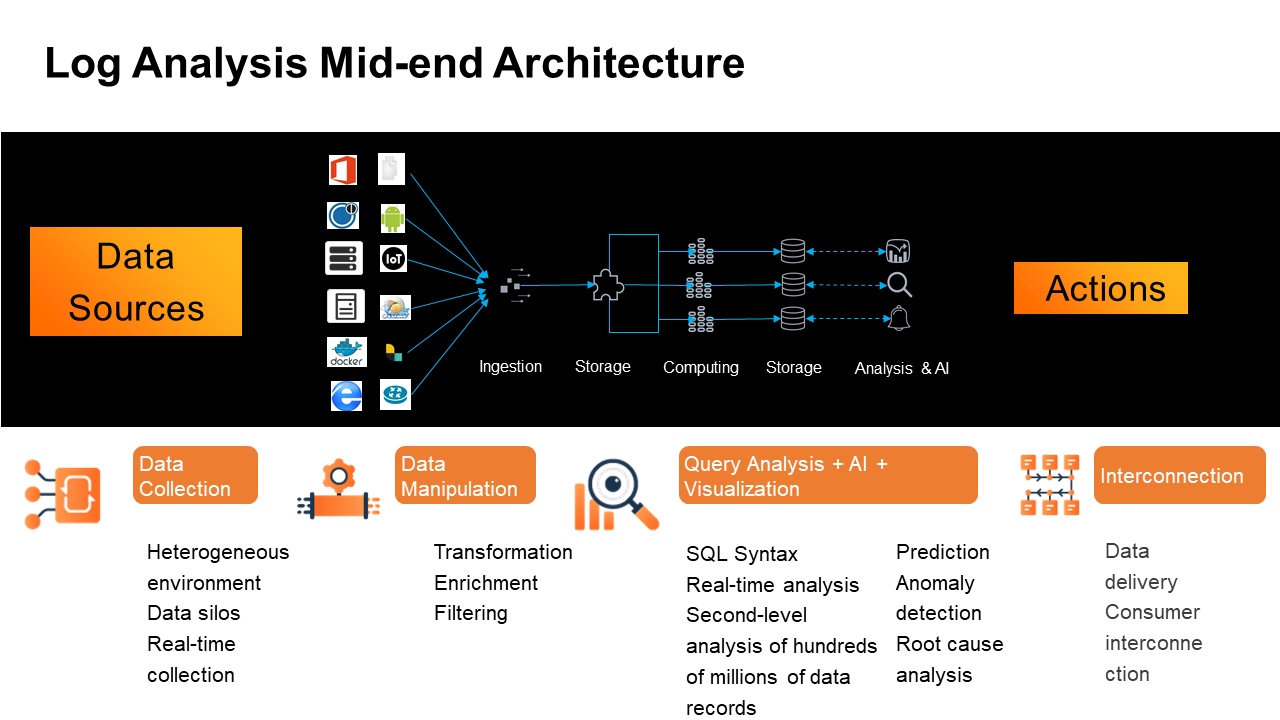
The following figure shows the log analysis mid-end architecture in Log Service. The architecture consists of four parts: data collection, data manipulation, AI-based visual queries and analysis, and modules interconnected with relevant platforms. The log analysis mid-end architecture provides advantages such as rapid data analysis within seconds and powerful real-time analysis capabilities. This meets the actual needs for real-time analysis of the outbreak. Therefore, Alibaba Cloud built a real-time outbreak situation analysis dashboard based on this architecture.
The real-time outbreak situation analysis dashboard is open to the public. Users can access the dashboard by accessing the URL: https://1340796328858956.cn-shanghai.fc.aliyuncs.com/2016-08-15/proxy/demo/slsconsole/?redirect=true&type=2020
Alibaba Cloud has adapted the dashboard to mobile devices. Users can gain access to the dashboard through DingTalk, WeChat, and other platforms. The dashboard provides abundant data on the outbreak situation for users to capture and analyze. The daily dashboard updates the latest national data three to four times a day after being reviewed by the platform administrator.
Note: You do not need to log on to the dashboard. The dashboard is read-only. We recommend that you use the comprehensive outbreak analysis platform, which is free of charge.
To gain access to the platform, you need to log on to the Alibaba Cloud Console and click Log Service on the page that appears or directly visit https://sls.console.aliyun.com/
Then, on the homepage, click COVID-19 Outbreak Analysis. On the page that appears, click Initial Configuration to configure the dashboard as required. The data will be automatically synchronized, and you do not need to configure the dashboard again. You can perform interactive searches and analysis, visualize the data, subscribe to the dashboard, generate alerts, and carry out secondary development, without operation restrictions. This analysis platform is free of charge.
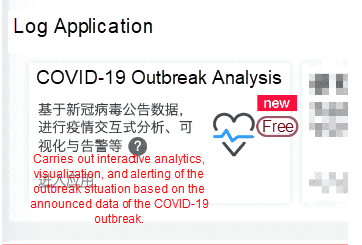
The real-time outbreak analysis dashboard is built based on the data provided by authorities. In the core metrics section of the dashboard, users can view the six main metrics of the current national cases: the cumulative number of confirmed cases, the cumulative number of suspected cases, the cumulative number of recovered persons, the cumulative number of deaths, the recovery rate, and the mortality rate. In the dashboard, the increase over the previous day's numbers is displayed on the right side of the core metrics in a smaller font using different colors.

Below the core metrics module, the dashboard uses three different data maps to display the current distribution of cases around the globe, cases in China, and confirmed deaths in China. According to maps and province-wise statistics, the outbreak is currently concentrated in Hubei Province and its six surrounding provinces: Henan, Anhui, Zhejiang, Guangdong, Hunan, and Jiangxi. Relatively few cases are confirmed in other regions of China. On the right side of the map, a pie chart is displayed to show the percentages of confirmed cases in the six provinces with the most cases outside Hubei Province, and the percentage of confirmed cases in the remaining provinces in the country.

The dashboard also provides outbreak trend charts. The trend chart module consists of three images: the current risk trend, the death and recovery trends, and the mortality rate trend.

The dashboard provides data tables of the outbreak distribution inside China and around the world for users to query. Important data is marked in red and green in the data tables for ease of reading. Users can sort and query the data in each column of the tables.
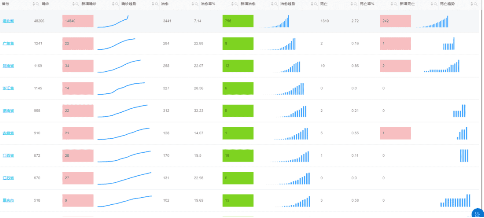
Users can click a province name to view the details about the outbreak in the province. In addition, users can randomly create similar data dashboards as needed. On the upper-left corner of the detailed dashboard, users can use the filter to select a specific province and city to analyze the outbreak data. After filtering, the data in the core metrics module, trend charts, and outbreak distribution data tables on the detailed dashboards will be changed to show the data of the selected province and city, which facilitates in-depth analysis by users.
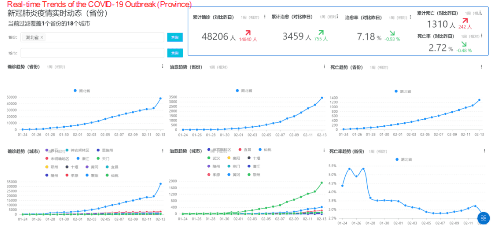
For example, we can select Hubei Province and then select Wuhan, Xiaogan, Huanggang, and Suizhou, where the COVID-19 outbreak is most serious. Based on data queries for Wuhan, Xiaogan, Huanggang, and Suizhou, we can see that the cases in Wuhan account for a large percentage both in the province and the whole country. The mortality rate in Wuhan is continuously higher than that in Xiaogan, Huanggang, and Suizhou. As the area hit worst by the outbreak, Wuhan is expected to remain the country's main battlefield against the outbreak for a period of time to come. In contrast, the mortality rates in Xiaogan, Huanggang and Suizhou, which are located around Wuhan, have remained at about 2% and are gradually declining, indicating a better situation than in Wuhan.
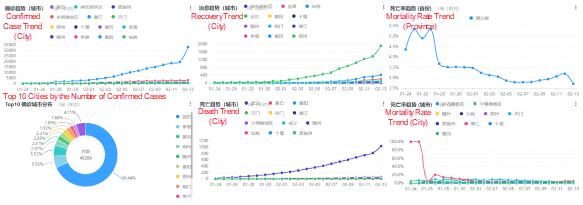
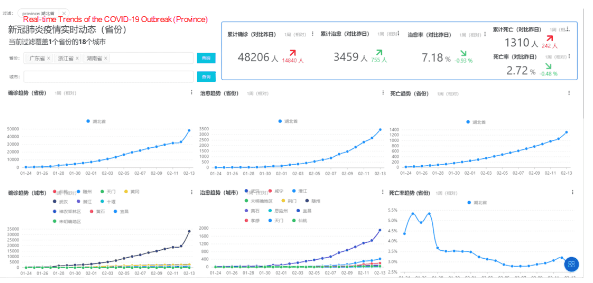
In the province filter, users can enter a province name to obtain the detailed dashboard for the province. Then, users can select a city belonging to the selected province from the City drop-down list to carry out a comparative analysis of the data between the province and the city.
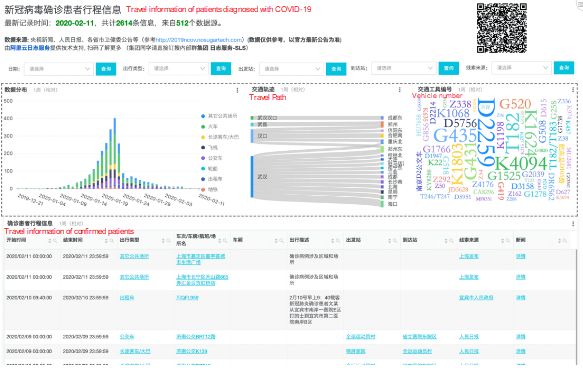
The COVID-19 Outbreak Analysis application allows you to track the travel history of confirmed cases. For example, you can query flights that have recently been taken by confirmed cases. This helps you to promptly identify the potential risks caused by confirmed cases by using travel history.
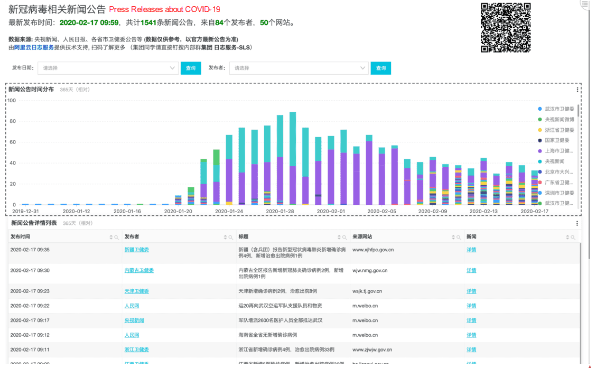
The COVID-19 Outbreak Analysis application also provides a summary of news announcements to help users learn more.
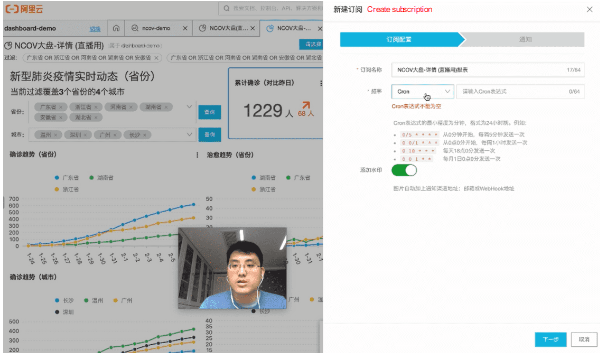
Users can subscribe to the dashboard to stay informed about the outbreak. When subscribing, users can specify attributes such as the push frequency and the push channel.
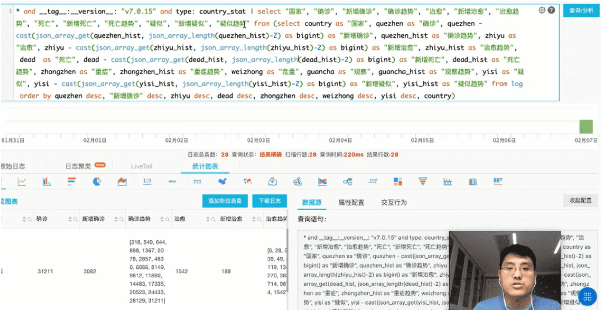
Data on the dashboard is created and called based on SQL scripts. Users can add the name of the desired country or region to the script to specify early warning for new cases in this country or region. Early warnings can be sent to users' devices through SMS messages, voice messages, email, the WebHook-DingTalk robot, the WebHook-custom, and the notification center. When a new case occurs in the selected country or region, the user will receive a system early warning message.
Note: This feature is only available for the free Outbreak Situation Analysis application.
Log on to the Log Service console. On the COVID-19 Outbreak Analysis page at https://sls.console.aliyun.com/lognext/app/ncp/setting , you can open the outbreak situation dashboard by clicking Query and Analysis in the left-side navigation pane. Alternatively, you can directly visit the URL of the read-only demo dashboard at https://1340796328858956.cn-shanghai.fc.aliyuncs.com/2016-08-15/proxy/demo/slsconsole/?redirect=true&type=2020 . To view the SQL scripts that run the dashboard, click View Detailed Analysis on the desired module. In the raw logs, you can query complex raw data, such as the version information of the dashboard, statistical data for different places, and outbreak trend arrays for different places. By analyzing and calculating the raw data, the dashboard provides various statistical charts and trend charts.
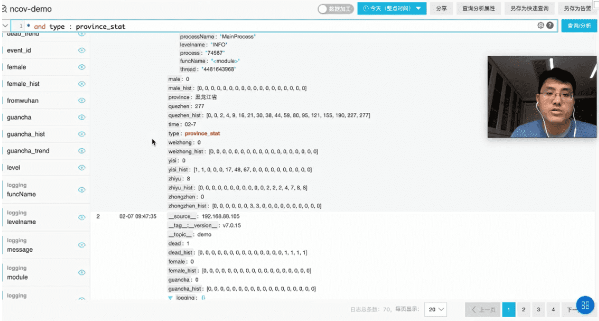
The following figure shows the log service script. The log service script is divided into two parts, which are separated by a vertical bar (|). The first part of the log consists of information such as the platform version number, query type, and queried region name. It is used as the raw log of the dashboard. The second part following the vertical bar (|) is SQL statements. The dashboard uses SQL statements to query, sort, and compute associated data. Log data includes various information such as the historical data and growth trends of the queried region. Users can retrieve the data for analysis.
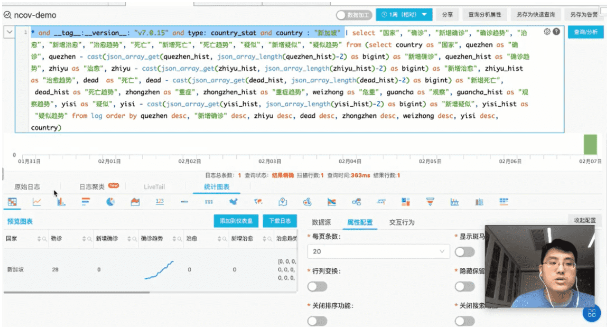
Users can create custom filters as needed by using the edit feature provided on the outbreak situation filter. The province and city names in the filter menu are dynamically generated by the server. The cities in the second-level menu vary with the province selected from the first-level menu.
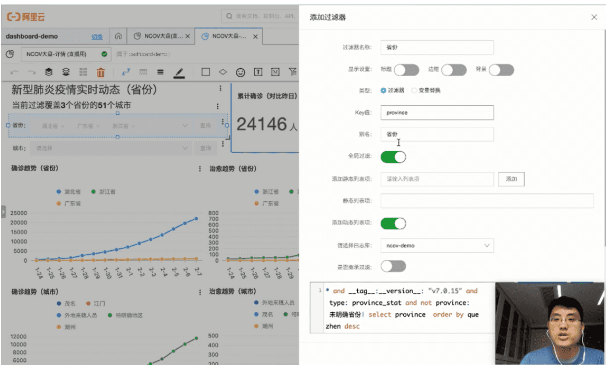
Users can click Download Log in the outbreak situation data table to retrieve all the data from the table. By importing the data to a user's engineering project, the user can perform write operations on the data.
In the Outbreak Analysis application, users can retrieve data by using OpenAPI, SDKs, and command-line tools.
The outbreak situation dashboard is built based on the SLS data processing ecosystem of Alibaba Cloud. Therefore, it can be connected to the data computing services in Alibaba Cloud. Log Service provides a variety of access methods. Users can scan the QR code for the outbreak situation dashboard to learn more about Alibaba Cloud Log Service.
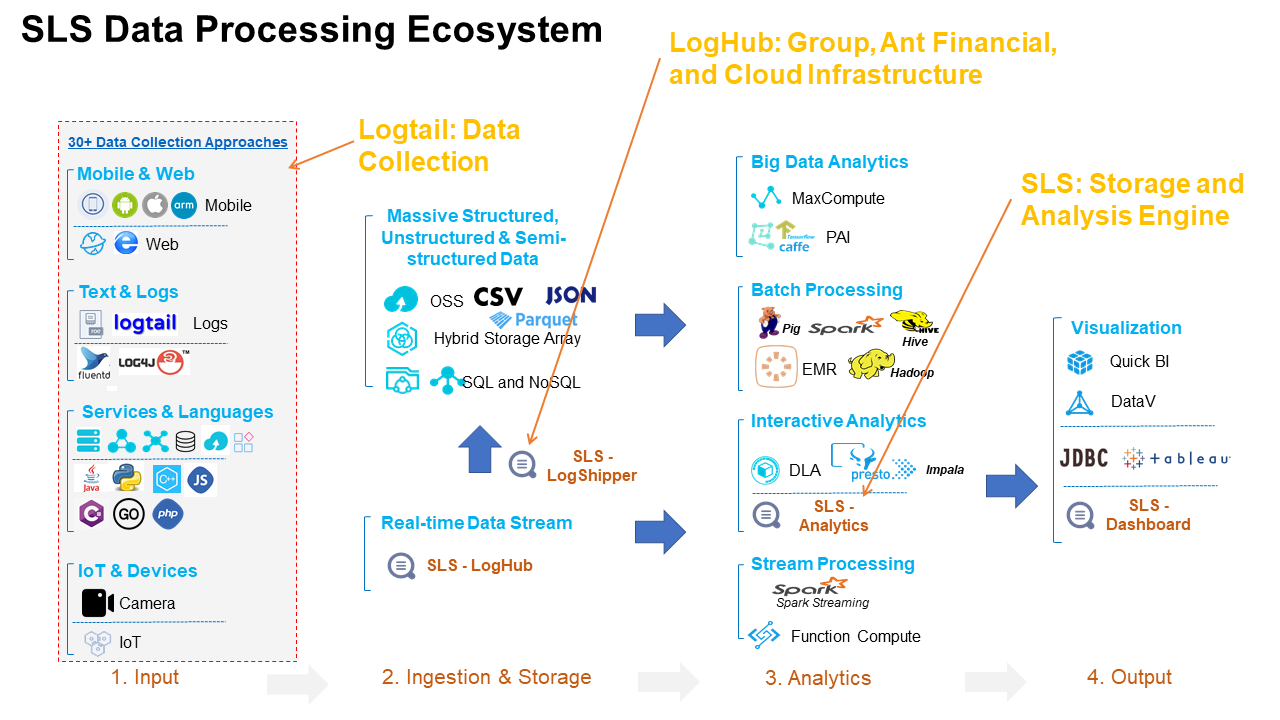
On the Log Service module at the official website of Alibaba Cloud, Alibaba Cloud has prepared more demos built based on Log Service for developers. If interested, you can find the URL in User Manual and Demos for Log Service and try out the demos.
While continuing to wage war against the worldwide outbreak, Alibaba Cloud will play its part and will do all it can to help others in their battles with the coronavirus. Learn how we can support your business continuity at https://www.alibabacloud.com/campaign/fight-coronavirus-covid-19
8 Ways Alibaba Cloud Security Is Supporting the Fight against COVID-19

2,593 posts | 793 followers
FollowAlibaba Clouder - March 16, 2020
Alibaba Clouder - April 26, 2020
Alibaba Clouder - April 13, 2020
Alibaba Clouder - April 29, 2020
Alibaba Clouder - April 2, 2020
Alibaba Clouder - April 3, 2020

2,593 posts | 793 followers
Follow Container Compute Service (ACS)
A cloud computing service that provides container compute resources that comply with the container specifications of Kubernetes
Learn More Container Service for Kubernetes
Alibaba Cloud Container Service for Kubernetes is a fully managed cloud container management service that supports native Kubernetes and integrates with other Alibaba Cloud products.
Learn More Simple Log Service
An all-in-one service for log-type data
Learn More Data Lake Storage Solution
Build a Data Lake with Alibaba Cloud Object Storage Service (OSS) with 99.9999999999% (12 9s) availability, 99.995% SLA, and high scalability
Learn MoreMore Posts by Alibaba Clouder