By Xujing
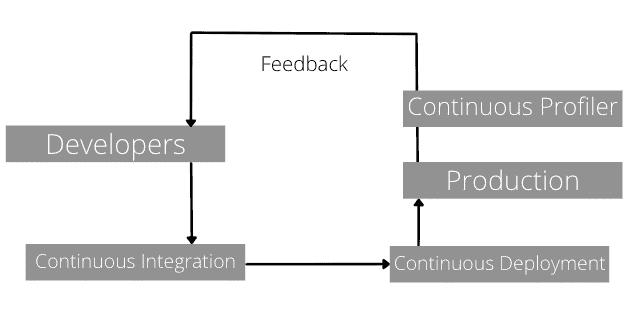
The concept of CI/CD is not the focus of this article and will not be discussed here. As shown in the figure, continuous profiling (CP) is an important means of feedback from production to development.
The origin of the CP concept comes from Google's paper [1]:
Google Wide Profiling: A Continuous Profiling Infrastructure for Data Centers
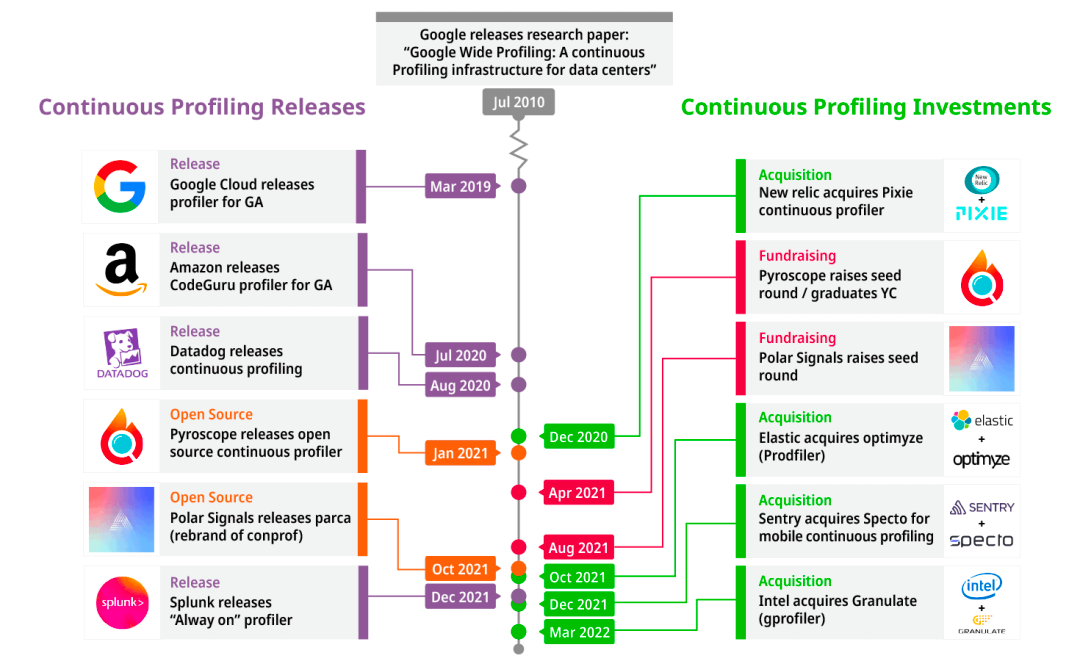
The CP meaning can be broken down into two parts.
The most direct way to measure the performance of a program is through response time (RT). Only knowing the running time of the program is difficult for us to optimize the program. We want to learn more about what happened during this time.
Let's start with an example to understand what time statistics under Linux tell users.
Let's use Linux time to calculate the time consumption of two things:

The output of time tells the user three pieces of information.
Looking at the output of time, user + sys is not equal to real because the program is not always running on the CPU. It may be in a sleep and waiting state due to IO, Lock, etc. This period is neither user CPU time nor system CPU time.
Wall clock time is the concept corresponding to the output (real) of time, so you can see:
For a given thread (lightweight process on Linux): wall clock time = CPU time + off CPU time:
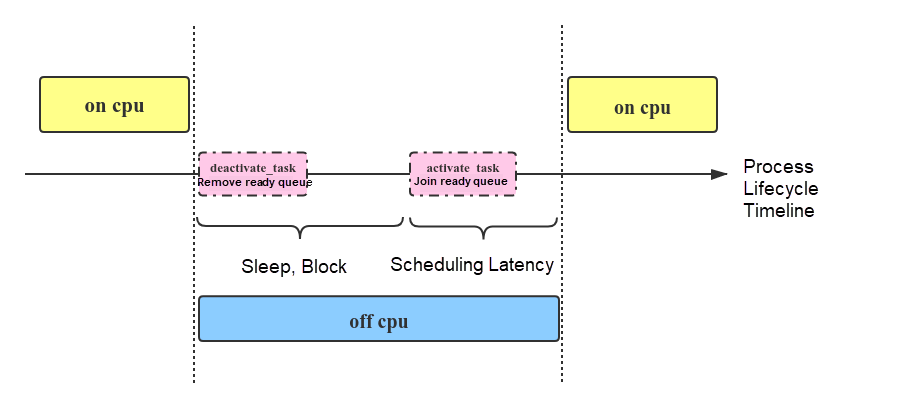
Therefore, Profile is divided into:
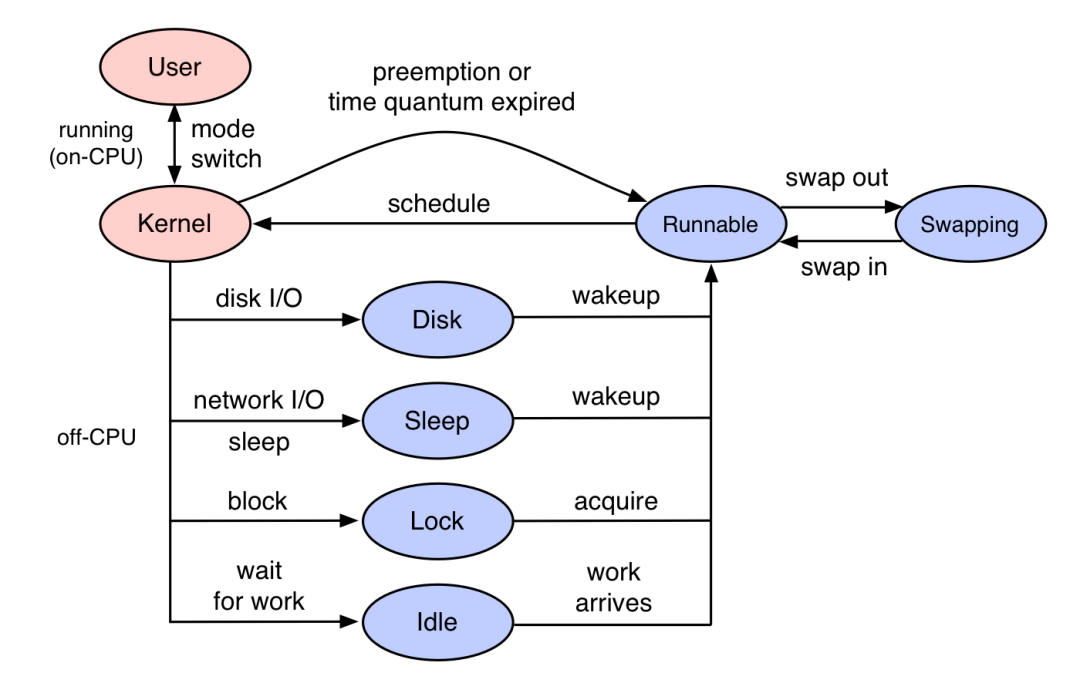
It can be seen that the Off-CPU analysis type is the summary statistics of a system result, so the Off-CPU can be further divided into file profiling, socket profiling, lock profiling, and other types due to different reasons causing sleep or waiting.
The relative concept of Continuous is On-Demand.
The more common problem with on-demand (or triggered) is the inability to accurately capture the scene, resulting in occasionally difficult to reproduce problems that cannot be identified.

For example, a curve like the one in the figure (no matter what it expresses) has an anomaly (or a situation different from most situations) over time. When the user finds this anomaly, the curve has already recovered, so he cannot go back to the scene. As such, we find an exception, but without more details. The developer can't know what's going on inside the code, so there's no way to fix and improve the code.
Continuous means that it goes through the entire lifecycle of the program and does not miss any historically generated exceptions.
The meaning of Continuous + Profiling to developers is that they always know all the execution details of the code in the production process.
Performance analysis is usually presented in the form of a Flame Graph.
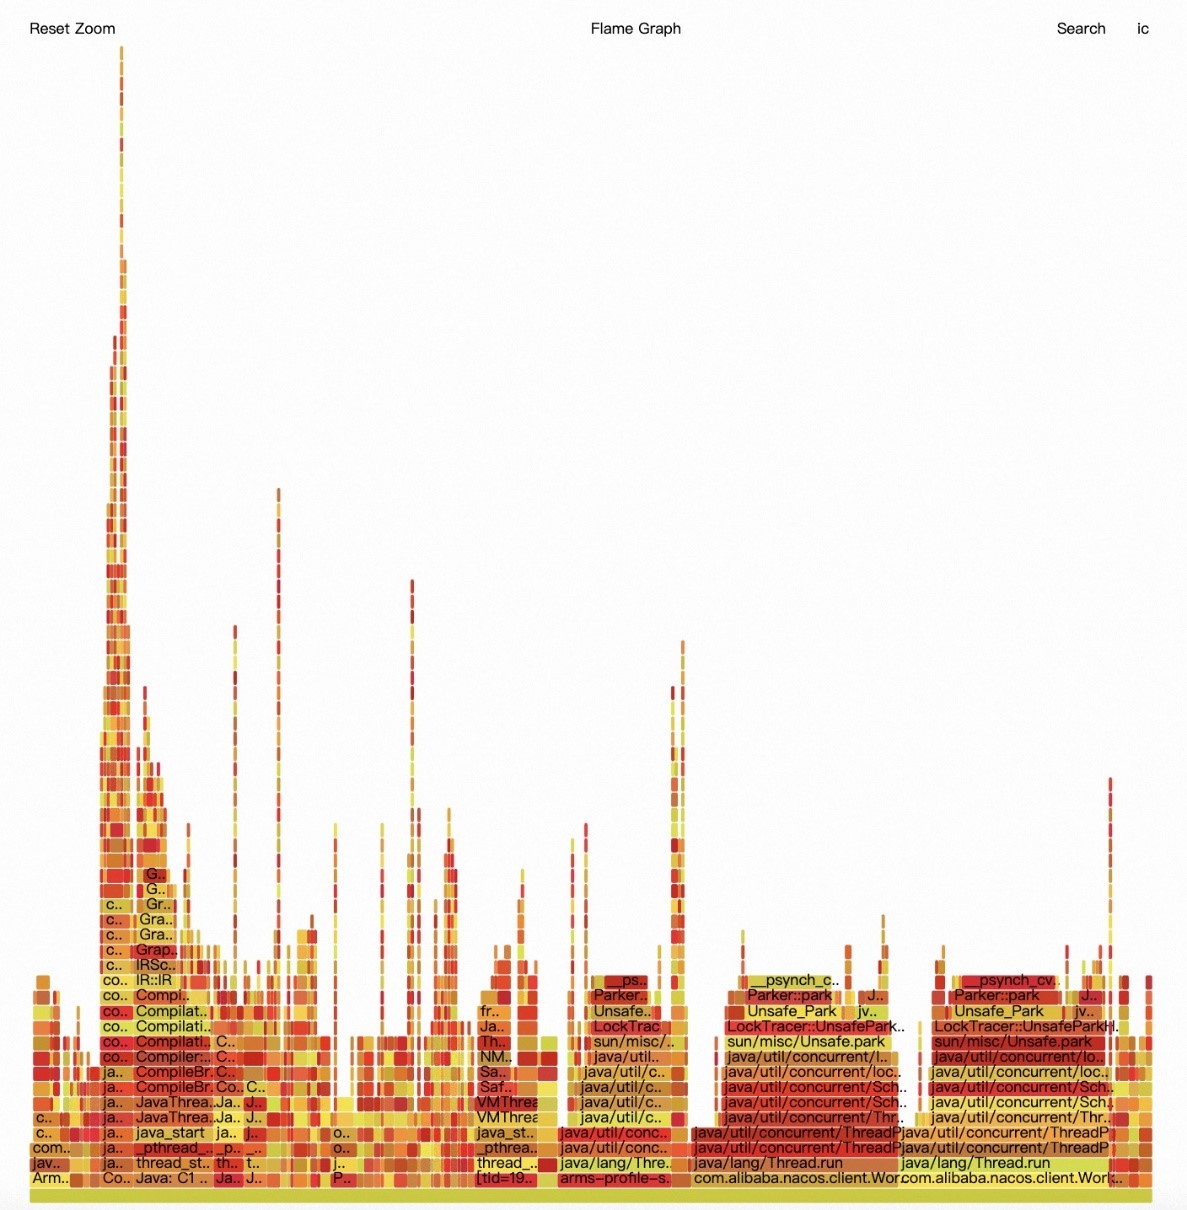
The essence of understanding the flame graph is to understand what profiling data is.
Profiling data is stack statistics. Here is a simple example to help you understand:
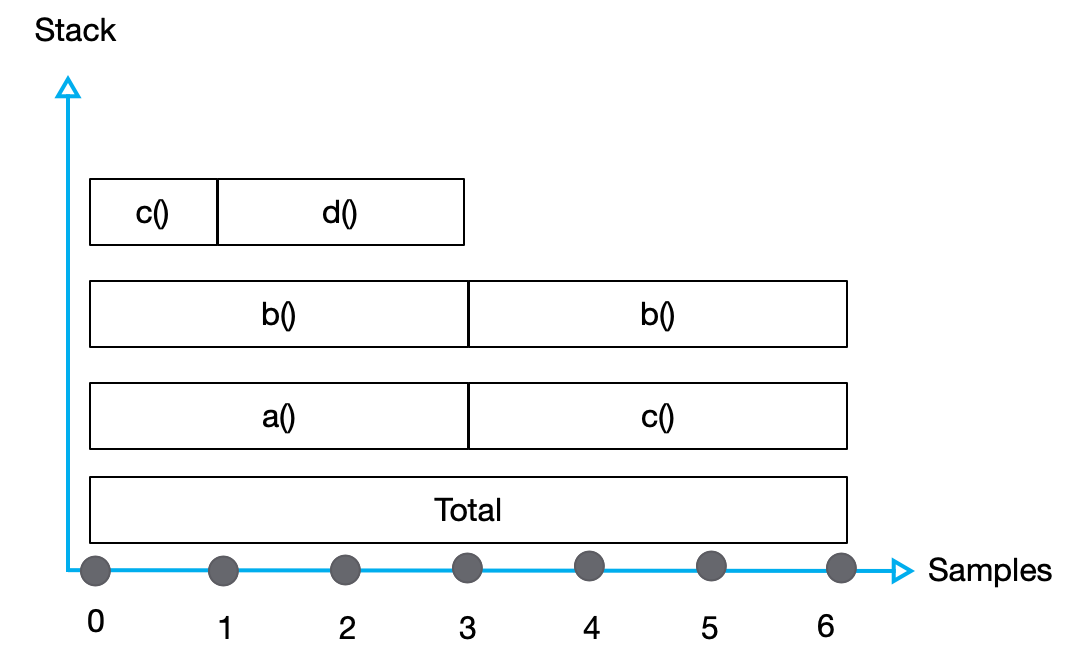
A value expressed x-axis can be given different meanings in different scenarios, for example:
The y-axis is expressed as the stack trace.
Therefore, the meaning expressed in the figure is consistent with the following set of data. Each line is separated by spaces, with stack traces on the left and values on the right.
a();b();c() 1
a();b();d() 2
c();b() 3
Here, you should have a perceptual understanding of how profiling works. The overall process of performance analysis is shown in the figure:
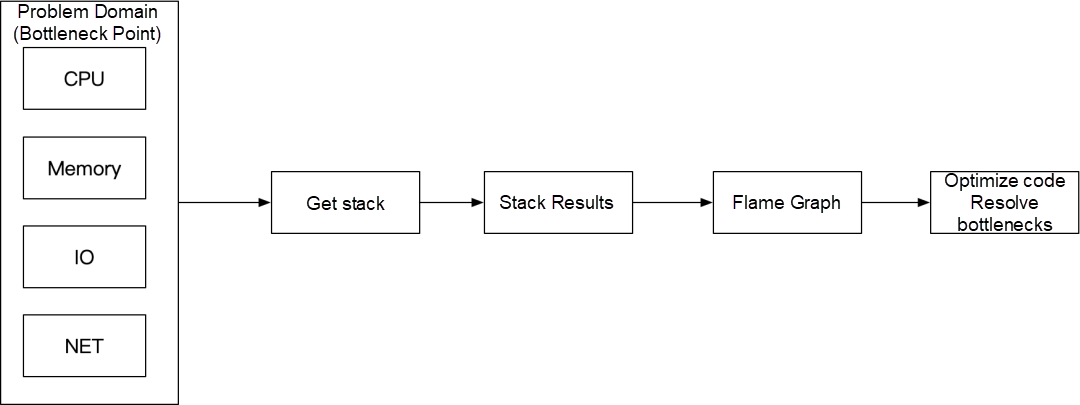
Therefore, the key points of profiling are listed below:
Common tools include Linux perf, eBPF profile, DTrace, and SystemTap. This article refers to these tools for obtaining stack data as Profiling Tools. The usage of Linux tools is not described in detail. These tools are generic and effective, but they are not so friendly to non-C developers. The vast majority of application developers in high-level languages do not care about low-level content (such as page fault, numa balance, context switch, L3 Cache miss, and other issues), which are usually not included in the knowledge graph of application developers. The optimization of this part is not described in detail.
We can divide Profile Tools into two categories:
Language Profile: These show language methods (such as Java method) but usually not system code paths.
It is easy to understand that Profiling Tools can crawl stack because of the hook operation performed in specific code, which will generate additional overhead. Therefore, Profiling Tools bring additional overhead. Different types of Profiling have different hook points. Therefore, different performance analysis types cause different overheads. For a long time, the most important blocking point is that the value of the overhead parameter is too high, and the business logic of the application is severely damaged. Therefore, the most important assessment to evaluate whether Profiling Tools are suitable for production is to estimate overhead.
The tools mentioned before are the capabilities provided by System Profiling Tools. The core capabilities of these tools focus on system code paths. The capabilities are not strong enough for some features in high-level languages.
Let's learn how high-level language Profiling Tools help developers optimize performance.
Let’s take Java as an example. Here is the code structure of the Java program running, as shown in the following figure:
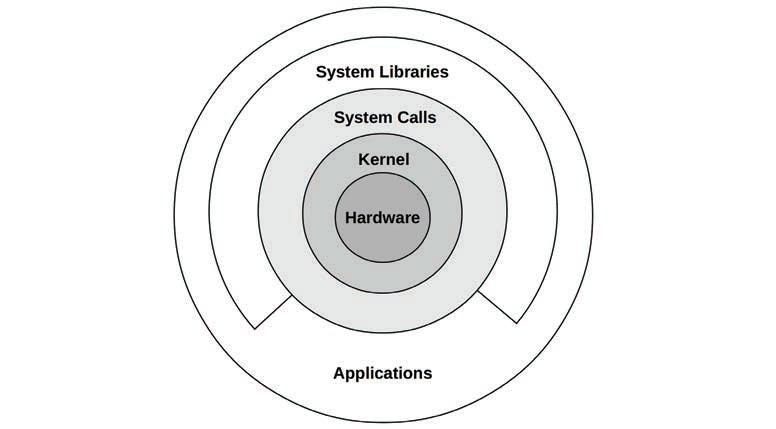
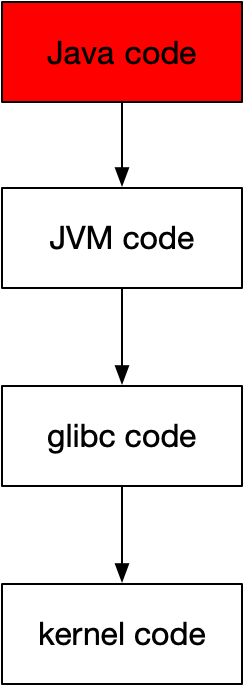
For Java developers, most scenarios do not consider the possibility of problems with JVM code, glibc code, and kernel code. This part of the code is relatively stable, and there is a stable organization to promote the solution. Therefore, the core of JVM Profiling is to crawl stack, only crawling the Java code level (Java stack). This is the core part that most application developers pay attention to, and the following part (native stack) is not in the scope of Java developers.
Another feature of JVM is to shield the underlying concepts of Linux and replace them with their conceptual system, such as:
Therefore, the performance analysis types in JVM Profiling are closer to the conceptual system of Java developers than the system profile.
For example, compared with on-cpu profiling, as a Java developer, do you care about whether there are problems with JVM code or glibc? There is no denying that this is a rare scenario, and you are more concerned about the problems at the Java code level. Then, the cpu profiling of JVM Profiling expresses on-cpu profiling for Java code.
Similarly, for the memory application rate alloc profiling:
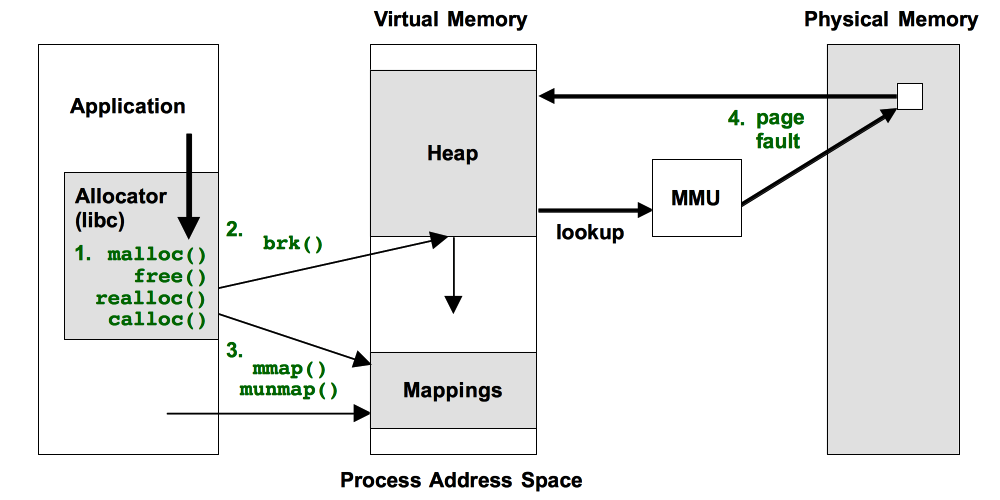
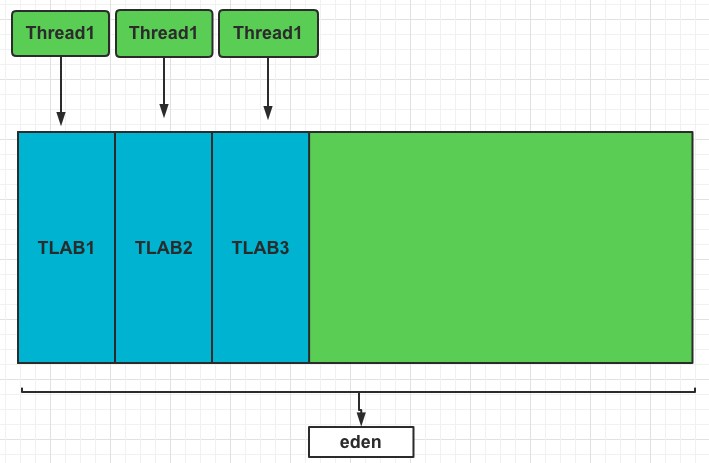
JVM Profiling and System Profiling have different concerns: JVM Profiling focuses on the performance of the JVM rather than running through the entire process from user state to kernel state. This is an important difference, and other high-level languages are similar.
The Java community has a wealth of JVM Profiling Tools.
Async-profiler [4]:
Fight Recorder[8]
Java Flight Recorder (JFR) is a powerful application problem diagnosis and performance profiling tool deeply embedded in the JVM. With its low overhead, JFR can be continuously enabled in the production environment. JFR was originally a commercial feature in JRockit and Oracle JDK. It was open-sourced by Oracle in Java 11. In 2019, Alibaba, as a major contributor, joined forces with companies (such as Azul, Datadog, and RedHat) to transplant JFR into OpenJDK 8. Currently, Alibaba Dragonwell 8 and 11 include the complete JFR features.
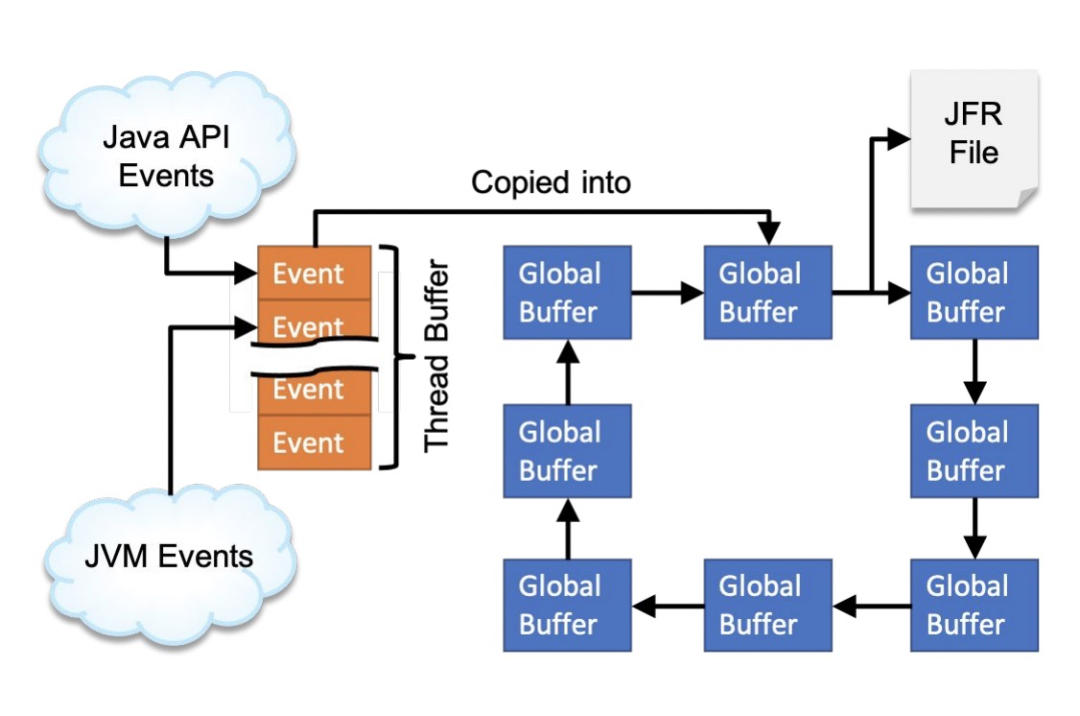

The events of JFR include the following types of information:
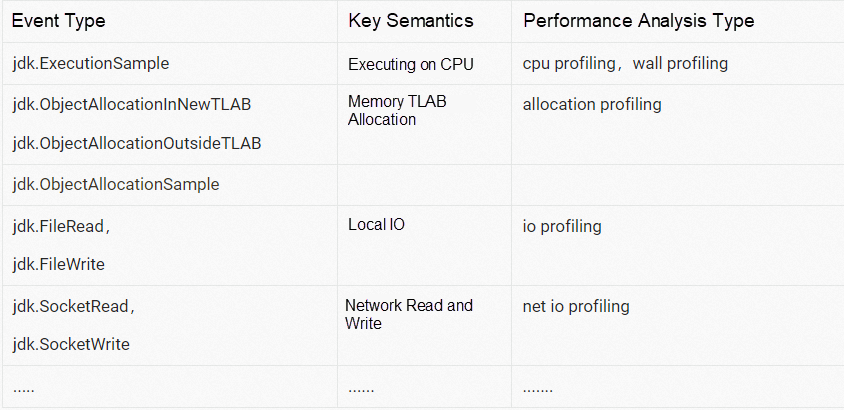
You can use JFR events to perform performance analysis in almost all scenarios.
JFR is excellent, but there are still adaptation problems in the domestic environment.
The iteration speed of Java is too fast. Java 17 has been released, but there are still many applications running on Java 8 in China. The lowest version of JFR from 11backport is 8u272 (8u262 only has a JFR code but is not available), which makes Java before 8u272 unable to use JFR.
JFR is also developing (such as jdk.ObjectAllocationInNewTLAB).
The overhead generated by the implementation of jdk.ObjectAllocationOutsideTLAB before Java 16 is too high, which makes it unsuitable for normal collection in the production environment.
The combination of Perf_events and AsyncGetCallTrace solves the JVM SafePoint Bias problem and the high overhead problem. The mainstream Java IDE IntelliJ IDEA and the profiling capability provided by Alibaba Arthas are implemented through Async-profiler. Therefore, this tool is also used in ARMS's scheme.
The ARMS and Alibaba Dragonwell teams have carried out in-depth optimization based on the mainstream design in the industry and designed a new collection and analysis technology scheme to provide better value for users. Among them, the acquisition scheme takes performance and financial costs into account by giving priority to the more mature and perfect JFR. In the case of JFR making commercial characteristics of OracleJDK or Async-Profiler better, the use of Async-Profiler is an alternative, which is fully automatic, so users do not need to pay attention to configuration details.

Note:

Note:
Currently, the ARMS productization part includes two categories and three performance analysis types to solve the most common CPU and memory problems of Java developers.
In the roadmap of the product, performance analysis capabilities (such as lock, file, and socket) will be considered. The main core considerations in the process are the overhead evaluation and implementation constraints corresponding to each implementation.
As mentioned earlier, evaluating whether a Profiling Tool is suitable for production mainly depends on whether the additional overhead is small enough. The overall capability provided by ARMS depends on Async-profiler and JFR. The overhead of these two tools is the key.
Therefore, Async-profiler and Oracle officials do not have more detailed data. We are conducting some tests for reference.
The following figure shows the stress test model:

The test code includes database query, JSON serialization, sequential writing of log files, and network sending and receiving.
Use wrk to make concurrency testing. The command is listed below:
wrk -t2 -d 10 -c 10http://172.22.230.30:8088/queryRandomThe overall goal of client pressure is to control the CPU pressure of the server to about 50%. The impact of the stress test results on the application is mainly evaluated using QPS (throughput) and RT (latency) as standards (system CPU pressure is controlled at about 50%).
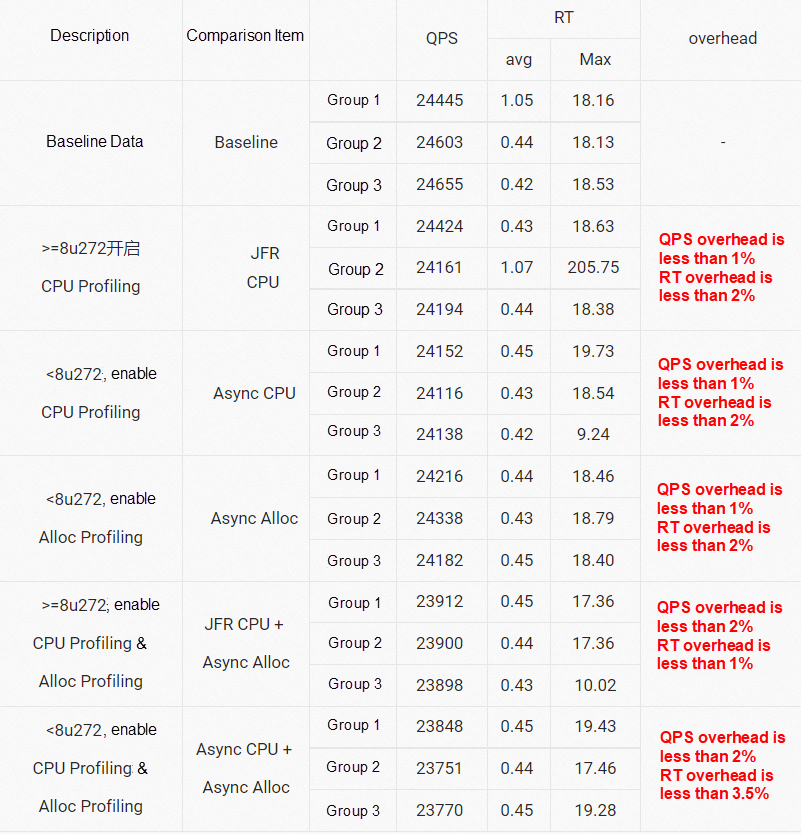
The two JFR Events that JFR Alloc depends on have very serious performance problems:
Therefore, this test does not include JFR Alloc, and this problem with JFR was not solved until after Java 15.
We also conducted a set of extreme stress tests to fill the CPU. The conclusion is that the overhead of QPS and RT is lower than 10%. This extreme situation also exists, and the data are only for reference.
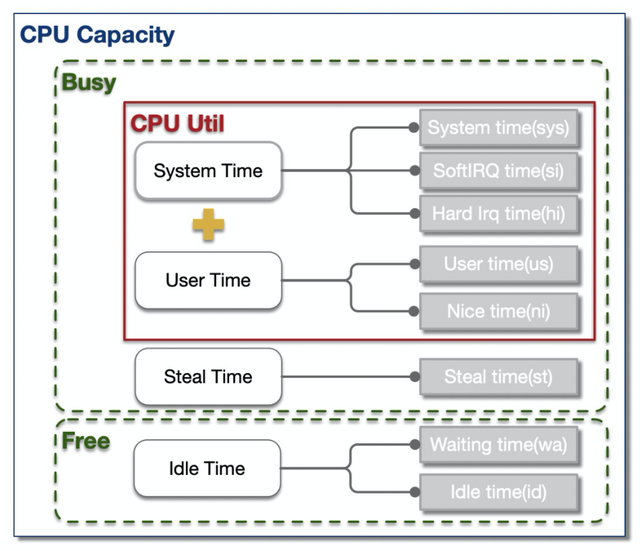

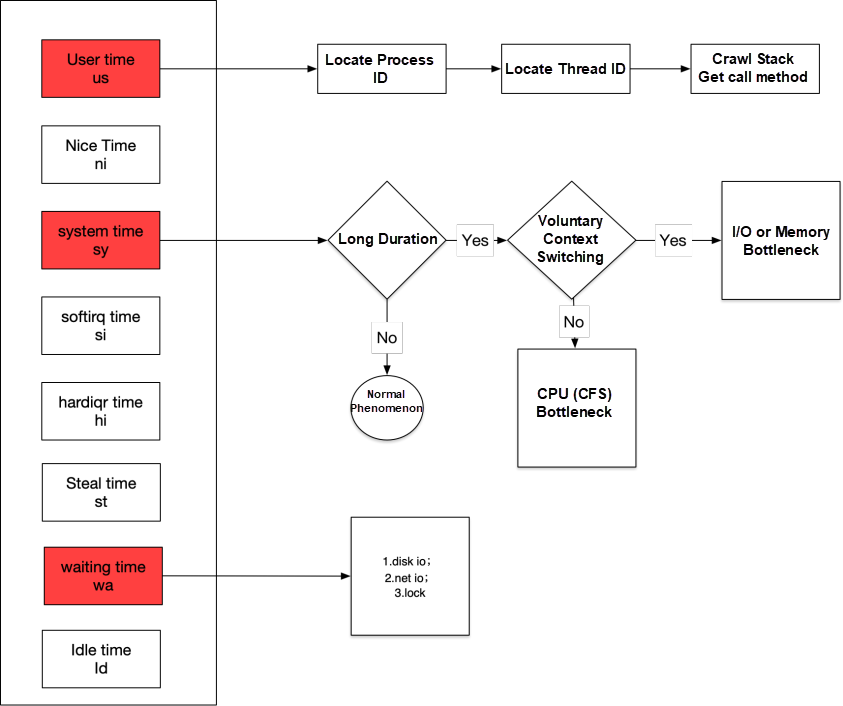
1. The Traditional Way for High CPU in the JVM Program
We focus on the situation where User time is high. The troubleshooting process for Java developers is listed below:
1. Locate the pid of the Java process with high CPU, top
2. Locate the specific thread id, top -p ${pid} -H
3. Calculate the hexadecimal value of the thread ID , printf "%xn" ${thread ID}
4. Locate the bottleneck based on the stack trace, jstack ${pid}| grep ${thread ID} -A 10
5. View the stack trace to identify the code and solve the problem
2. Use Arms Continuous Java Profile to Solve the Problem of High JVM User
1. Determine that the JVM business process causes the user CPU to rise:
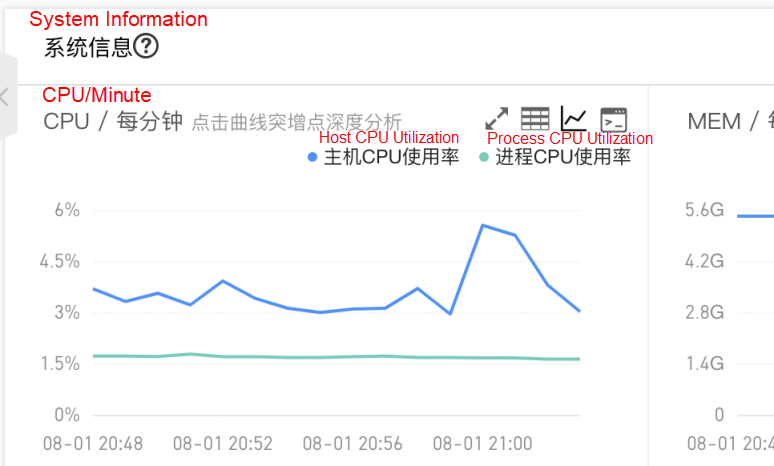
2. Find the time point when the CPU becomes high, open the flame graph and the person point method statistics, identify the code consumption, and solve the problem:
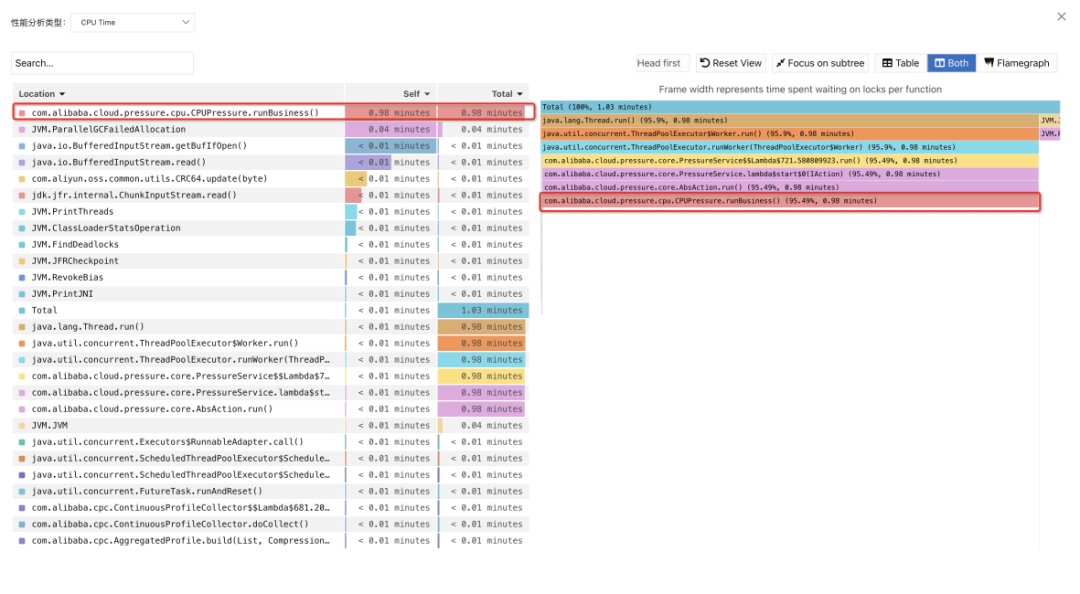
Directly locate the method and count the duration of each method, as shown in the hot spot method on the left of the figure. Filter out threads and other related conditions (When the CPU bottleneck is caused by user code, developers do not need to pay special attention to threads. They directly summarize all stack traces in all threads and summarize them according to the response time of each method).
Step 1: Open the pressure program and set the heap size to 128M (-Xms128m-Xmx128m)
Step 2: The gc log part of the pressure program is shown in the figure below, and gc operations are performed frequently.
85.013: [GC (Allocation Failure) [PSYoungGen: 29518K->3328K(36352K)] 47116K->21252K(123904K), 0.0065644 secs] [Times: user=0.02 sys=0.00, real=0.00 secs]
89.993: [GC (Allocation Failure) [PSYoungGen: 31736K->3328K(35840K)] 49660K->21260K(123392K), 0.0061679 secs] [Times: user=0.02 sys=0.00, real=0.00 secs]
94.062: [GC (Allocation Failure) [PSYoungGen: 31608K->3232K(36864K)] 49540K->21196K(124416K), 0.0070968 secs] [Times: user=0.02 sys=0.00, real=0.00 secs]
99.090: [GC (Allocation Failure) [PSYoungGen: 32934K->1344K(36864K)] 50898K->19332K(124416K), 0.0051987 secs] [Times: user=0.01 sys=0.00, real=0.01 secs]
103.114: [GC (Allocation Failure) [PSYoungGen: 29079K->2368K(37376K)] 47067K->20432K(124928K), 0.0056821 secs] [Times: user=0.01 sys=0.00, real=0.00 secs]
108.134: [GC (Allocation Failure) [PSYoungGen: 32528K->1344K(36864K)] 50592K->19464K(124416K), 0.0067361 secs] [Times: user=0.02 sys=0.00, real=0.00 secs]
113.086: [GC (Allocation Failure) [PSYoungGen: 31748K->3264K(37376K)] 49869K->21503K(124928K), 0.0059270 secs] [Times: user=0.02 sys=0.00, real=0.01 secs]
117.178: [GC (Allocation Failure) [PSYoungGen: 31709K->3328K(37376K)] 49948K->21591K(124928K), 0.0049904 secs] [Times: user=0.02 sys=0.01, real=0.01 secs]
121.192: [GC (Allocation Failure) [PSYoungGen: 32615K->3607K(37376K)] 50878K->21878K(124928K), 0.0076185 secs] [Times: user=0.01 sys=0.00, real=0.01 secs]
126.217: [GC (Allocation Failure) [PSYoungGen: 33278K->1312K(37376K)] 51549K->19615K(124928K), 0.0045188 secs] [Times: user=0.01 sys=0.00, real=0.00 secs]
131.159: [GC (Allocation Failure) [PSYoungGen: 32080K->3488K(37376K)] 50383K->21799K(124928K), 0.0046074 secs] [Times: user=0.01 sys=0.00, real=0.01 secs]
135.256: [GC (Allocation Failure) [PSYoungGen: 33274K->3488K(37376K)] 51585K->21807K(124928K), 0.0044789 secs] [Times: user=0.01 sys=0.00, real=0.00 secs]
140.276: [GC (Allocation Failure) [PSYoungGen: 33871K->1472K(37888K)] 52190K->19799K(125440K), 0.0043370 secs] [Times: user=0.01 sys=0.00, real=0.00 secs]
145.296: [GC (Allocation Failure) [PSYoungGen: 32925K->1472K(37888K)] 51252K->19799K(125440K), 0.0044817 secs] [Times: user=0.01 sys=0.01, real=0.00 secs]
150.321: [GC (Allocation Failure) [PSYoungGen: 32944K->1440K(37888K)] 51271K->19767K(125440K), 0.0041987 secs] [Times: user=0.01 sys=0.00, real=0.01 secs]
155.345: [GC (Allocation Failure) [PSYoungGen: 32896K->1472K(37888K)] 51223K->19799K(125440K), 0.0045417 secs] [Times: user=0.01 sys=0.00, real=0.00 secs]
160.374: [GC (Allocation Failure) [PSYoungGen: 33168K->1568K(37888K)] 51495K->19903K(125440K), 0.0051167 secs] [Times: user=0.01 sys=0.00, real=0.00 secs]
165.261: [GC (Allocation Failure) [PSYoungGen: 33469K->3616K(37888K)] 51804K->21959K(125440K), 0.0048307 secs] [Times: user=0.01 sys=0.01, real=0.01 secs]
170.286: [GC (Allocation Failure) [PSYoungGen: 35284K->3552K(37888K)] 53627K->21895K(125440K), 0.0143238 secs] [Times: user=0.03 sys=0.01, real=0.01 secs]
175.316: [GC (Allocation Failure) [PSYoungGen: 35008K->3584K(37888K)] 53351K->21927K(125440K), 0.0060600 secs] [Times: user=0.01 sys=0.00, real=0.00 secs]
180.338: [GC (Allocation Failure) [PSYoungGen: 35061K->3584K(37888K)] 53404K->21935K(125440K), 0.0044581 secs] [Times: user=0.01 sys=0.00, real=0.00 secs]
185.359: [GC (Allocation Failure) [PSYoungGen: 35044K->3584K(35840K)] 53395K->21935K(123392K), 0.0054453 secs] [Times: user=0.01 sys=0.00, real=0.01 secs]
190.384: [GC (Allocation Failure) [PSYoungGen: 35314K->3584K(37376K)] 53665K->21943K(124928K), 0.0050957 secs] [Times: user=0.01 sys=0.00, real=0.00 secs]
194.502: [GC (Allocation Failure) [PSYoungGen: 33085K->3584K(37376K)] 51444K->22007K(124928K), 0.0045832 secs] [Times: user=0.01 sys=0.00, real=0.01 secs]
199.526: [GC (Allocation Failure) [PSYoungGen: 33952K->1600K(37888K)] 52375K->20039K(125440K), 0.0051886 secs] [Times: user=0.01 sys=0.00, real=0.00 secs]
Step 3: Use Allocated Memory to locate collect-heap memory. What are the main application methods?
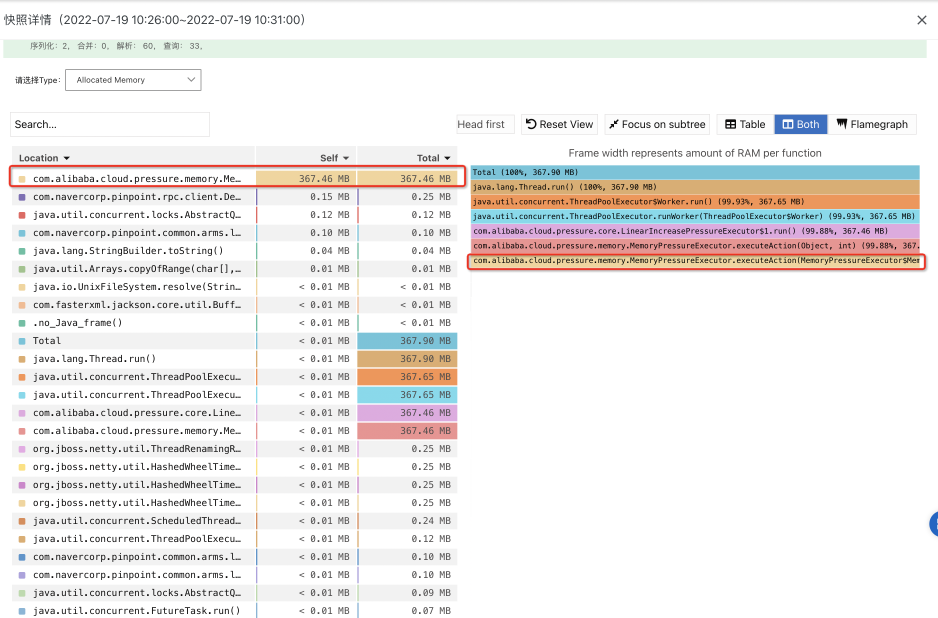
Step 4: Optimize the code
[1] Google paper:
https://storage.googleapis.com/pub-tools-public-publication-data/pdf/36575.pdf
[2] golang built-in pprof:
https://go.dev/blog/pprof
[3] java11 built-in JFR:
https://docs.oracle.com/en/java/java-components/jdk-mission-control/8/user-guide/using-jdk-flight-recorder.html#GUID-D38849B6-61C7-4ED6-A395-EA4BC32A9FD6
[4] Async-profiler:
https://github.com/jvm-profiling-tools/async-profiler
[5] jetbrains IntelliJ IDEA :
https://www.jetbrains.com/help/idea/async-profiler.html
[6] Honest profiler:
https://github.com/jvm-profiling-tools/honest-profiler/
[7] Uber JVM Profiler
https://github.com/uber-common/jvm-profiler
[8] Fight Recorder
https://docs.oracle.com/en/java/java-components/jdk-mission-control/8/user-guide/using-jdk-flight-recorder.html#GUID-D38849B6-61C7-4ED6-A395-EA4BC32A9FD6
[9] JEP 349: JFR Event Streaming
https://openjdk.org/jeps/349
[10] JFR Overhead
https://docs.oracle.com/javase/8/docs/technotes/guides/troubleshoot/performissues001.html
Rapid Deployment of RocketMQ 5.0 Clusters Based on Cloud Infrastructure

656 posts | 55 followers
FollowAlibaba Cloud Native - February 2, 2024
Alibaba Cloud Native - September 12, 2024
Alibaba Cloud Native Community - April 18, 2025
Alibaba Cloud Native Community - September 22, 2025
Alibaba Cloud Native Community - May 31, 2024
Alibaba Container Service - July 25, 2025

656 posts | 55 followers
Follow Simple Log Service
An all-in-one service for log-type data
Learn MoreMore Posts by Alibaba Cloud Native Community