By Bruce Wu
Performance diagnosis is a problem that software engineers need to frequently face and solve in their daily work. Today, user experience matters the most, and improving application performance can provide significant advantages. Java is one of the most popular programming languages. Its performance diagnosis has been attracting a lot of attention across the industry for a long time. Many factors may cause performance problems in Java applications. Such factors include thread control, disk I/O, database access, network I/O, and garbage collection (GC). You need an excellent performance diagnostic tool to find these problems. This article describes some common Java performance diagnostic tools, and highlights the basic principles and best practices of JProfiler, an excellent representative of these tools. The JProfiler version discussed in this article is JProfiler10.1.4.
Various performance diagnostic tools are available in the Java world, including simple command line tools, such as jmap and jstat, and comprehensive graphical diagnostic tools, such as JVisualvm and JProfiler. The following section briefly describes each of these tools.
The Java Development Kit (JDK) offers many built-in command line tools. They can help you obtain information of the target Java virtual machine (JVM) from different aspects and different layers.
You can use any or any combinations of the above command line tools to help you obtain the basic performance information about the target Java application. However, they have the following drawbacks:
The following are several comprehensive graphical performance diagnostic tools:
JVisualvm is a built-in visual performance diagnostic tool provided by the JDK. It obtains analytical data of the target JVM, including CPU usage, memory usage, threads, heaps, and stacks, by using various methods such as JMX, jstatd, and Attach API. In addition, it can intuitively display the quantity and size of each object in Java heaps, the number of times that a Java method is called, and the duration that a Java method is executed.
JProfiler is a Java application performance diagnostic tool developed by ej-technologies. It focuses on addressing four important topics:
If you only need to diagnose performance bottlenecks of standalone Java applications, the diagnostic tools described above are enough to meet your needs. However, when standalone modern systems gradually evolve into distributed systems and microservices, the tools above cannot meet the requirements. We need to use the end-to-end tracing function of distributed tracing systems such as Jaeger, ARMS, and SkyWalking. A variety of distributed tracing systems are available in the market, but their implementation mechanisms are similar. They record the tracing information through code tracking, transmit the recorded data to central processing systems through SDKs or agents, and provide query interfaces to display and analyze the results. For more information about the principles of distributed tracing systems, see the article titled OpenTracing Implementation of Jaeger.
JProfiler consists of a JProfiler agent to collect analytical data from the target JVM, a JProfiler UI to visually analyze data, and command line utilities to provide various functions. The big picture of all important interactions between them is given as follows.
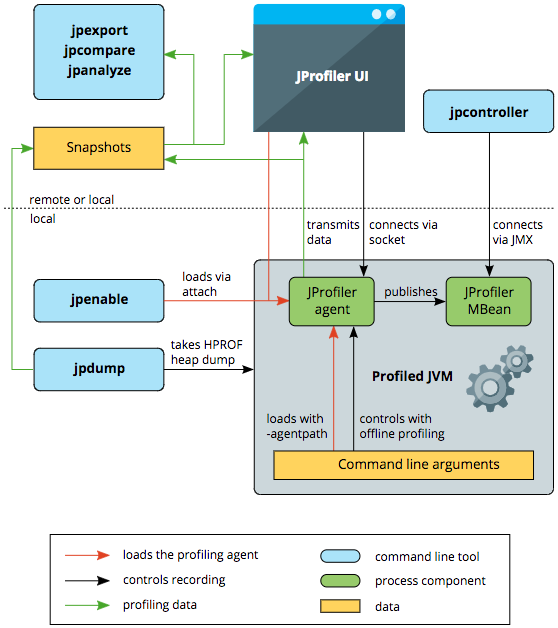
The JProfiler agent is implemented as a native library. You can load it at the startup of a JVM by using the parameter -agentpath:<path to native library>, or when the application is running by using the JVM Attach mechanism. After the JProfiler agent is loaded, it sets up the JVM tool interface (JVMTI) environment, to monitor all kinds of events generated by the JVM, such as thread creation and class loading. For example, when it detects a class loading event, the JProfiler agent inserts its own bytecode to these classes to perform its measurements.
The JProfiler UI is started separately and connects to the profiling agent through a socket. This means that it is actually irrelevant if the profiled JVM is running on the local machine or on a remote machine - the communication mechanism between the profiling agent and the JProfiler UI is always the same.
From the JProfiler UI, you can instruct the agent to record data, display the profiling data in the UI, and save snapshots to disk.
JProfiler provides a series of command line tools to implement different functions.
JProfiler supports diagnosing the performance of both local and remote Java applications. If you need to collect and display analytical data of a remote JVM in real time, perform the following steps:
For more information about the installation steps, see Installing JProfiler and Profiling A JVM.
This section shows you how to use JProfiler to diagnose the performance of Alibaba Cloud LOG Java Producer (the "Producer"), a LogHub class library. If you encounter any performance problems with your application or when you use Producer, you can take similar measures to find out the root cause. If you do not know Producer, we recommend that you read this article first: Alibaba Cloud LOG Java Producer - A powerful tool to migrate logs to the cloud.
For sample code used in this section, see SamplePerformance.java.
JProfiler provides two data collection methods: sampling and instrumentation.
In this example, we need to obtain the method-level statistical information, so we choose the instrumentation method. A filter is configured to ensure that the agent records the CPU data of only two classes, com.aliyun.openservices.aliyun.log.producer and com.aliyun.openservices.log.Client, under the java package.
You can specify different parameters for the JProfiler agent to control the startup mode of the application.
-agentpath:<path to native library>=port=8849.-agentpath:<path to native library>=port=8849,nowait.-agentpath:<path to native library>=offline,id=xxx,config=/config.xml.In the testing environment, we need to determine the performance of the application during the startup phase. So we use the default WAIT option here.
After completing the profiling settings, you can proceed with the performance diagnosis for Producer.
On the overview page, we can clearly view graphs (telemetries) about various metrics, such as memory, GC activities, classes, threads, and the CPU load.
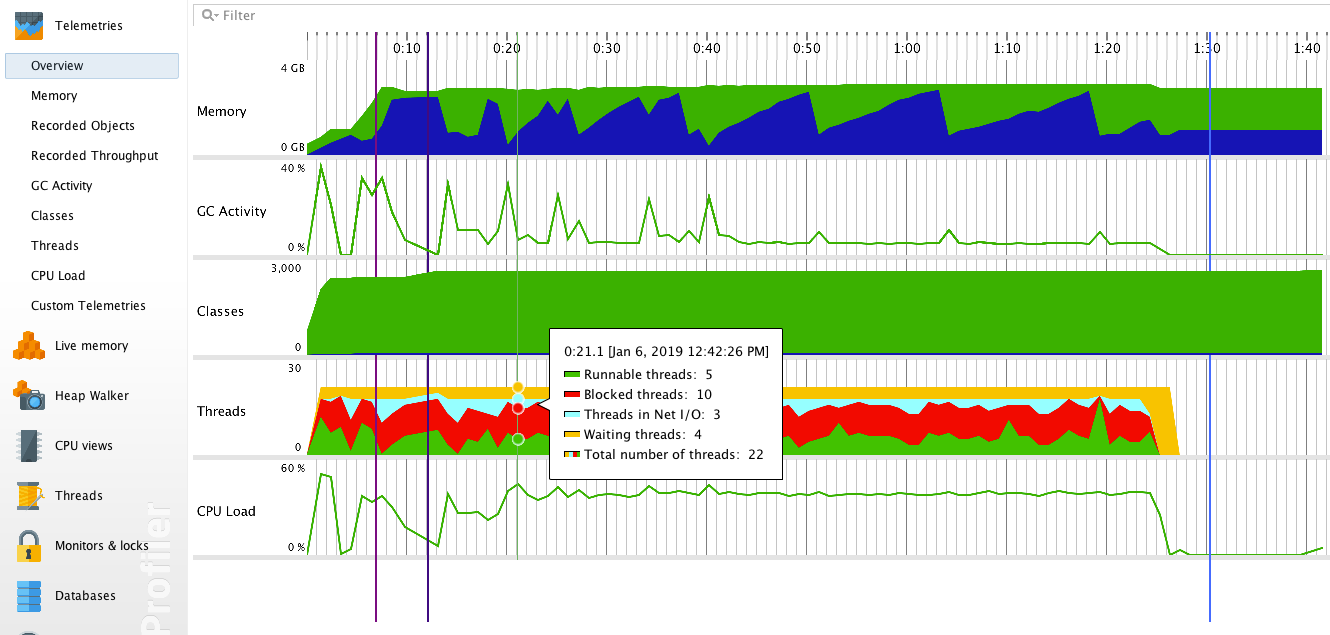
We can make the following assumptions based on this telemetry:
The number of executions, execution time, and call relationships of each method in the application are displayed by CPU views. They are helpful in locating the method that has the most significant impact on the performance of your application.
Call tree clearly shows the hierarchical call relationships between different methods by using tree graphs. In addition, JProfiler sorts the sub-methods by their total execution time, which allows you to quickly locate key methods.

For Producer, the method SendProducerBatchTask.run() takes most of the time. If you continue to look down, you will find that most of the time is taken by executing the method Client.PutLogs().
If you have many application methods, and many of your sub-methods are executed in a short interval, the Hot Spots view can help you quickly locate performance problems. This view can sort the methods based on various factors, such as their individual execution time, total execution time, average execution time, and number of calls. The individual execution time is equal to the total execution time of the method minus the total execution time of all sub-methods.
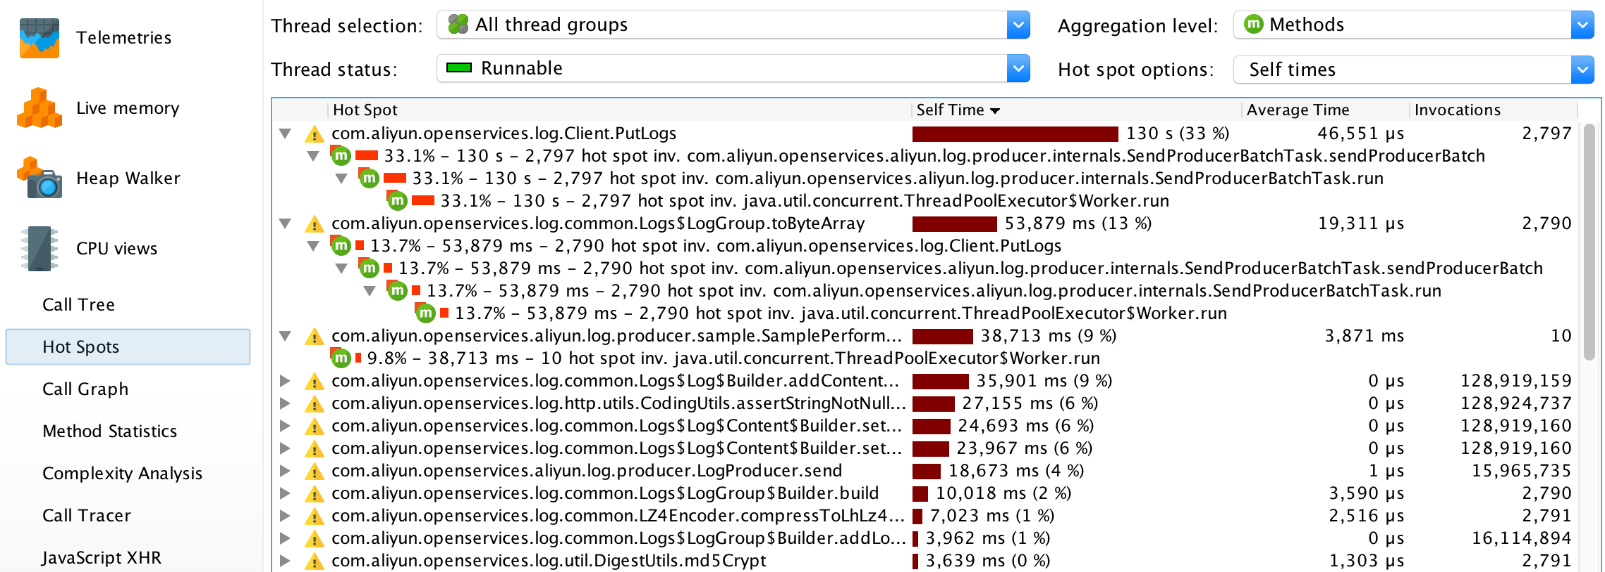
In this view, you can see that the following three methods: Client.PutLogs(), LogGroup.toByteArray(), and SamplePerformance$1.run() take the most time to be executed individually.
After you find the key methods, the Call Graph view can present you all methods that directly associate with these key methods. This is helpful in finding the solution to the problem and develop the best performance optimization policy.
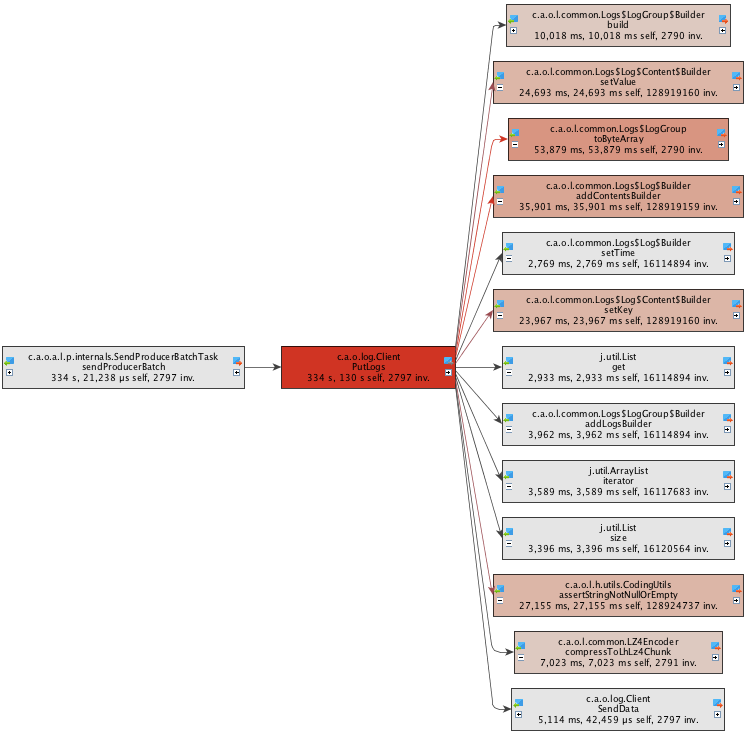
Here, we can see that most of the execution time of the method Client.PutLogs() is spent on object serialization. Therefore, the key to performance optimization is to provide a more efficient serialization method.
Live Memory views allow you to know the detailed memory allocation and usage to help you determine if there is a memory leak.
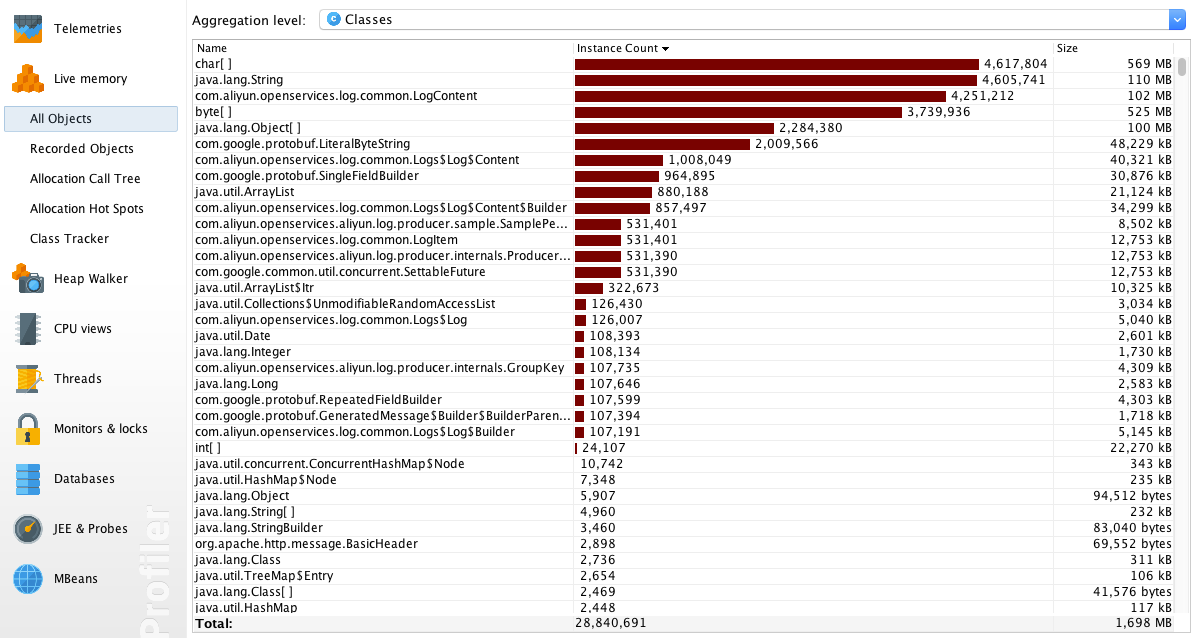
The All Objects view shows the number and total size of various objects in the current heap. As you can see from the following figure, a large number of LogContent objects are created during the running process of the application.
The Allocation Call Tree view shows the amount of memory that has been allocated to each method in the form of a tree diagram. As you can see, SamplePerformance$1.run() and SendProducerBatchTask.run() are large memory consumers.

If you have many methods, you can quickly find out which method has been assigned the most objects in the Allocation Hot Spots view.

The Thread History view intuitively shows the status of each thread at different time points.
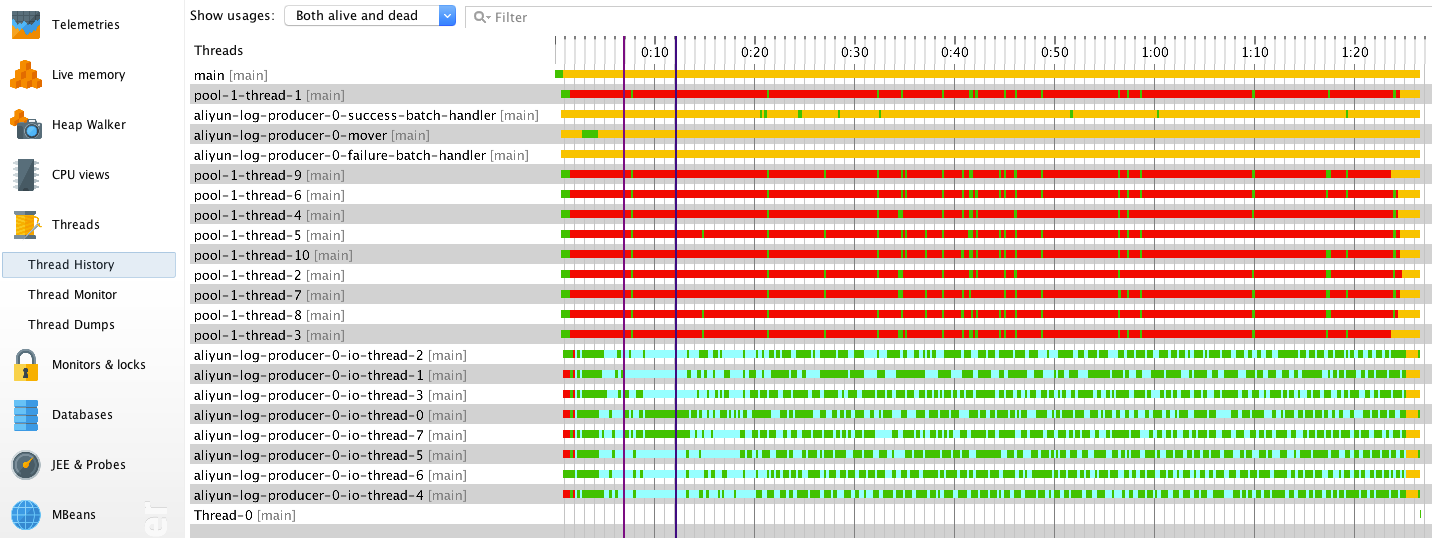
Tasks run by different threads have different state features.
Pool-1-thread-<M> periodically calls the Producer.send () method to asynchronously send data. They continued to run while the application was starting, but was mostly blocked afterwards. The cause of this phenomenon is that Producer sends data slower than the data generation speed, and the cache size of each Producer instance is limited. After the startup of the application, Producer had enough memory to cache the data that is waiting to be sent, so pool-1-thread-<M> remained running for a while. This explains why the application had high CPU usage at startup. As time passed by, the cache memory is fully occupied. pool-1-thread-<M> must wait until Producer releases sufficient space. That is why a large number of threads are blocked.aliyun-log-producer-0-mover detects and sends expired batches to IOThreadPool. The data accumulation speed is fast, a producer batch is sent to IOThreadPool by pool-1-thread-<M> immediately after the cached data size reached the upper limit. Therefore, the mover thread remained idle most of the time.aliyun-log-producer-0-io-thread-<N> sends data from IOThreadPool to your designated logstore, and it takes most of the time on the network I/O status.aliyun-log-producer-0-success-batch-handlerhandles batches that were successfully sent to the logstore. The callback is simple and it takes a very short time to execute. Therefore, the SuccessBatchHandler remained idle most of the time.aliyun-log-producer-0-failure-batch-handler handles batches that failed to be sent to the logstore. In our case, no data has failed to be sent. It remained idle all the time.According to our analysis, the statuses of these threads are within our expectation.
After the application finishes running, JProfiler displays a dialog box to show frequently called methods with very short running time. Next time, you can set JProfiler agent to ignore these methods to reduce the impact caused by JProfiler to the performance of the application.
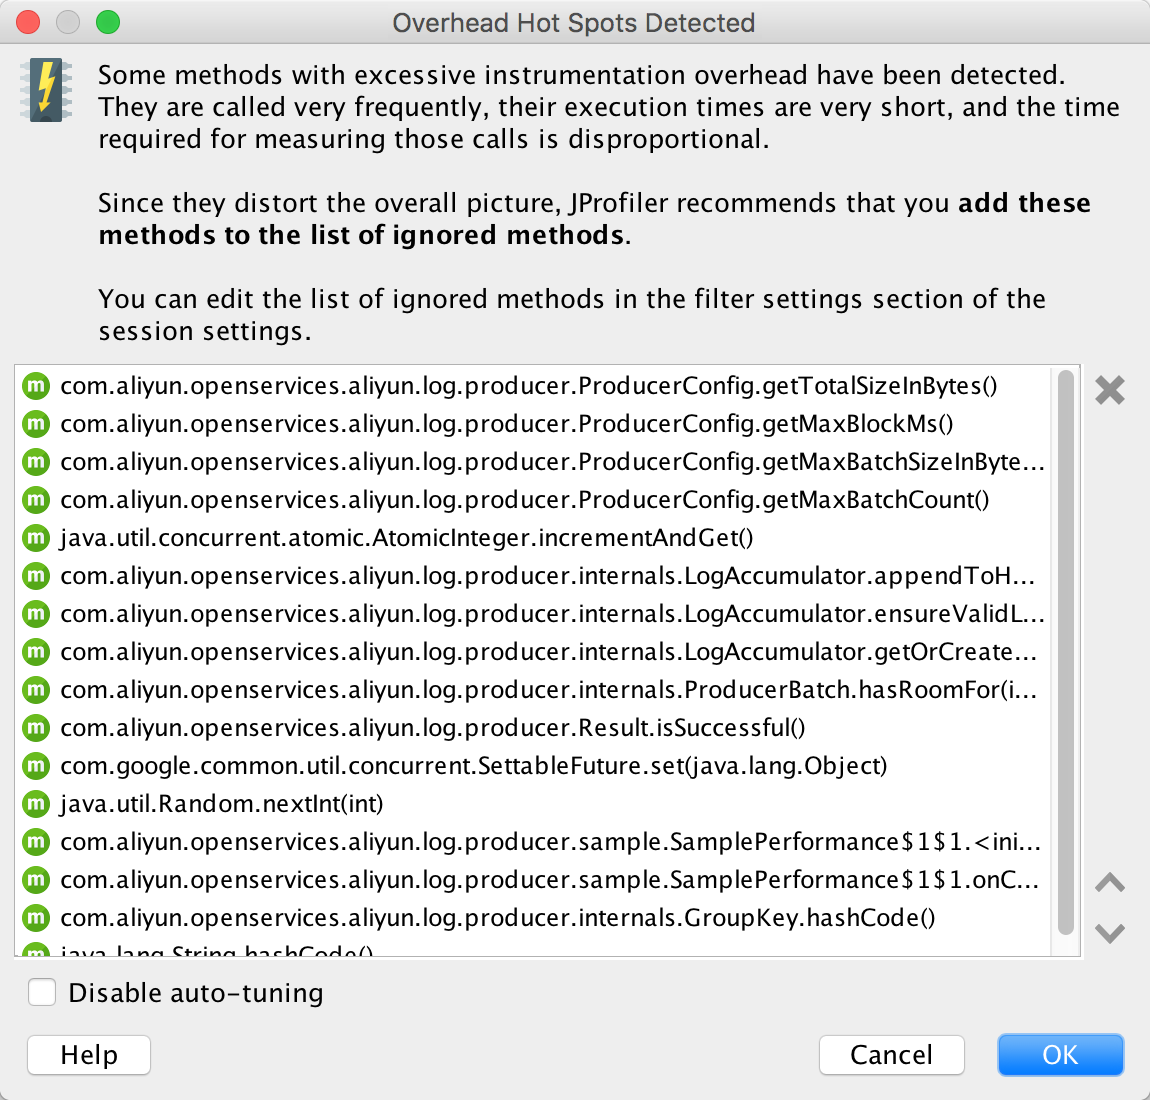
Based on the JProfiler diagnosis, the application does not have any significant performance problems or memory leak. The next step of optimization is to improve the serialization efficiency of objects.
3 Ways to Migrate Java Logs to the Cloud: Log4J, LogBack, and Producer Lib

57 posts | 12 followers
FollowAlibaba Clouder - November 22, 2019
Alibaba Cloud Native Community - May 9, 2023
Alibaba Cloud Community - August 30, 2024
Adrian Peng - February 1, 2021
Aliware - May 20, 2019
Alibaba Cloud Native - August 6, 2024

57 posts | 12 followers
Follow Simple Log Service
An all-in-one service for log-type data
Learn More Log Management for AIOps Solution
Log into an artificial intelligence for IT operations (AIOps) environment with an intelligent, all-in-one, and out-of-the-box log management solution
Learn More Mobile Testing
Provides comprehensive quality assurance for the release of your apps.
Learn More Web App Service
Web App Service allows you to deploy, scale, adjust, and monitor applications in an easy, efficient, secure, and flexible manner.
Learn MoreMore Posts by Alibaba Cloud Storage