By Bruce Wu
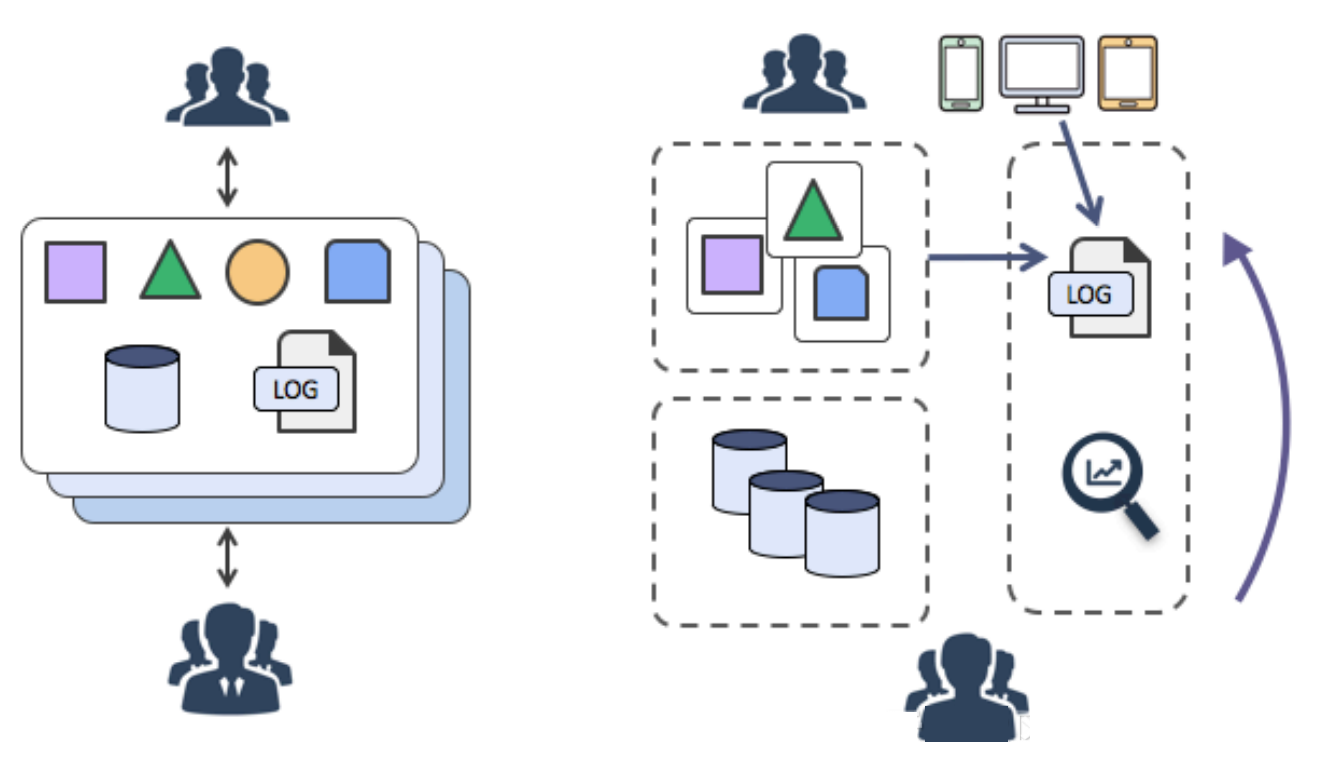
In recent years, the advent of stateless programming, containers, and serverless programming greatly increased the efficiency of software delivery and deployment. In the evolution of the architecture, you can see the following two changes:

The preceding two changes show that behind the elastic and standardized architecture, the Operation & Maintenance (O&M) and diagnosis requirements are becoming more and more complex. Ten years ago, you could log on to a server and fetch logs quickly. However, the attach process mode no longer exists. Currently, we are facing with a standardized black box.

To respond to these changes, a series of DevOps-oriented diagnosis and analysis tools have emerged. These include centralized monitors, centralized log systems, and various SaaS deployment, monitoring, and other services.
Centralizing logs solves the preceding issues. To do this, after applications produce logs, the logs are transmitted to a central node server in real time (or quasi-real time). Often, Syslog, Kafka, ELK, and HBase are used to perform centralized storage.

Log Service provides more than 30 data collection methods and comprehensive access solutions for servers, mobile terminals, embedded devices, and various development languages. Java developers need the familiar log frameworks: Log4j, Log4j2, and Logback Appender.
Java applications currently have two mainstream log collection solutions:
Differences between the two:

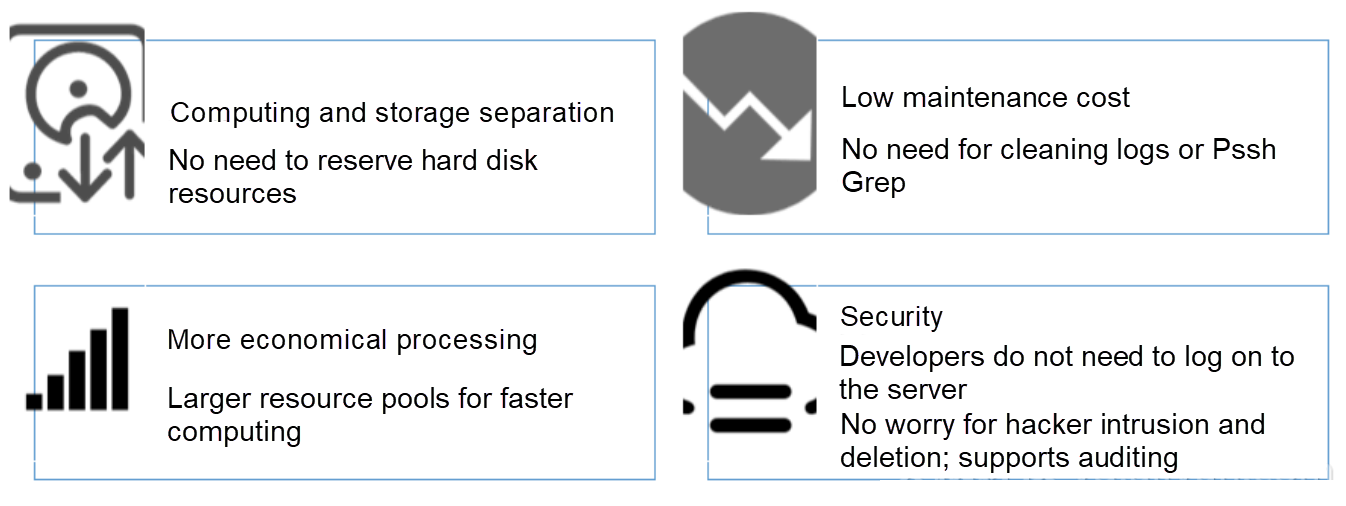
By using Appender, you can use Config to complete real-time log collection easily without changing any code. The Java-series Appender provided by Log Service has the following advantages:
Overview and usage of Appender
The provided Appenders are as follows. The underlying layers all use aliyun-log-producer-java to write data.
Differences between the four:

You can integrate Appender by performing the configuration steps of aliyun-log-log4j-appender.
The contents of the configuration file log4j.properties are as follows:
log4j.rootLogger=WARN,loghub

log4j.appender.loghub=com.aliyun.openservices.log.log4j.LoghubAppender

# Log Service project name (required parameter)
log4j.appender.loghub.projectName=[your project]
# Log Service LogStore name (required parameter)
log4j.appender.loghub.logstore=[your logstore]
#Log Service HTTP address (required parameter)
log4j.appender.loghub.endpoint=[your project endpoint]
# User identity (required parameter)
log4j.appender.loghub.accessKeyId=[your accesskey id]
log4j.appender.loghub.accessKey=[your accesskey]After configuring the Appender as described in the previous step, the logs produced by Java applications are automatically sent to Log Service. You can use LogSearch/Analytics to query and analyze these logs in real time. See the sample log format as follows. Log formats used in this example:
Logs that record your logon behavior:
level: INFO
location:  com.aliyun.log4jappendertest.Log4jAppenderBizDemo.login(Log4jAppenderBizDemo.java:38)
message: User login successfully. requestID=id4 userID=user8
thread: main
time:  2018-01-26T15:31+0000
Logs that record your purchase behavior:
level: INFO
location:  com.aliyun.log4jappendertest.Log4jAppenderBizDemo.order(Log4jAppenderBizDemo.java:46)
message: Place an order successfully. requestID=id44 userID=user8 itemID=item3 amount=9
thread: main
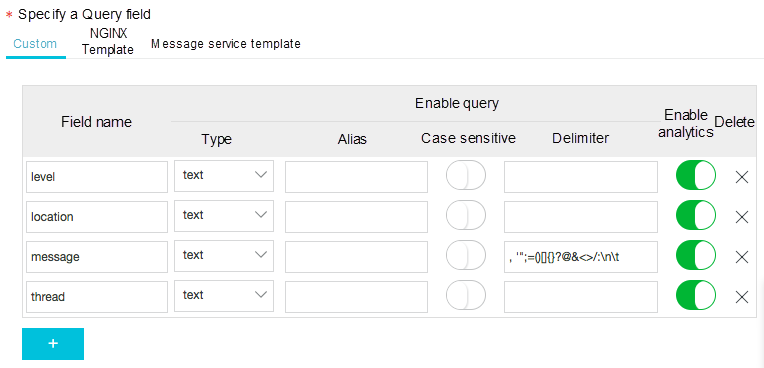
time: 2018-01-26T15:31+0000 You must enable the query and analysis function before querying and analyzing data. Follow these steps to enable the function:

Let's look at five analysis examples.
Syntax example
level: ERROR | select location ,count(*) as count GROUP BY location ORDER BY count DESC LIMIT 32. Count the number of generated logs for each log level in the last 15 minutes.
Syntax example
| select level ,count(*) as count GROUP BY level ORDER BY count DESC 3. Query the log context.
For any log, you can precisely reconstruct the log context information for the original log file.
For more information, see Context query.
4. Count the top three users who have logged on most frequently in the last hour.
Syntax example
login | SELECT regexp_extract(message, 'userID=(? <userID>[a-zA-Z\d]+)', 1) AS userID, count(*) as count GROUP BY userID ORDER BY count DESC LIMIT 3 5. Compile payment total statistics for the past 15 minutes for each user.
Syntax example
order | SELECT regexp_extract(message, 'userID=(? <userID>[a-zA-Z\d]+)', 1) AS userID, sum(cast(regexp_extract(message, 'amount=(? <amount>[a-zA-Z\d]+)', 1) AS double)) AS amount GROUP BY userID aliyun-log-log4j-appender, aliyun-log-log4j2-appender, aliyun-log-logback-appender, and aliyun-log-producer-java are jointly completed by the Alibaba Cloud team and the Co-Creation Platform contributors. Thank you for your outstanding contribution to the project.
aliyun-log-log4j-appender Contributed by: @zzboy
aliyun-log-log4j2-appender Contributed by: @LNAmp @zzboy
aliyun-log-logback-appender Contributed by: @lionbule @zzboy
aliyun-log-producer-java Contributed by: @zzboy
JProfiler Best Practices: Powerful Performance Diagnostic Tool

57 posts | 12 followers
FollowAlibaba Clouder - November 11, 2019
Alibaba Clouder - November 8, 2019
Alibaba Cloud Community - June 14, 2024
Alibaba Cloud Community - November 25, 2024
Alibaba Cloud Community - November 9, 2021
Alibaba Cloud Community - July 31, 2024

57 posts | 12 followers
Follow Cloud Migration Solution
Secure and easy solutions for moving you workloads to the cloud
Learn More Simple Log Service
An all-in-one service for log-type data
Learn More Data Lake Storage Solution
Build a Data Lake with Alibaba Cloud Object Storage Service (OSS) with 99.9999999999% (12 9s) availability, 99.995% SLA, and high scalability
Learn More ISV Solutions for Cloud Migration
Alibaba Cloud offers Independent Software Vendors (ISVs) the optimal cloud migration solutions to ready your cloud business with the shortest path.
Learn MoreMore Posts by Alibaba Cloud Storage