If you want to monitor and perform O&M operations on Simple Log Service, you can query and analyze service logs. For example, you can use service logs to monitor the status and exceptions of Logtail and view the latency logs of consumer groups and the operation logs of resources.
Background information
When you enable the service log feature, you can select log types, including detailed logs, important logs, and job operational logs. For more information, see Log types.
Detailed logs: If you enable the service log feature for detailed logs, a Logstore named internal-operation_log is created in the project you selected, and a dashboard is created in the current project.
Important logs: If you enable the service log feature for important logs, a Logstore named internal-diagnostic_log is created in the project you selected. The Logstore is used to store the consumption delay logs of consumer groups and Logtail heartbeat logs.
Job operational logs: If you enable the service log feature for job operational logs, a Logstore named internal-diagnostic_log is created in the project you selected. The Logstore is used to store the logs of data import, Scheduled SQL, and data shipping jobs.
Prerequisites
The service log feature is enabled. For more information, see Use the service log feature.
Monitor the heartbeat status of Logtail
Query the status logs of Logtail
On the query and analysis page of the internal-diagnostic_log Logstore, execute the following statement to query the status logs of Logtail. For more information, see Query and analyze logs.
__topic__: logtail_statusView the status logs of Logtail. For more information about the fields in the log, see Logtail status logs. Sample log:
{
    "os_detail": "Windows Server 2012 R2",
    "__time__": 1645164875,
    "__topic__": "logtail_status",
    "memory": "25",
    "os": "Windows",
    "__source__": "log_service",
    "ip": "203.**.**.110",
    "cpu": "0.010405",
    "project": "aliyun-test-project",
    "version": "1.0.0.22",
    "uuid": "bf00****688b0",
    "hostname": "iZ1****Z",
    "instance_id": "5897****4735",
    "__pack_meta__": "0|MTYzNjM1Mzk5NDExMTcxOTQzNw==|1|0",
    "user_defined_id": "",
    "user": "SYSTEM",
    "detail_metric": "{\n\t\"config_count\" : \"1\",\n\t\"config_get_last_time\" : \"2022-02-18 14:14:23\",\n\t\"config_prefer_real_ip\" : \"false\"...
    "status": "ok"
}
Monitor the heartbeat status of Logtail
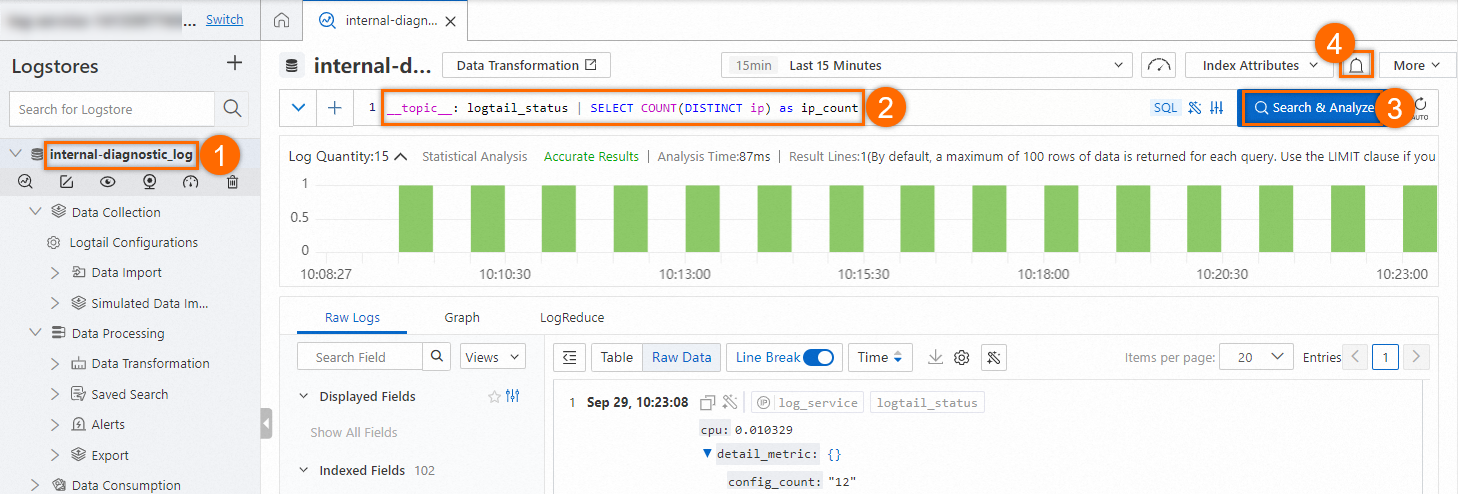
Count the number of normal Logtail heartbeat connections: On the query and analysis page of the internal-diagnostic_log Logstore, count the number of normal Logtail heartbeat connections based on the procedure shown in the following figure. Then, configure an alert rule. For more information, see Query and analyze logs.
Query statement:
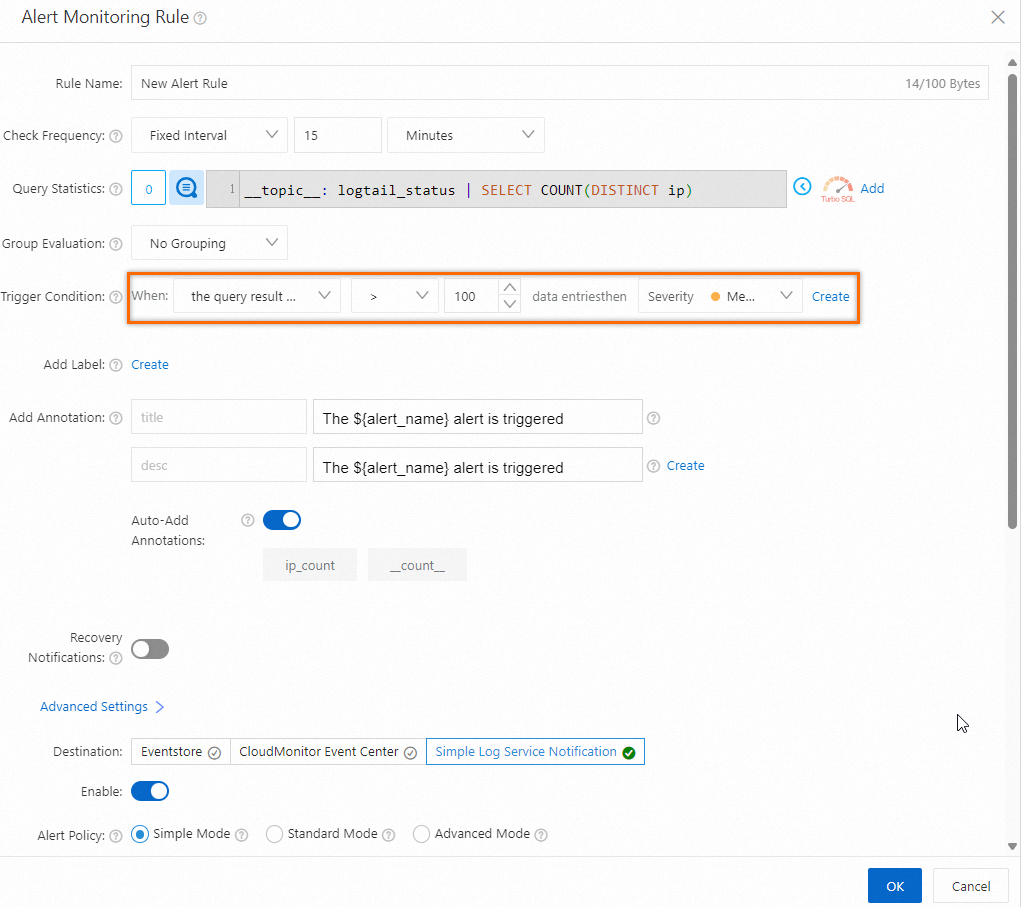
__topic__: logtail_status | SELECT COUNT(DISTINCT ip) as ip_countConfigure an alert rule: If the number of normal heartbeat connections returned in the query and analysis results is less than the number of servers in all machine groups that are bound to Logtail, an alert is triggered. In the following alert rule, 100 is specified for the Trigger Condition parameter, which indicates that the total number of servers is 100. For more information about how to configure alert rules, see Configure an alert rule in Simple Log Service.
Check for servers that have abnormal heartbeat status: If an alert is triggered, specific servers in a machine group do not have a heartbeat connection. You can view the status of a machine group in the Simple Log Service console. For more information about how to troubleshoot errors that cause abnormal heartbeat status, see How do I troubleshoot an error that is related to a Logtail machine group in a host environment?
Monitor Logtail exceptions
On the query and analysis page of the internal-diagnostic_log Logstore, execute the __topic__: logtail_alarm query statement to query the alert logs of Logtail. For more information, see Query and analyze logs and Logtail alert logs. The alert logs help you identify Logtail exceptions at the earliest opportunity. This way, you can modify your Logtail configuration to ensure log integrity. For example, you can execute the following statement to query the number of times that exceptions occur at 15-minute intervals by exception type:
__topic__: logtail_alarm | select sum(alarm_count)as errorCount, alarm_type GROUP BY alarm_typeQuery the latency logs of a consumer group
Sample log
When you use a consumer group to consume data, you can monitor the consumption progress based on the latency logs of the consumer group. If high latency exists, you can change the number of consumers at the earliest opportunity to improve the consumption speed. For more information, see Use consumer groups to consume data. The following code provides a sample latency log of a consumer group. For more information about the fields in the log, see Latency logs of a consumer group.
{
    "__time__": 1645166007,
    "consumer_group": "consumerGroupX",
    "__topic__": "consumergroup_log",
    "__pack_meta__": "1|MTYzNjM1Mzk5NDExMTg5NjU2Mg==|3|0",
    "__source__": "log_service",
    "project": "aliyun-test-project",
    "fallbehind": "9518678",
    "shard": "1",
    "logstore": "nginx-moni"
}
Query the latency logs of a consumer group
On the query and analysis page of the internal-diagnostic_log Logstore, execute the __topic__: consumergroup_log statement to query the latency logs of a consumer group. For more information, see Query and analyze logs. For example, you can execute the following statement to query the consumption latency of a consumer group named consumerGroupX:
__topic__: consumergroup_log and consumer_group: consumerGroupX | SELECT max_by(fallbehind, __time__) as fallbehindQuery the operation logs of all resources in a project
Sample log
Logs on the operations to create, modify, update, and delete resources and data read and write operations in a project are stored in a Logstore named internal-operation_log. The logs include the request logs sent by all clients, such as consoles, consumer groups, and SDKs. The following code provides a sample operation log. For more information about the fields in the log, see Detailed logs.
{
    "NetOutFlow": "1",
    "InvokerUid": "1418****2562",
    "CallerType": "Sts",
    "InFlow": "0",
    "SourceIP": "203.**.**.220",
    "__pack_meta__": "0|MTYzNjM1Mzk5MzY1NDYwODQzMg==|2|1",
    "RoleSessionName": "STS-ETL-WORKER",
    "APIVersion": "0.6.0",
    "UserAgent": "log-python-sdk-v-0.6.46, sys.version_info(major=3, minor=7, micro=3, releaselevel='final', serial=0), linux-consumergroup-etl-2bd3fdfdd63595d56b1ac24393bf5991",
    "InputLines": "0",
    "Status": "200",
    "__time__": 1645167812,
    "__topic__": "operation_log",
    "NetInflow": "0",
    "RequestId": "620F44C456458F67F72160A0",
    "LogStore": "nginx-moni",
    "__source__": "log_service",
    "Method": "PullData",
    "ClientIP": "203.**.**.330",
    "Latency": "2191",
    "Role": "aliyunlogetlrole",
    "NetworkOut": "0",
    "Project": "aliyun-test-project",
    "AccessKeyId": "STS.NUE****1hm",
    "Shard": "0"
}
The following table describes the types of user information.
Type | Field |
Alibaba Cloud account |
|
RAM user |
|
Sts |
|
Query the number of failed requests
On the query and analysis page of the internal-operation_log Logstore, execute the following statement to query the number of failed requests. In this example, a request whose HTTP status code is greater than 200 is considered a failed request. For more information, see Query and analyze logs.
Status > 200 | select count(*) as pv