You can use CloudMonitor to monitor the resource usage of Simple Log Service based on various metrics including write traffic, overall queries per second (QPS), and service status. You can configure alert rules to monitor log collection and shard usage and identify related exceptions.
Prerequisites
If you want to use a Resource Access Management (RAM) user to view the metrics that are provided by CloudMonitor, make sure that the RAM user is granted the read-only or read and write permissions on CloudMonitor. To grant the permissions, you can use an Alibaba Cloud account to attach the AliyunCloudMonitorReadOnlyAccess or AliyunCloudMonitorFullAccess policy to the RAM user. For more information, see Step 2: Grant permissions to the RAM user.
View metrics that are provided by CloudMonitor
Log on to the Simple Log Service console.
In the Projects section, click the project you want.

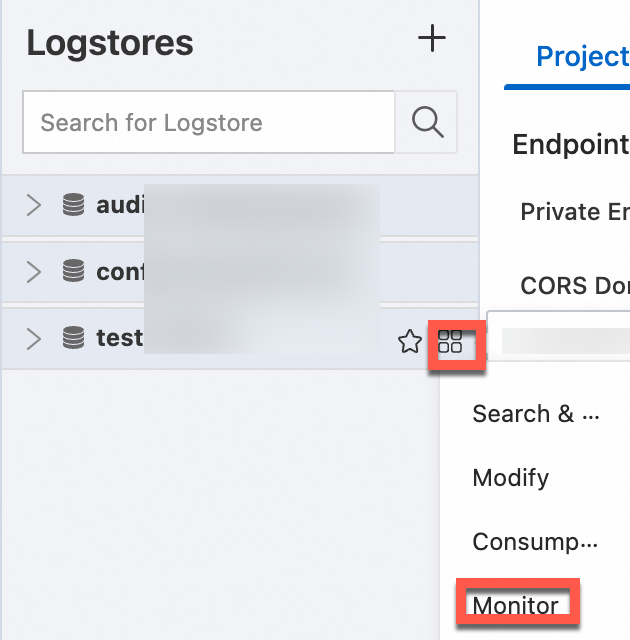
On the tab, find the logstore whose metrics you want to view and choose .

View the metrics.
Metric description
Metric | Description |
Write Traffic | The size of data that is written in real time to the logstore per minute. |
Size of Raw Data | The original size of data that is written to the logstore per minute. This metric measures the size of the data before compression. |
Overall QPS | The QPS of all operations. |
Number of operations | The number of API operations that are called per minute. For more information, see List of operations by function. |
Service Status | The numbers of returned HTTP status codes. |
Traffic resolved successfully | The size of raw log data that is collected by Logtail. |
Lines resolved successfully | The number of log lines that are collected by Logtail. |
Lines failed to be resolved | The number of log lines that Logtail fails to collect. If statistics are displayed in this chart, errors occurred during log data collection. |
Number of errors | The number of errors that occurred during log data collection. |
Number of error instances | The number of machines on which errors occurred during log data collection. |
Number of error IPs | The numbers of IP addresses for which different types of errors are reported. You can identify an IP address based on the error type. Then, you can log on to the machine to view the /usr/local/ilogtail/ilogtail.LOG file and troubleshoot the error. |
Lines | The number of log lines that are written to the logstore per minute. |
Read Traffic | The size of data that is read in real time from the logstore per minute. |
Delay Time of Consumption | The difference between the current consumption checkpoint and the point in time at which the most recent data is written to the queue. In a consumer group, the value of this metric is the largest time difference among all shards. |
Configure alert rules
Simple Log Service allows you to configure alert rules by using CloudMonitor. If the Service Status metric meets a trigger condition in an alert rule, a text message or an email notification is sent to the specified recipients. You can configure alert rules in the CloudMonitor console to monitor log collection and shard usage and identify related exceptions.
On the monitoring page of a cloud service, you can configure alert rules for resources. When an alert is triggered based on the configured alert rules, CloudMonitor sends an alert notification to you.
Log on to the CloudMonitor console.
In the left-side navigation pane, choose .
On the Cloud Service Monitoring page, select a cloud service.
Create an alert rule for the cloud service.
Create an alert rule on the Alert Rules page.
On the monitoring page of the cloud service, find the resource for which you want to create an alert rule. Click Alert Rules in the Actions column.
On the Alert Rules page, click Create Alert Rule.
In the Create Alert Rule panel, configure parameters for the alert rule.
Click Confirm.
Create an alert rule on the monitoring page of the cloud service.
On the monitoring page of the cloud service, click Create Alert Rule in the upper-right corner.
In the Create Alert Rule panel, configure parameters for the alert rule.
Click Confirm.
NoteFor more information about how to configure parameters for an alert rule, see Create an alert rule.
View alert rules that are configured by using CloudMonitor
On the monitoring page of a cloud service, you can view all alert rules that are configured for resources.
Log on to the CloudMonitor console.
In the left-side navigation pane, choose .
On the Cloud Service Monitoring page, select a cloud service.
On the monitoring page of the cloud service, click View Alert Rules in the upper-right corner.
 > Monitor