This topic describes how to use Grafana to access the Elasticsearch-compatible API of Simple Log Service.
Alibaba Cloud has proprietary rights to the information in this topic. This topic describes the capabilities of Alibaba Cloud to interact with third-party services. The names of third-party companies and services may be referenced.
Prerequisites
Elasticsearch supports connections to Grafana 8.x, Grafana 9.x, Grafana 10.x, and Grafana 11.x. In this topic, Grafana 11.4.0 is used.
-
A project and a Standard logstore are created, and logs are collected. For more information, see Manage projects, Create a Logstore, and Data collection overview.
-
Indexes are created before you query logs. For more information, see Create indexes.
-
An AccessKey pair is created for the RAM user, and the required permissions to query logs in logstores are granted to the RAM user. For more information, see RAM authorization.
Background information
Grafana is an open-source data visualization and monitoring platform that supports multiple data sources, such as Graphite, InfluxDB, Prometheus, and Elasticsearch. Grafana allows you to configure multiple charts and query data.
If you use Grafana to analyze Elasticsearch data and want to migrate Elasticsearch data to Simple Log Service, you can use the Elasticsearch-compatible API of Simple Log Service. Then, you can use the Elasticsearch data source plug-in of Grafana to access Simple Log Service for data query and analysis.
Simple Log Service also provides the native Grafana data source plug-in. For more information, see Connect to Grafana. The following table describes the differences between the Elasticsearch data source plug-in of Grafana and the native Grafana data source plug-in of Simple Log Service.
Item | Grafana and Elasticsearch-compatible API | Grafana and Simple Log Service native plug-in |
Grafana data source plug-in | Elasticsearch data source plug-in that is provided by Grafana by default | Native Grafana data source plug-in that is provided by Simple Log Service and requires manual installation |
Search syntax | Elasticsearch DSL syntax | Simple Log Service index-based search syntax and SQL analysis syntax |
Add a data source
Log on to the Grafana console.
In the left-side navigation pane, choose .
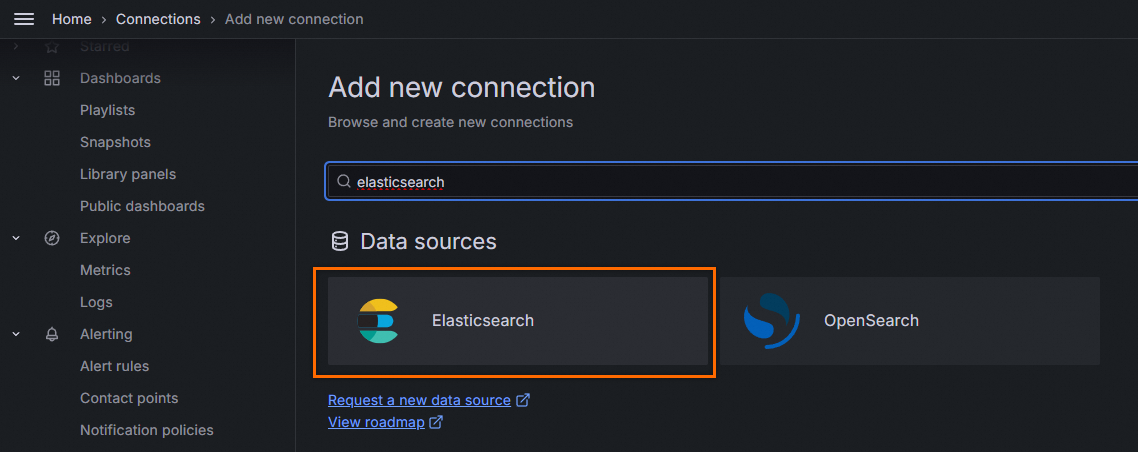
On the Add new connection page, search for Elasticsearch, and then click Elasticsearch in the Data sources section.
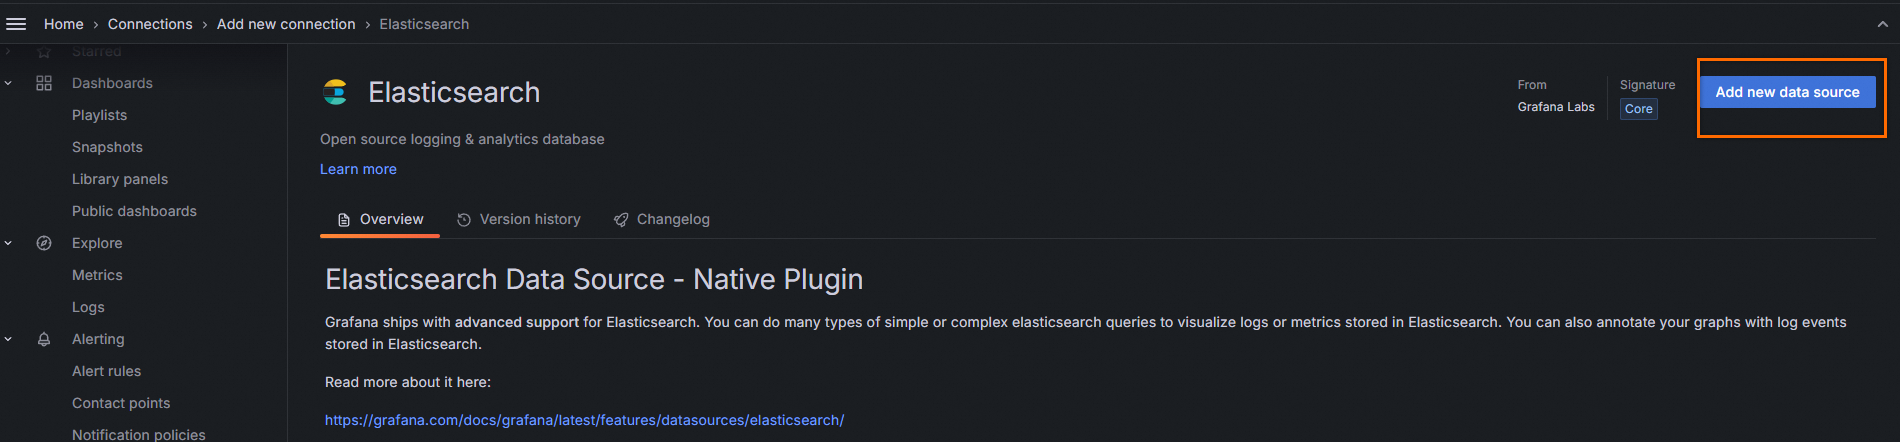
In the upper-right corner of the Elasticsearch details page, click Add new data source.
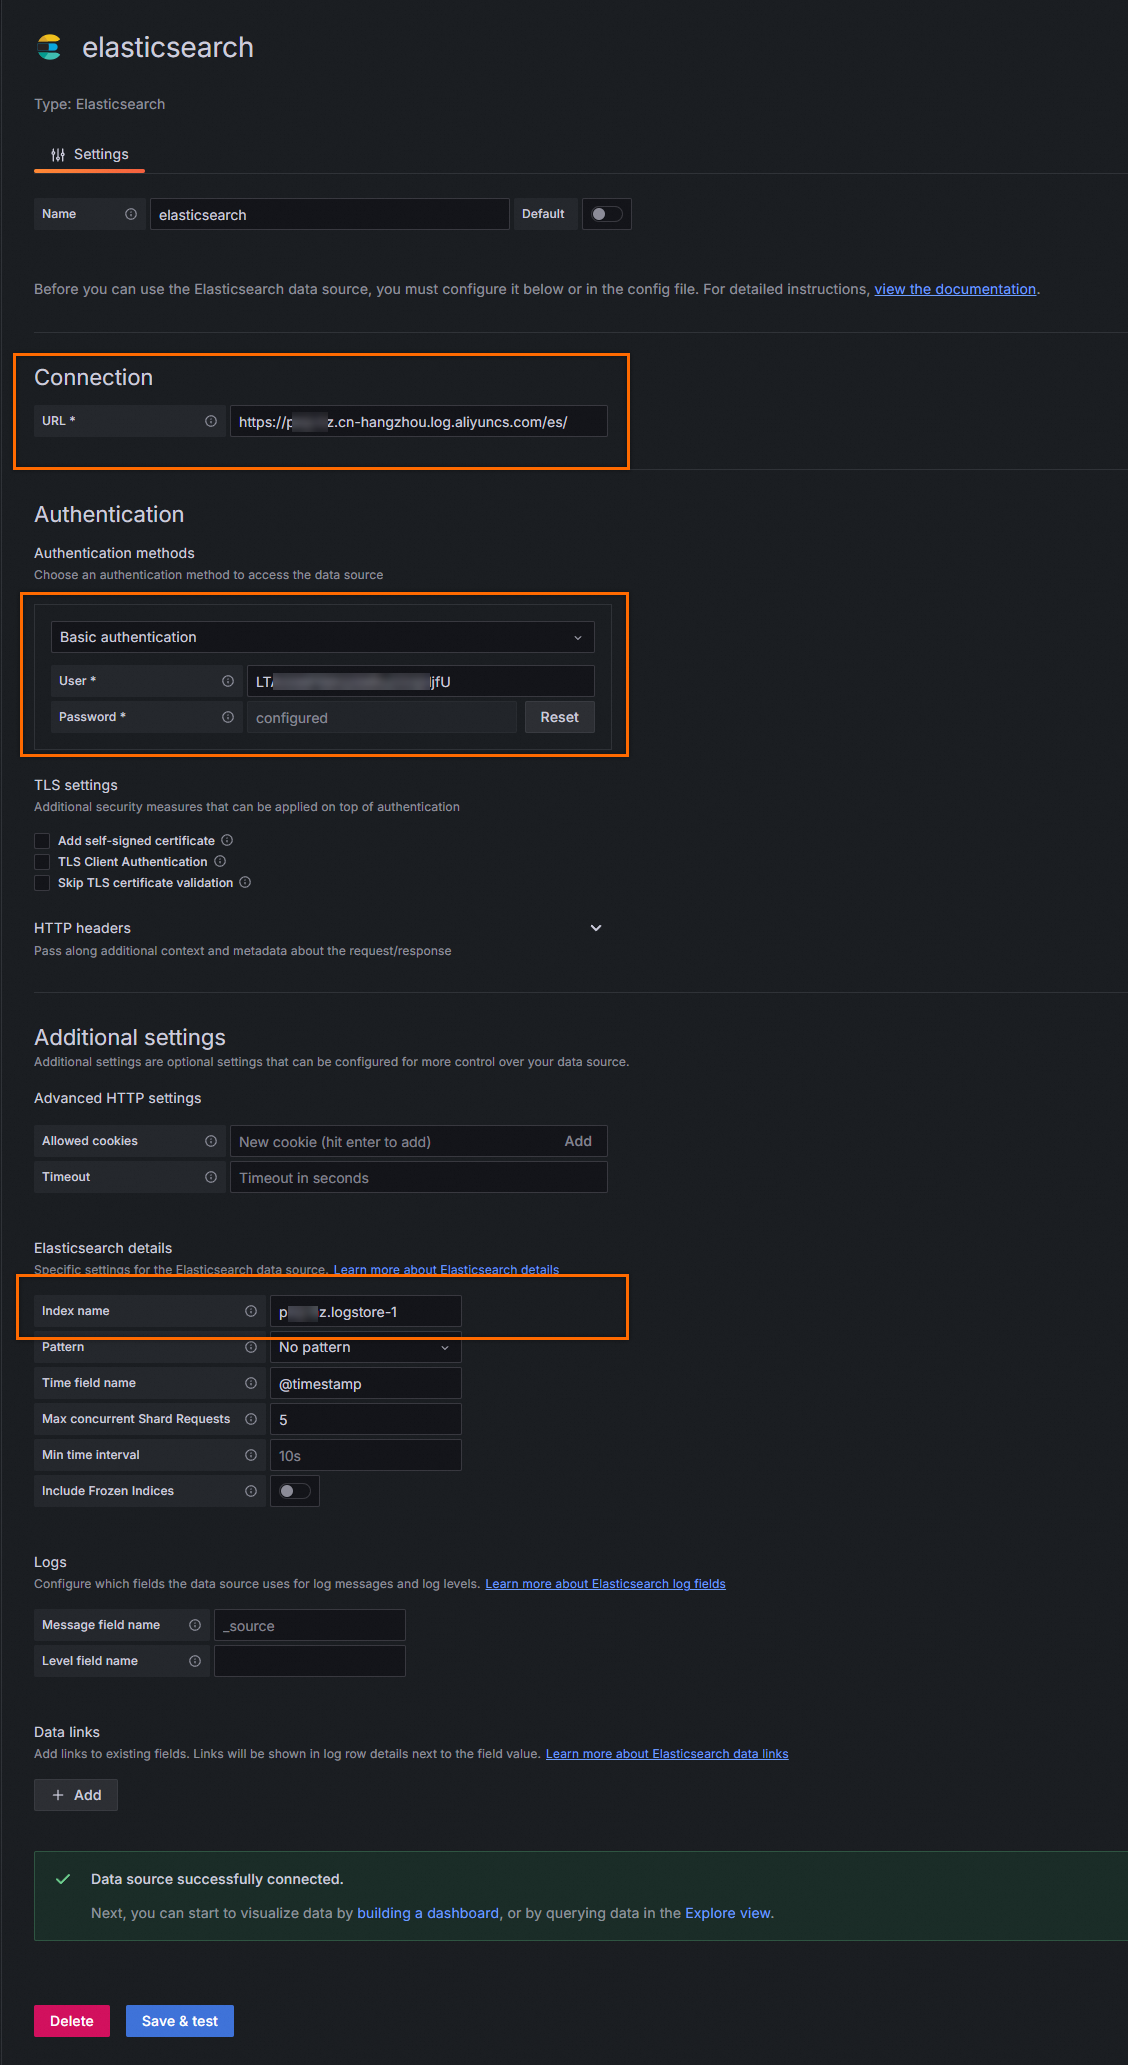
On the Settings tab, configure the parameters and click Save & test to test the connectivity. If the Data source successfully connected message appears, the configuration is valid. If an error occurs, you can troubleshoot the error by following the instructions in FAQ and troubleshooting.
The following table describes the parameters that you must configure. You can retain the default values for other parameters.
Section
Parameter
Description
Connection
URL
The URL that is used to access data. The URL is in the
https://${project}.${sls-endpoint}/es/format.${project}specifies the name of the project.${sls-endpoint}specifies the endpoint of the Simple Log Service project. For more information, see Endpoints. Example:https://etl-guangzhou.cn-guangzhou.log.aliyuncs.com/es/.ImportantYou must use the HTTPS protocol.
Authentication methods
Basic authentication
Select Basic authentication from the drop-down list.
User
The AccessKey ID of your Alibaba Cloud account.
We recommend that you use the AccessKey pair of a Resource Access Management (RAM) user who has the permissions to query logs in Logstores. You can use the permission assistant feature to grant the query permissions to the RAM user. For more information, see Configure the permission assistant. For more information about how to obtain an AccessKey pair, see AccessKey pair.
Password
The AccessKey secret of your Alibaba Cloud account.
We recommend that you use the AccessKey pair of a RAM user who has the permissions to query logs in Logstores. You can use the permission assistant feature to grant the query permissions to the RAM user. For more information, see Configure the permission assistant. For more information about how to obtain an AccessKey pair, see AccessKey pair.
Elasticsearch details
Index name
The name of the Elasticsearch index pattern. The name must be in the
${Simple Log Service Project name}.${Logstore name}format. For example, if a project is named etl-guangzhou and a Logstore is named es_test22, you must set the Index name parameter toetl-guangzhou.es_test22.
Configure sample charts
After you add a data source, Grafana can access the data that is stored in Simple Log Service. You can use the Elasticsearch data source plug-in of Grafana to connect to the Elasticsearch-compatible API of Simple Log Service. This way, you can easily configure chart visualization without the need to write SQL statements. In the following configuration examples, NGINX access logs are used.
Query the overall QPS curve
In the Lucene Query field, specify filter conditions based on the Elasticsearch Lucene syntax.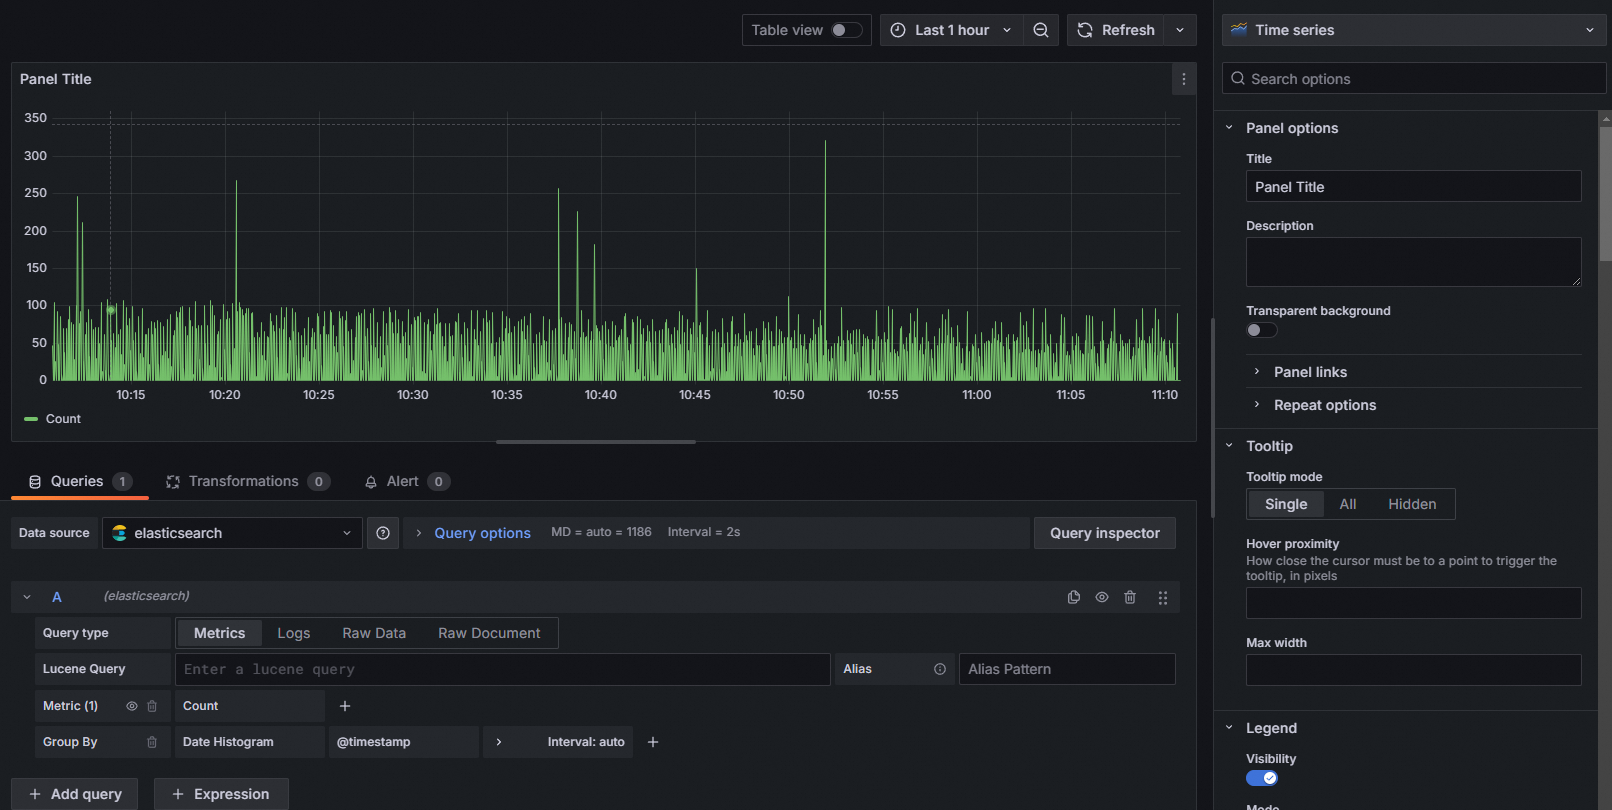
Query a curve whose HTTP status code is 200
In the Lucene Query field, enter status: 200.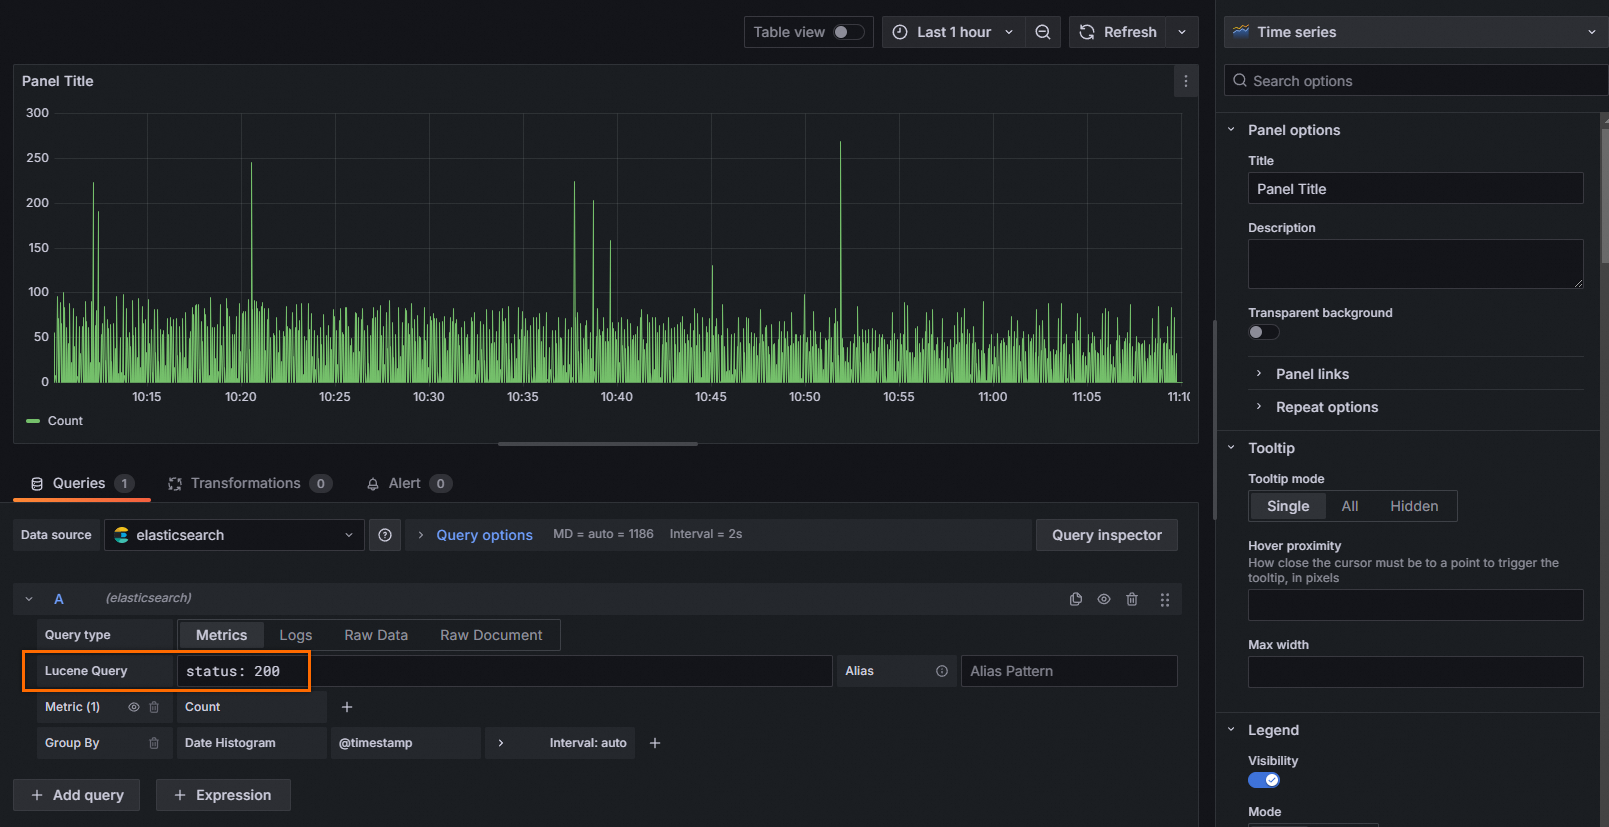
Query the URIs of top requests
In the Group By field, select Terms, and then select the request_uri field.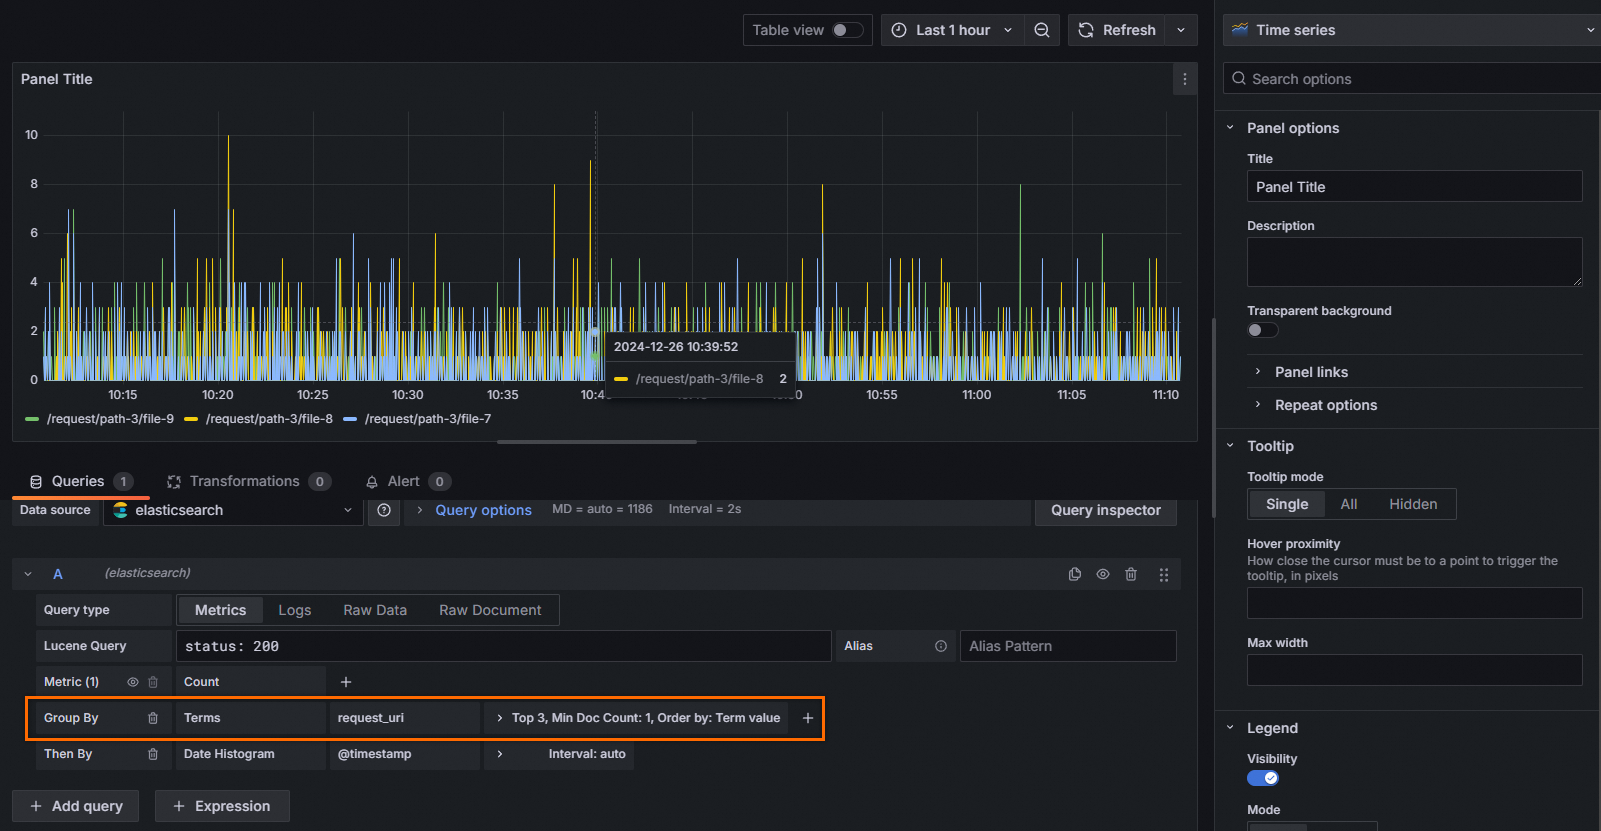
Query the quantiles of the response time
In the Metric field, select Percentiles, and then select the upstream_response_time field and set the Values field to a quantile value, such as 50,95,99.
View the quantiles of the response time by top request URL
In the Metric field, select Percentiles, and then select the upstream_response_time field and set the Values field to 99. In the Group By field, select Terms, and then select the request_uri field.

View the URIs of top requests whose HTTP status code is not 200
In the Lucene Query field, enter NOT status: 200. In the Group By field, select Terms, and then select the request_uri field.

View the URIs and request methods of top requests whose HTTP status code is not 200
In the Lucene Query field, enter NOT status: 200. In the Group By field, select Terms, and then select the request_uri field. In the Then By field, select Terms, and then select the request_method field.
