Charts allow you to configure global settings for a chart and configure personalized display settings for the results of a single query statement or for a single column of data in the results.
General Configurations
On the General Configurations tab, you can configure global settings for a chart. The settings take effect on the entire chart.
The global settings include the basic settings, standard settings, and attributes of different charts. For more information, see the following topics:
You can configure global settings for a chart on the General Configurations tab.
Basic Configurations
Parameter
Description
Title
The title of the chart.
Display Title
If you turn on Display Title, the title of the chart is displayed.
Display Border
If you turn on Display Border, the borders of the chart are displayed.
Display Background
If you turn on Display Background, the background color of the chart is displayed.
Display Time
If you turn on Display Time, the query time range of the chart is displayed.
Fixed Time
If you turn on Fixed Time, the query time range of the chart is independent of the global time range of the dashboard.
Standard Configurations
Parameter
Description
Format
The display format of numeric values.
Unit
The unit of numeric values.
Number of Digits after Decimal Point
The decimal places of numeric values.
Display Name
The name of the display field.
If you specify a value for Display Name, the value is used as the names for all display fields in the chart. If you want to change the name of a display field, you must configure parameters on the Field Configuration tab.
Color Scheme
The color scheme of the chart.
Built-in: uses the built-in color scheme.
Solid: uses the color that you select.
Threshold: uses different colors for different values based on the specified thresholds for the values.
Threshold
Parameter
Description
Threshold Mode
The display mode of the thresholds.
Threshold
The thresholds of numeric values.
If you set Color Scheme to Threshold and specify thresholds for numeric values in the Threshold section, the values in the chart are displayed in different colors based on the specified thresholds.
Value Mapping
Parameter
Description
Value Mapping
The settings of value mapping. You can replace values in the chart with text or icons.
For example, if you set Value to 200, Mapping Type to Text, and Mapping Value to Success, all values of 200 in the chart are replaced with Success.
Variable Replacement
Parameter
Description
Variable Replacement
The settings of variable replacement. You can click AddVariable Replacement to add a filter of the Replace Variable type to a chart. After you configure the settings of variable replacement on the General Configurations tab, Simple Log Service adds a filter in the upper-left corner of the chart. You can select a value from the filter drop-down list. After you select a value, Simple Log Service automatically replaces the variable in the query statement of the chart with the variable value indicated by the value that you select, and performs a query and analysis operation. For more information, see Example 2: Configure variable replacement.
Documentation
Parameter
Description
Add Documentation Link
The button that allows you to specify custom document links and descriptions. After you configure the settings, the specified information is displayed in the upper right corner of the chart.
Field Configuration
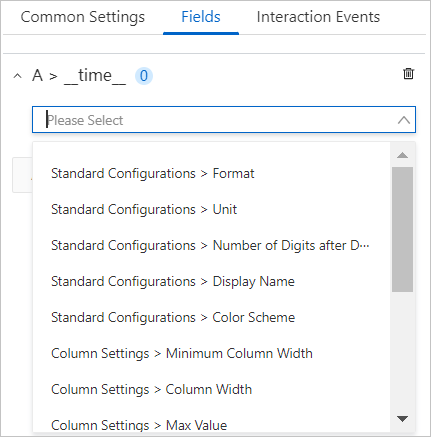
On the Field Configuration tab, you can configure personalized display settings for the results of a single query statement or for a single column of data in the results. The settings take effect only on the results of the selected statement or the selected column.
For more information about the descriptions and examples of parameter configurations on the Field Configuration tab, see the following topics:

Differences between the General Configurations and Field Configuration tabs
The two tabs provide similar configuration items but differ in the applicable scopes of the configuration items. The settings on the General Configurations tab take effect on the entire chart. The settings on the Field Configuration tab take effect on the results of a single query statement or a single column.
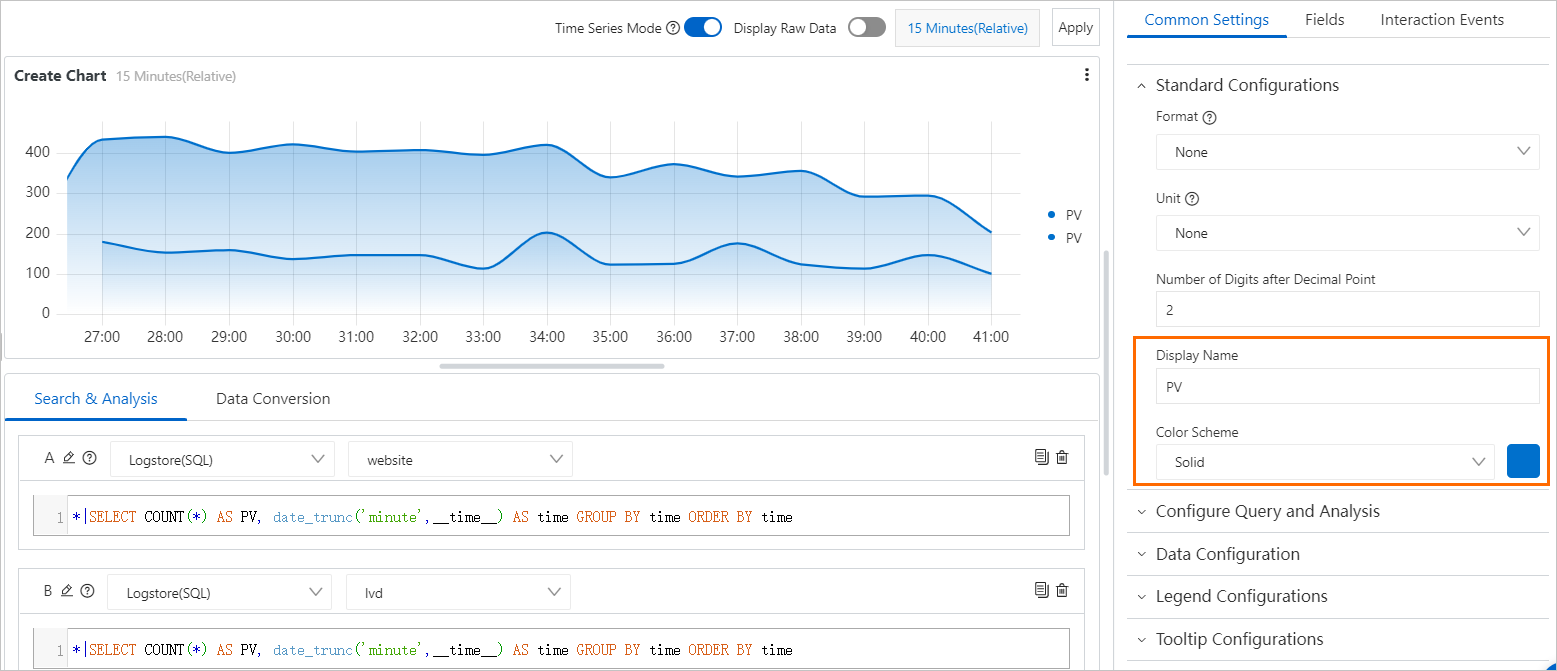
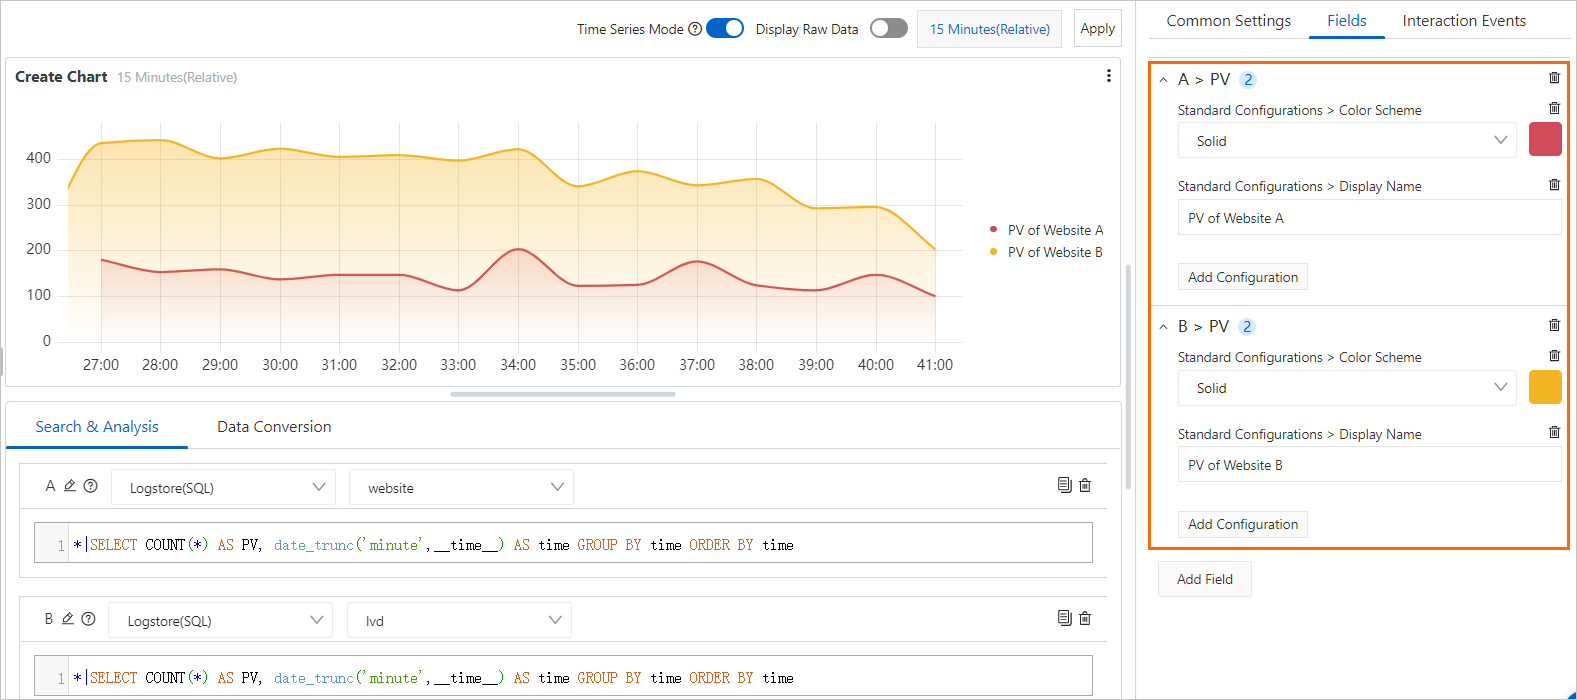
For example, you want to display the numbers of page views (PVs) for two websites within the current hour in a line chart and you want to distinguish between the numbers by color and legend. If you configure Display Name and Color Scheme on the General Configurations tab, the line segments for the two websites have the same color and legend name. As a result, you cannot distinguish between the numbers. In this case, you can configure personalized display settings on the Field Configuration tab to distinguish between the numbers.
General Configurations
If you set Color Scheme to Solid and Display Name to PV, the colors and legend names for the two line segments are the same.

Field Configuration
You can add the A > pv field to configure settings for the line segment that represents the PV data in the query and analysis results of Website A. You can select the red color for Standard Configurations > Color Scheme and enter PV of Website A for Standard Configurations > Display Name.
You can add the B > pv field to configure settings for the line segment that represents the PV data in the query and analysis results of Website B. You can select the yellow color for Standard Configurations > Color Scheme and enter PV of Website B for Standard Configurations > Display Name.
