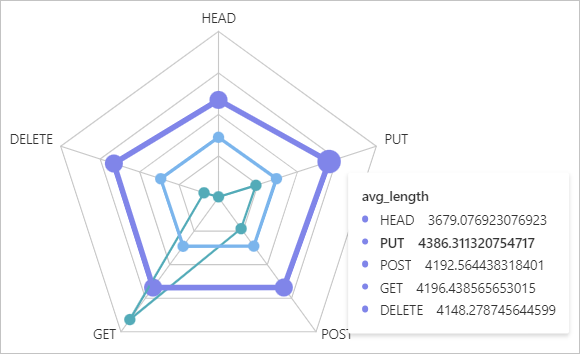
You can use a radar chart to visualize multi-dimensional data in Simple Log Service. This topic describes the basic configurations of a radar chart.
Background information
A radar chart can be used to compare multiple columns of data in the same dimension.
For example, the result of a query statement includes the request_method, total, avg_time, and avg_length columns. The total, avg_time, and avg_length columns indicate the total number of requests, average request time, and average request length for each request method within a specific period of time. 
In this case, you can use a radar chart to visualize the preceding columns of data for each request method. 
Common Settings tab
On the Common Settings tab, you can configure global settings for the radar chart.
Basic configurations section
Parameter
Description
Title
The title of the radar chart.
Show Title
If you turn on Show Title, the title of the radar chart is displayed.
Show Border
If you turn on Show Border, the borders of the radar chart are displayed.
Show Background
If you turn on Show Background, the background color of the radar chart is displayed.
Show Time
If you turn on Show Time, the query time range of the radar chart is displayed.
Fixed Time
If you turn on Fixed Time, the specified time range remains unchanged regardless of whether the global time range of the dashboard changes.
Standard Configurations section
Parameter
Description
Format
The display format of numeric values.
Unit
The unit of numeric values.
Number of Digits after Decimal Point
The number of digits after the decimal point of numeric values.
Display Name
The name of the columns.
If you specify a display name, the name of each column is changed to the display name. If you want to change the name of a column, you can configure the name on the Fields tab.
Color Scheme
The color scheme that specifies the colors of the columns in the radar chart.
Built-in: The built-in color scheme is used.
Solid: You can select a color.
Configure Query and Analysis section
Parameter
Description
Category
The field that specifies the dimension to display data.
Value Column
The field that specifies the numeric value to be displayed.
Radar Chart configurations section
Parameter
Description
Radar Chart Type
The shape of the radar chart. Valid values: Polygon and Circle.
Chart Configurations section
Parameter
Description
Point Size
The size of the points in the radar chart.
Connector Width
The width of the connectors in the radar chart.
Legend Configurations section
Parameter
Description
Display Legend
If you turn on Display Legend, the legend is displayed in the radar chart.
Legend
The position of the legend in the chart.
Actions
The method that is used to display the columns in the legend.
Single: If you click a column name in the legend, only the data of the column is displayed in the radar chat.
Switch: If you click a column name in the legend, the data of the column is hidden or displayed in the radar chart.
Maximum Width (Height)%
The maximum width or height of the legend.
Fields tab
You can configure custom display settings for the result of a single query statement or for a single column in the result. For information about the parameters on the Fields tab, see Common Settings tab.
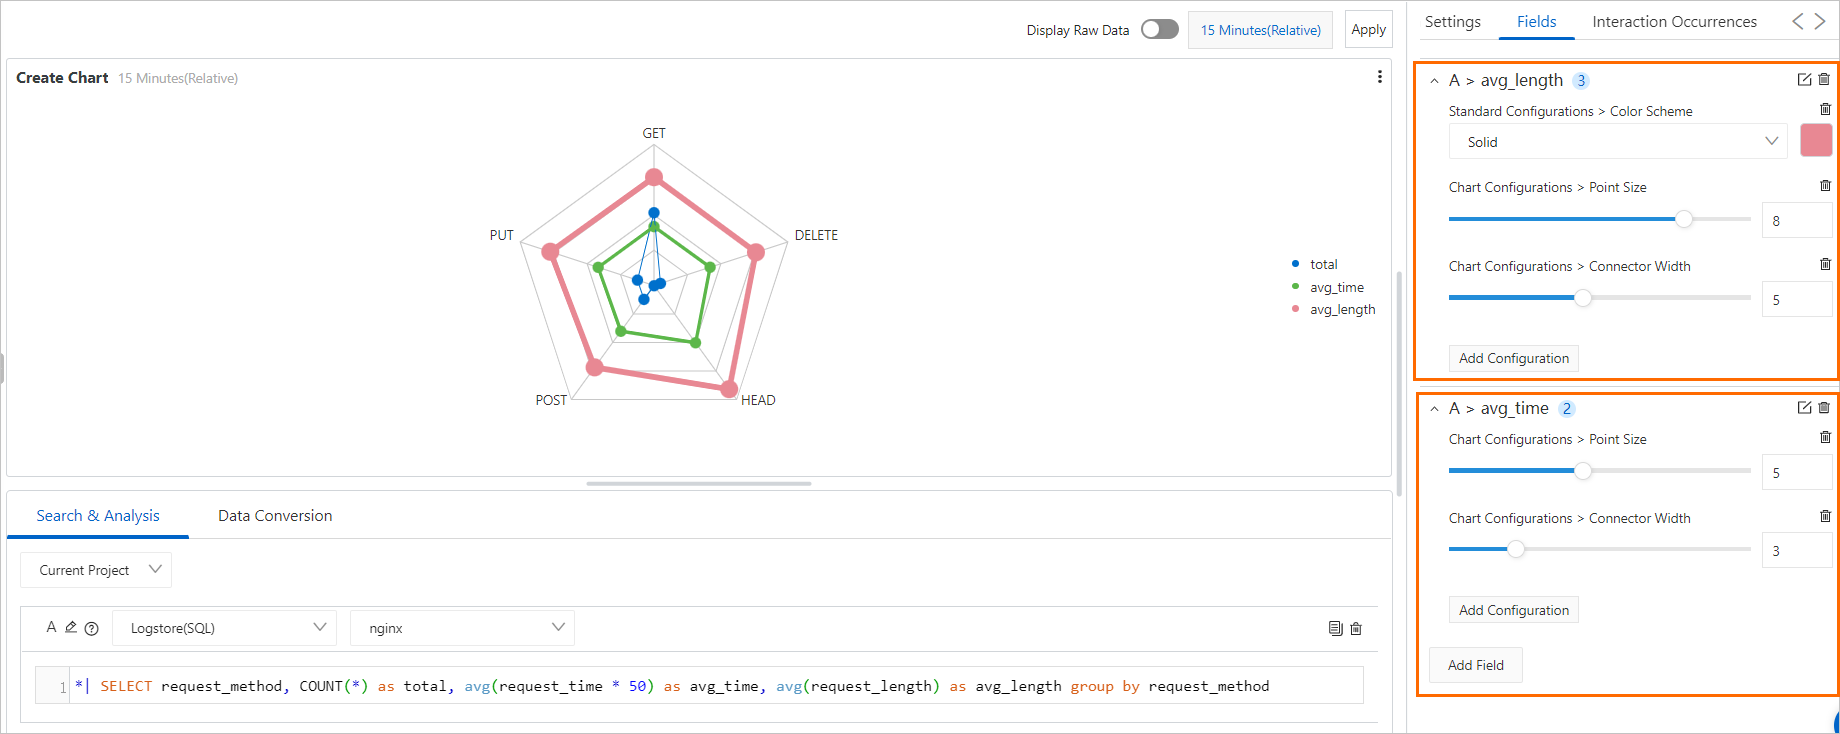
On the Fields tab, you can specify colors and widths for the connectors of each column based on your business requirements. The following figure shows a sample radar chart.
In this example, the A > avg_length field is added to configure the avg_length column in the result of Query Statement A. The color of the connectors is set to pink, the width of the connectors is set to 5, and the size of points is set to 8.
In this example, the A > avg_time field is added to configure the avg_time column in the result of Query Statement A. The width of the connectors is set to 3 and the size of points is set to 5.

Interaction occurrences
Interaction occurrences are configured to analyze a single field or the result of a single query statement to extract deeper value from the data. Interaction occurrences include events to open a Logstore, open a saved search, open a dashboard, open trace analysis, open trace details, and create a custom HTTP link. For more information, see Drill-down events.
For example, you can add the A > avg_length field to configure an interaction occurrence for the avg_length column in the result of Query Statement A. After you configure the Open Logstore interaction occurrence for the avg_length column in the result of Query Statement A, you can click a point on a pink connector and then click Open Logstore. You are redirected to the Logstore that you specified in the interaction occurrence.
