If you want to manage ApsaraDB RDS for MySQL instances, you need to understand the real-time statuses of the RDS instances. The inspection and scoring feature simplifies the process. Automatic inspection and manual inspection are supported. This feature also provides a comprehensive diagnostic report to help you make decisions at the earliest opportunity.
Prerequisites
The feature is supported only for the following types of RDS instances:
MySQL 8.0 on RDS High-availability Edition, RDS Enterprise Edition, or RDS Cluster Edition
MySQL 5.7 on RDS High-availability Edition, RDS Enterprise Edition, or RDS Cluster Edition
MySQL 5.6 on RDS High-availability Edition
MySQL 5.5 on RDS High-availability Edition
Procedure
Log on to the ApsaraDB RDS console.
In the left-side navigation pane, choose Maintenance & Monitoring > Performance Monitoring.
On the Performance Monitoring page, click the Inspection and Scoring tab.
On the Inspection and Scoring tab, perform the following operations based on your business requirements:
Enable automatic inspection and scoring
If this is the first time you enable the feature, perform the following operations: Click Enable. In the Configure Inspection and Scoring dialog box, configure the Select Engine parameter and click OK.
NoteAfter you enable this feature, the system scores each connected RDS instance once every day.
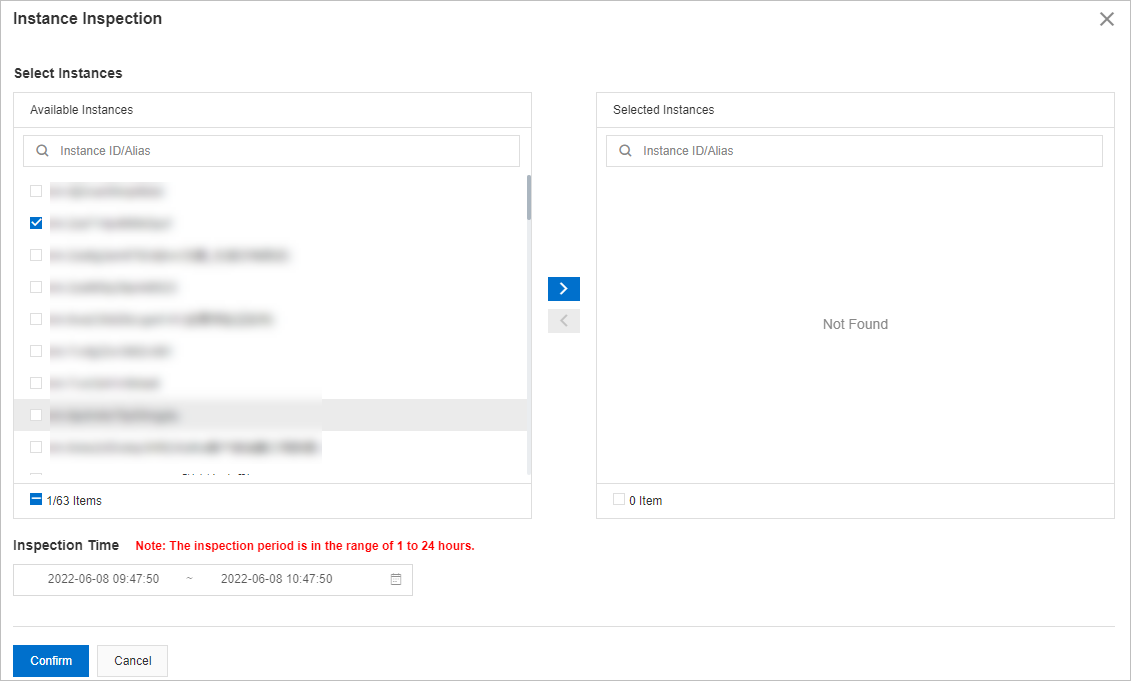
Manually initiate inspection and scoring
On the Inspection and Scoring tab, click Start Inspection.
In the Select Instances section of the Instance Inspection dialog box, select one or more RDS instances in the Available Instances section and click the
 icon to add the selected instances to the Selected Instances section.
 In the Inspection Time section, specify a time range.
NoteThe start time of an inspection cannot be later than the current time. The minimum interval between the start time and the end time is 1 hour, and the maximum interval is 24 hours.
Click Confirm.
View the inspection and scoring results
After you enable the inspection and scoring feature, you can search for an RDS instance by name or alias to view the inspection and scoring results within a specific time period.
You can click Delete in the Actions column of the required RDS instance to delete the results.
You can click Deduction Details in the Actions column of the required RDS instance to view the deduction details in the Deduction Details panel.
You can click Report in the Actions column of the required RDS instance to view the scoring report details in the Scoring Report Details panel.
You can click the ID of the required RDS instance to view the performance trend of the RDS instance on the Performance Trends tab. For more information, see Performance trends.
You can click the
 icon to download the inspection and scoring results to your computer.
Scoring rules
Deduction item | Description | Sub-item | Condition | Deducted point |
CPU Utilization (cpuUsage) | The average daily CPU utilization. If an RDS instance has multiple CPU cores, the system calculates the CPU utilization of each core and then calculates the average CPU utilization of all cores. | Warning | 70% <= cpuUsage <= 80% | 1+(cpuUsage-0.7)*20 |
Critical | cpuUsage>= 80% | min[3+(cpuUsage-0.8)*30,10] | ||
Memory Usage (memUsage) | The average daily memory usage. | Warning | 80% <= memUsage <= 90% | 1+(memUsage-0.8)*20 |
Critical | memUsage>0.9 | min[(memUsage-0.9)*50, 10] | ||
Space Usage | The storage usage is calculated by using the following formula: Storage usage = Average used storage during a day/Total storage × 100% | Available days | availableDays<=30 | 15-availableDays/3 |
Number of large tables | bigTableCount>0 | min(bigTableCount,15) | ||
Connection Usage (connectionRate) | The connection usage is calculated by using the following formula: Connection usage = Average number of connections during a day/Maximum number of connections allowed at a point in time × 100% | Warning | 70% <= connectionRate<=80% | 1 |
Critical | connectionRate>80% | 3 | ||
IOPS Usage (iopsUsage) | The IOPS usage is calculated based on the following formula: IOPS usage = Average IOPS during a day/Maximum IOPS allowed × 100%. | Warning | 70%<iopsUsage<90% | 3 |
Critical | iopsUsage>90% | 5 | ||
Active Sessions (threadRunning) | The number of active sessions generated in a day. | Warning | threadRunning>min(2*cpuCores+8,64) | 3 |
Critical | threadRunning>min(4*cpuCores+8,96) | 9 | ||
Slow SQL Statements (slowSqlCount) | The number of SQL statements that cause slow queries in a day. Note You can click the number to view the five slow SQL statements that are most frequently executed. | Detected | 0<slowSqlCount<100 | 1+(slowSqlCount-10)/30 |
Warning | 100<=slowSqlCount<500 | 4+(slowSqlCount-100)/30 | ||
Critical | slowSqlCount>=500 | min[18+(slowSqlCount-50)/30, 30)] | ||
SQL security audit (sqlInjectionCount) | The number of high-risk SQL statements and the number of SQL injection attacks. | High-risk SQL statements | riskSqlCount>0 | min(riskSqlCount,5) |
SQL injection attacks | sqlInjectionCount>0 | min(sqlInjectionCount,5) | ||
Deadlock | Indicates whether a deadlock occurs during a day. | Detected | Detected | 3 |
References
If the following issues occur on your RDS instance, you can use the features that are described in the related topics to resolve the issues:
Slow SQL queries:
Issues related to storage capacity:
Performance issues: