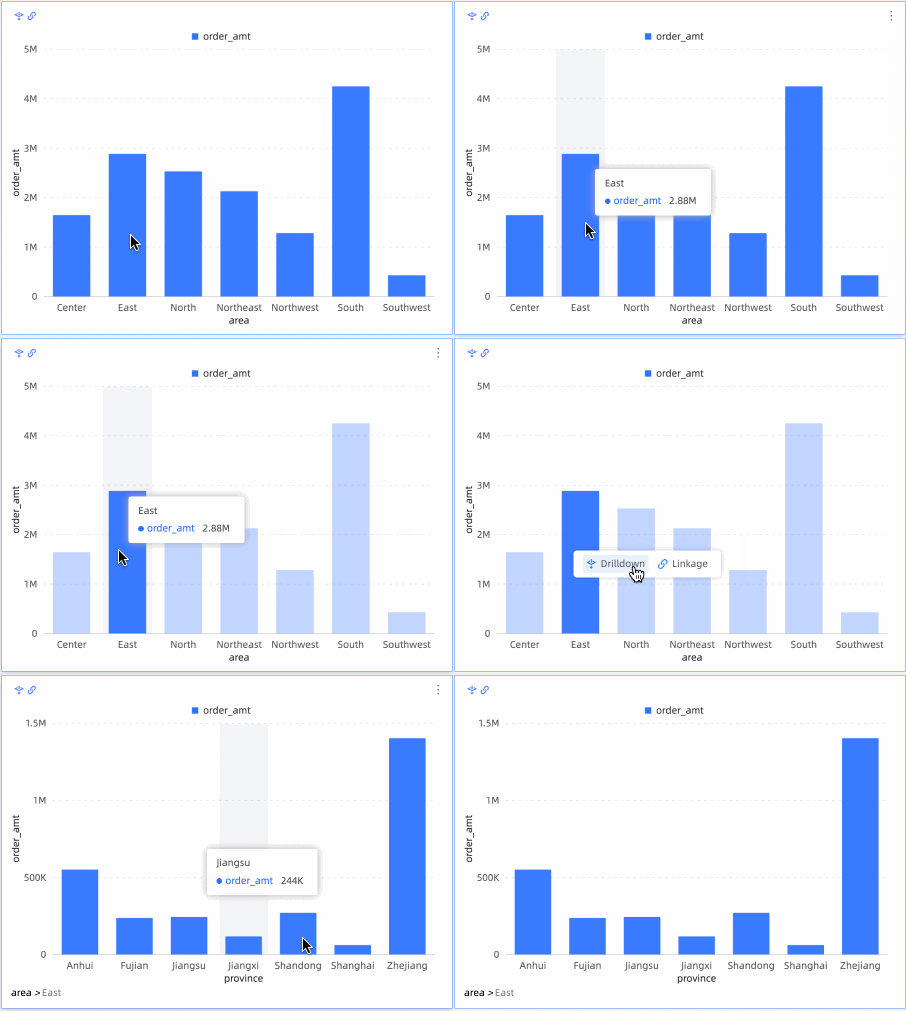
This topic describes the two methods that you can use to configure the data drilling feature and the filter interaction feature for a chart. This topic also provides figures to show the results of data drilling and filter interaction.
Prerequisites
The data source file that is used in this example is downloaded. Click Sales sample data to download the data source file.
A data source is created in the Quick BI console. For more information, see Create a file data source. in which the RDS instance resides.
A dataset is created. For more information, see Create a dataset.
In this example, the dataset name is company_sales_record.
The dataset is configured and a dashboard is created based on the dataset. In this example, the dashboard name is company_data_dashboard. For more information, see Drill.
Method 1: configure the data drilling feature first
This example takes the sales data report of each region of the company as an example, sets the drilling and linkage functions of the column chart and displays the effect.
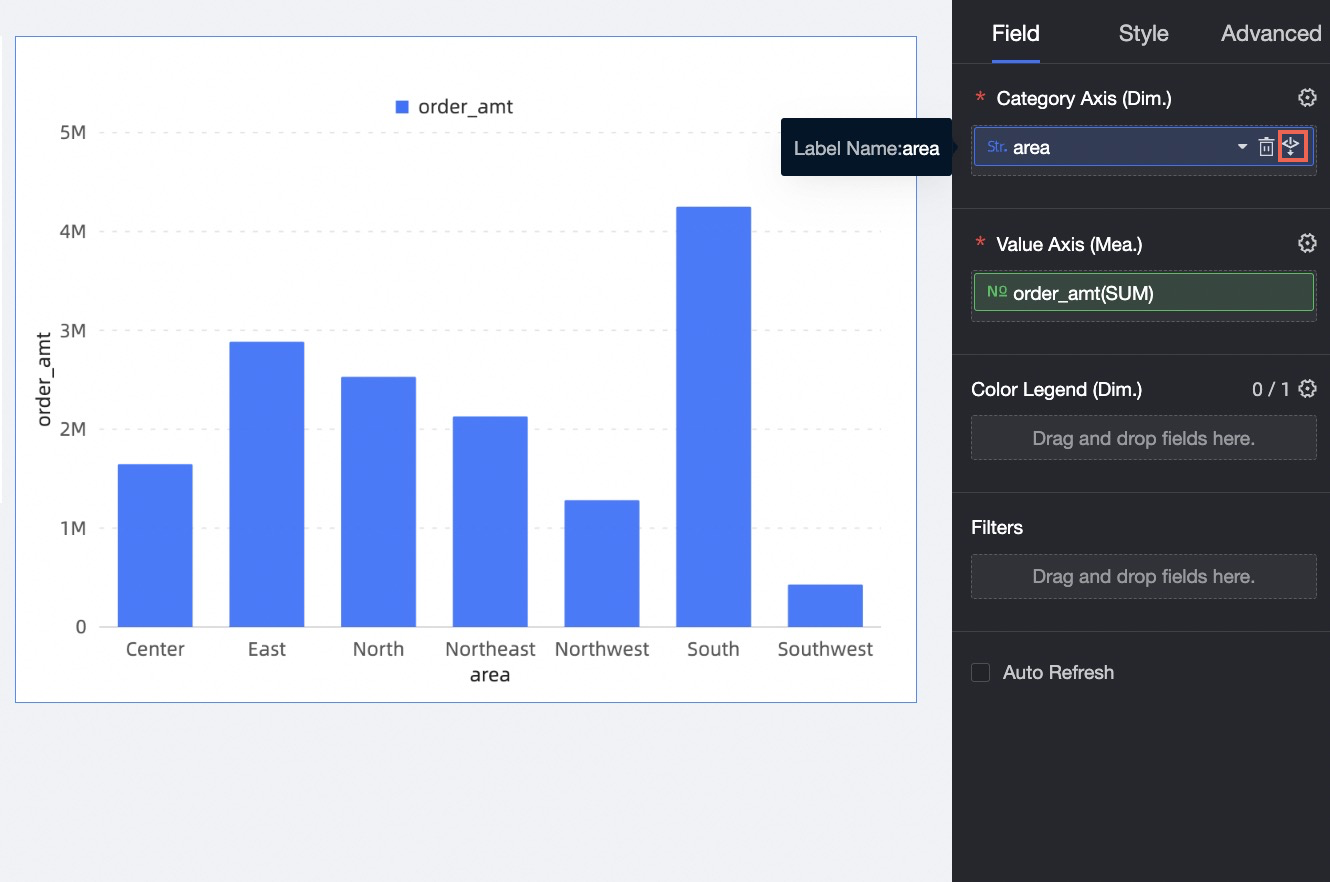
On the column chart Regional Sales Amount Fields tab, click the
 icon on the right side of the Dimensions section.
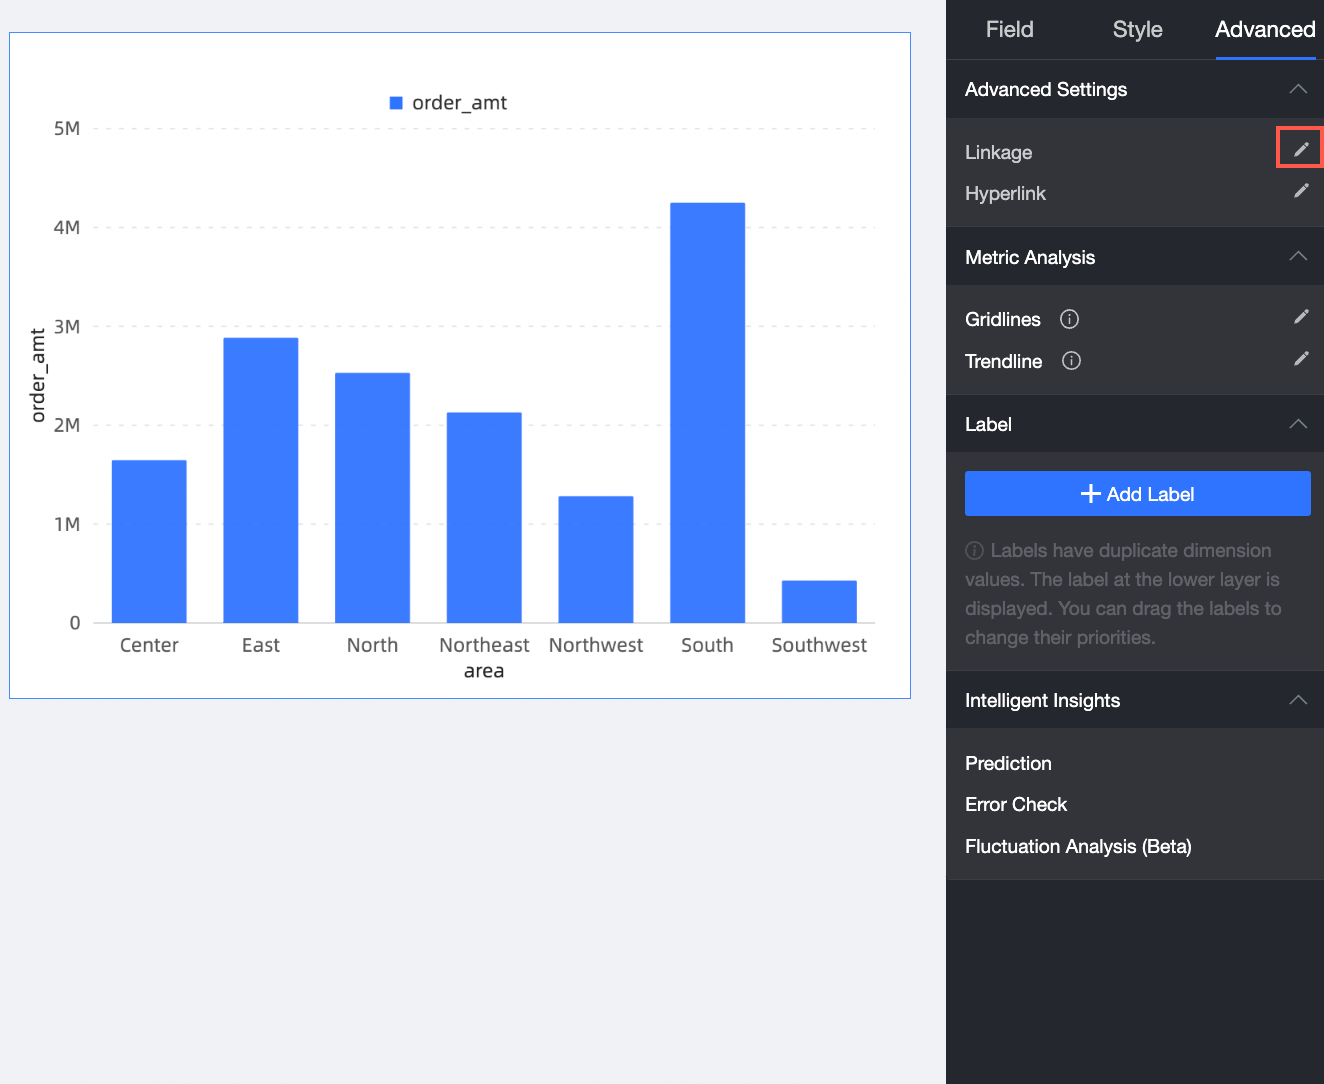
On the Analysis tab that corresponds to the column chart Regional Sales Amount, click the Pen icon next to Interaction.
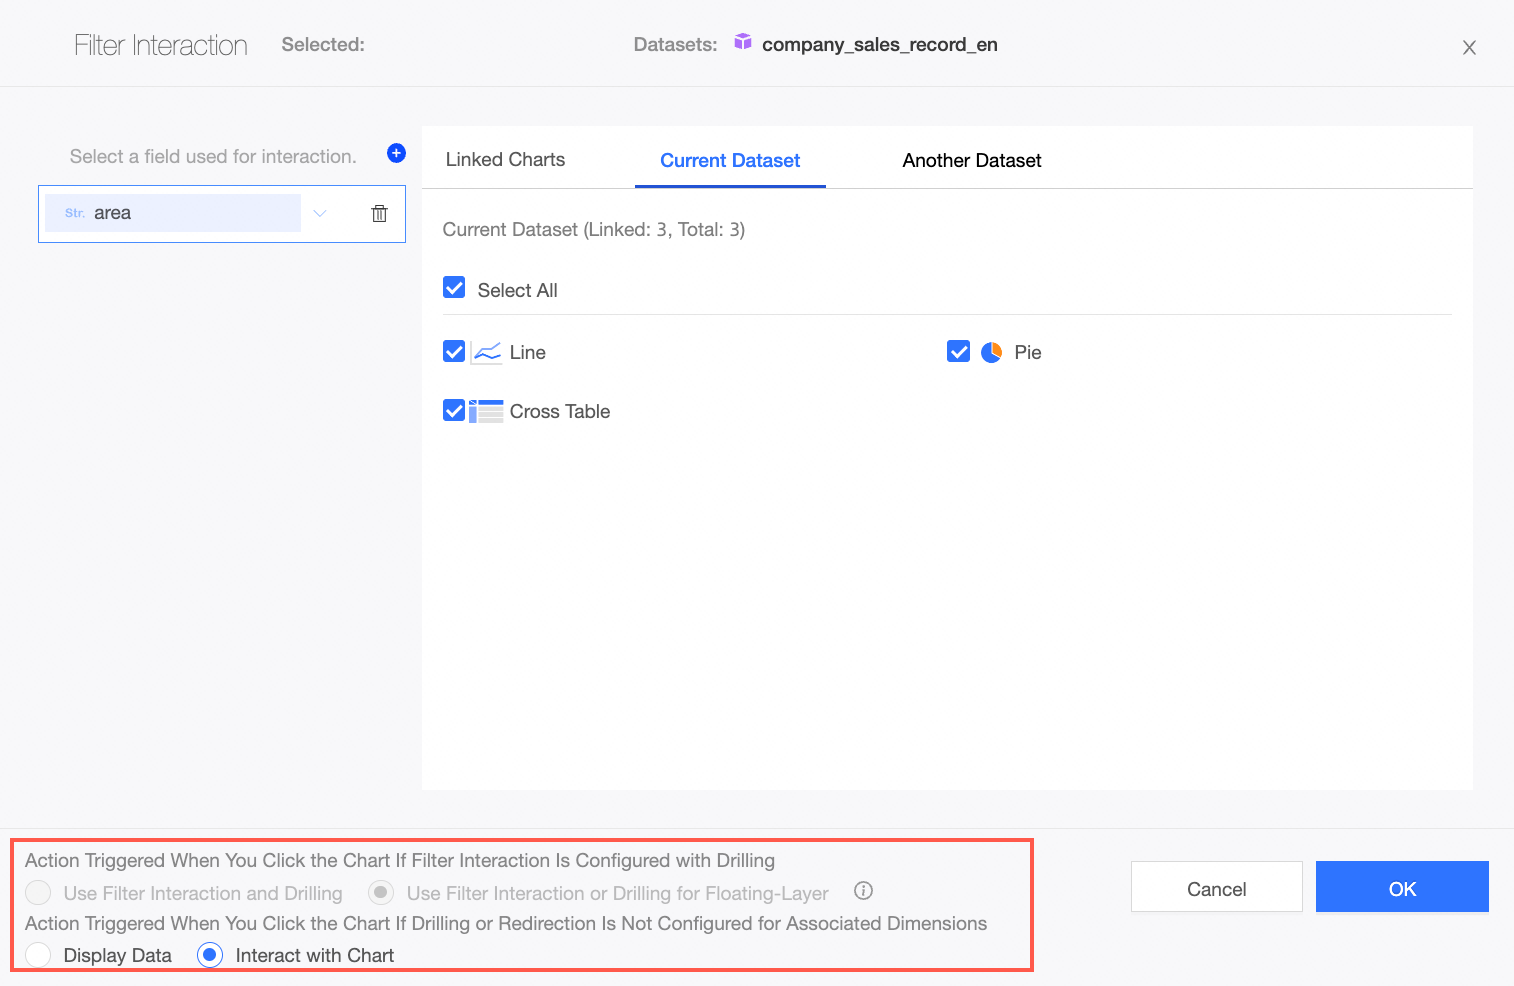
In the Chart Interaction Settings step, select a dimension field from the Region section, associate the dimension field with the chart, and then click OK.
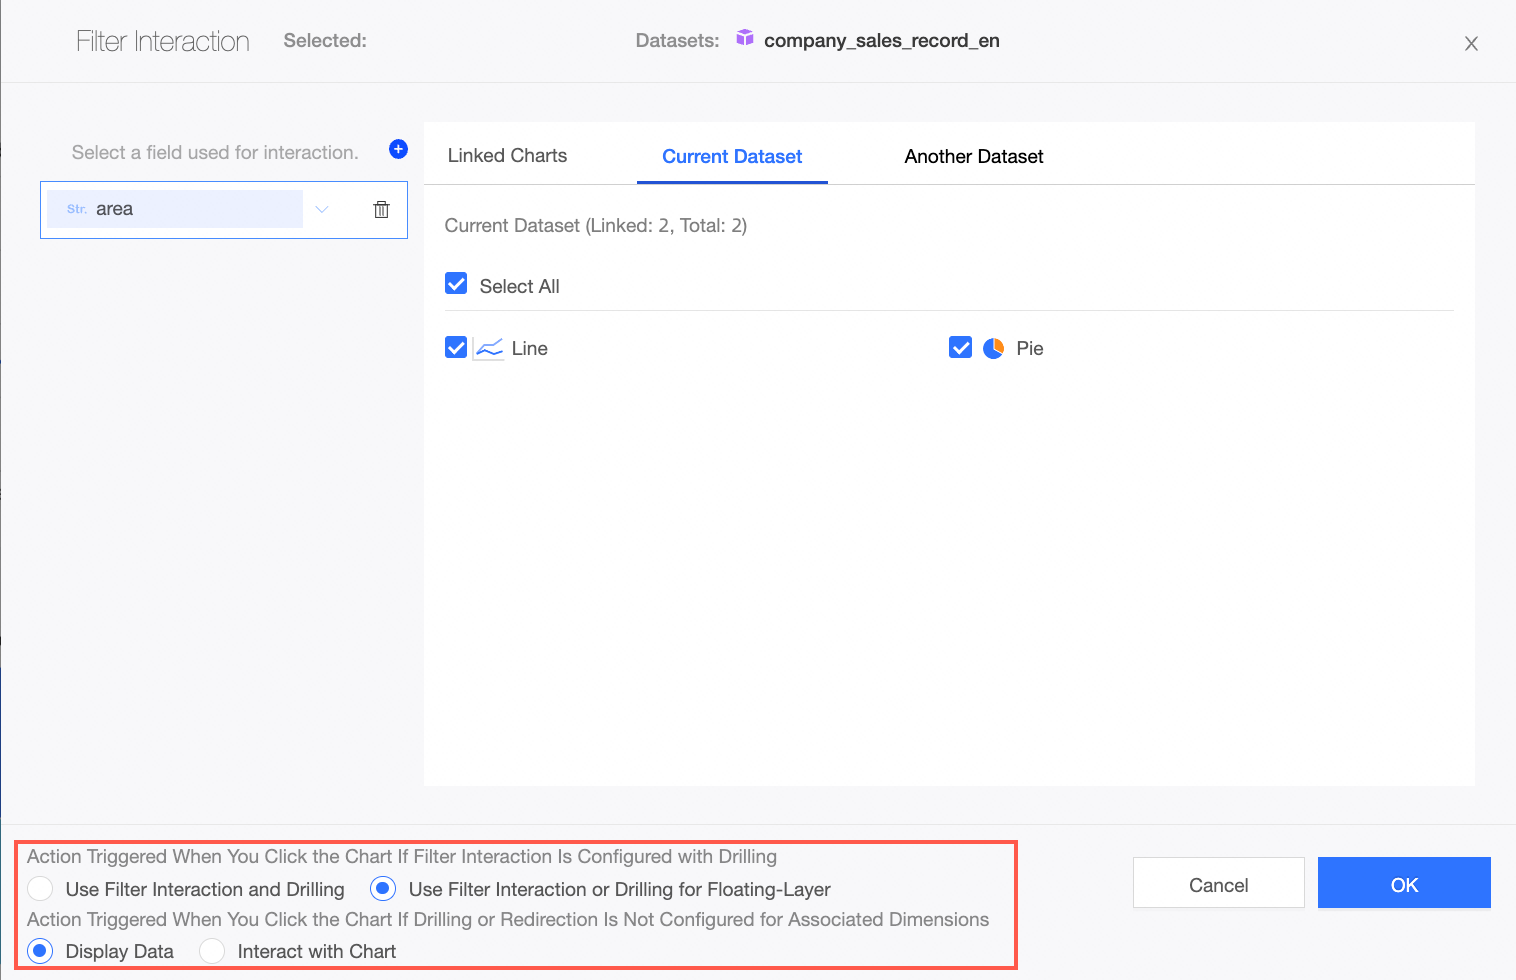
You can associate the pie chart with charts that are created based on the same dataset of this pie chart and other datasets.
Select Use Filter Interaction and Drilling or Use Filter Interaction or Drilling for Floating-Layer at the bottom of the dialog box. If you select Use Filter Interaction and Drilling, both the data drilling feature and the filter interaction feature take effect when you click a sector in the pie chart. If you select Use Filter Interaction or Drilling for Floating-Layer, you need to select Drilldown or Filter Interaction after you click a sector in the pie chart.
NoteYou can select View Data or Direct Linkage for the mobile device parameter.
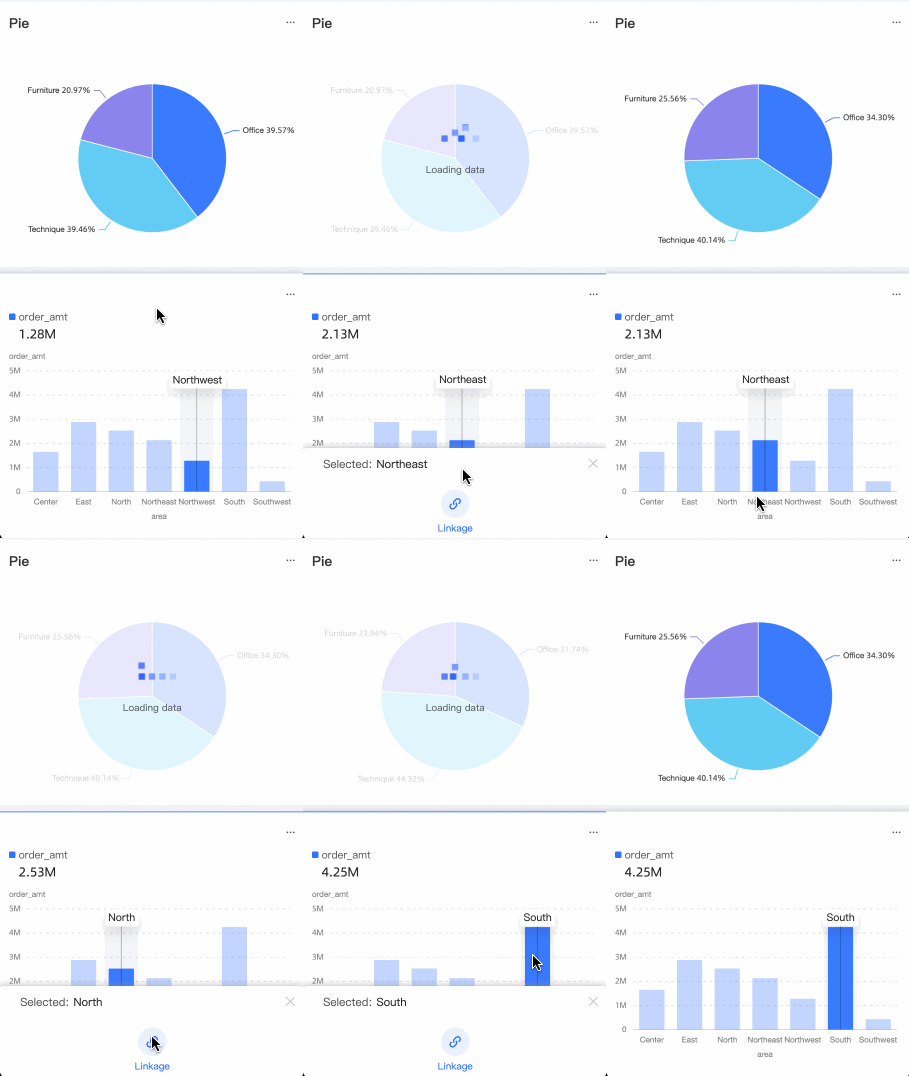
If you select View Data, you can click to display only the data of different dimension values. If you want to perform a linkage operation, you must click Linkage in the dialog box that appears. The following figure:
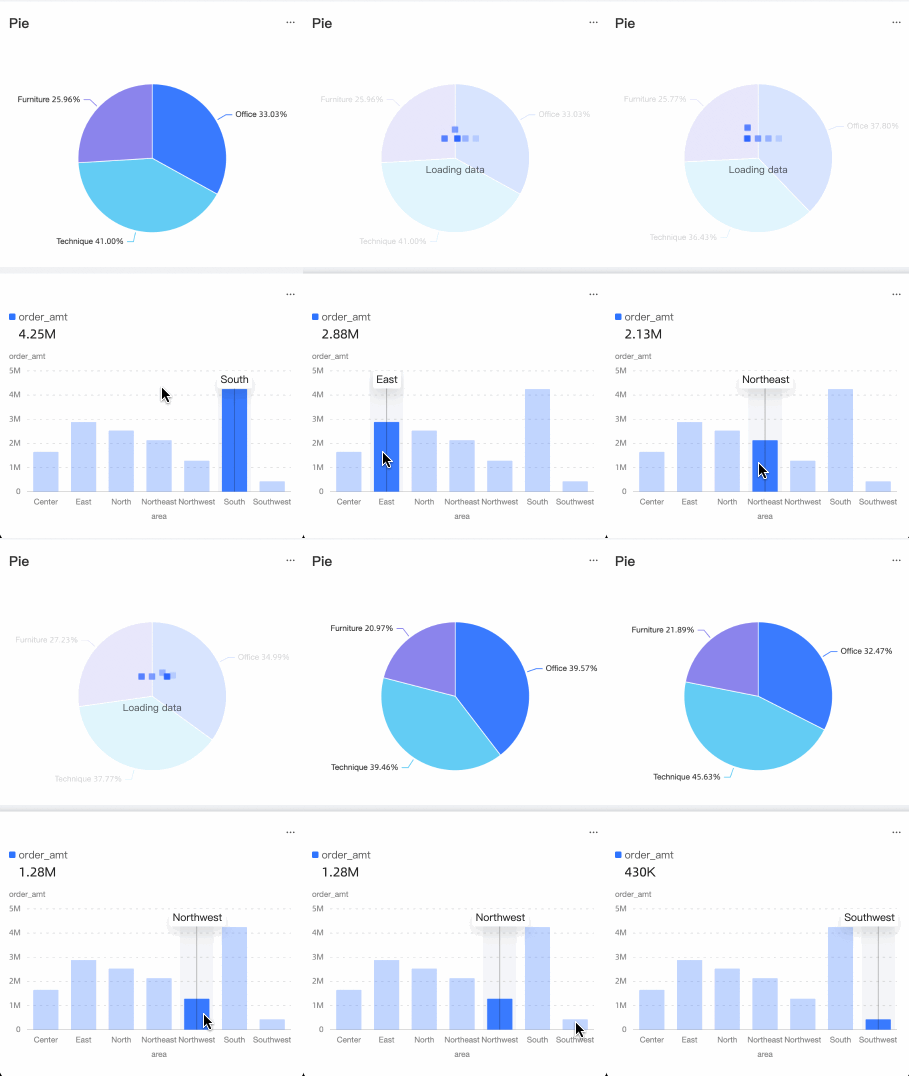
When direct linkage is selected, if only the linkage Interactive Analytics capability is configured, then the viewing data and linkage operation will occur simultaneously, and the linkage will be clicked. The following figure:
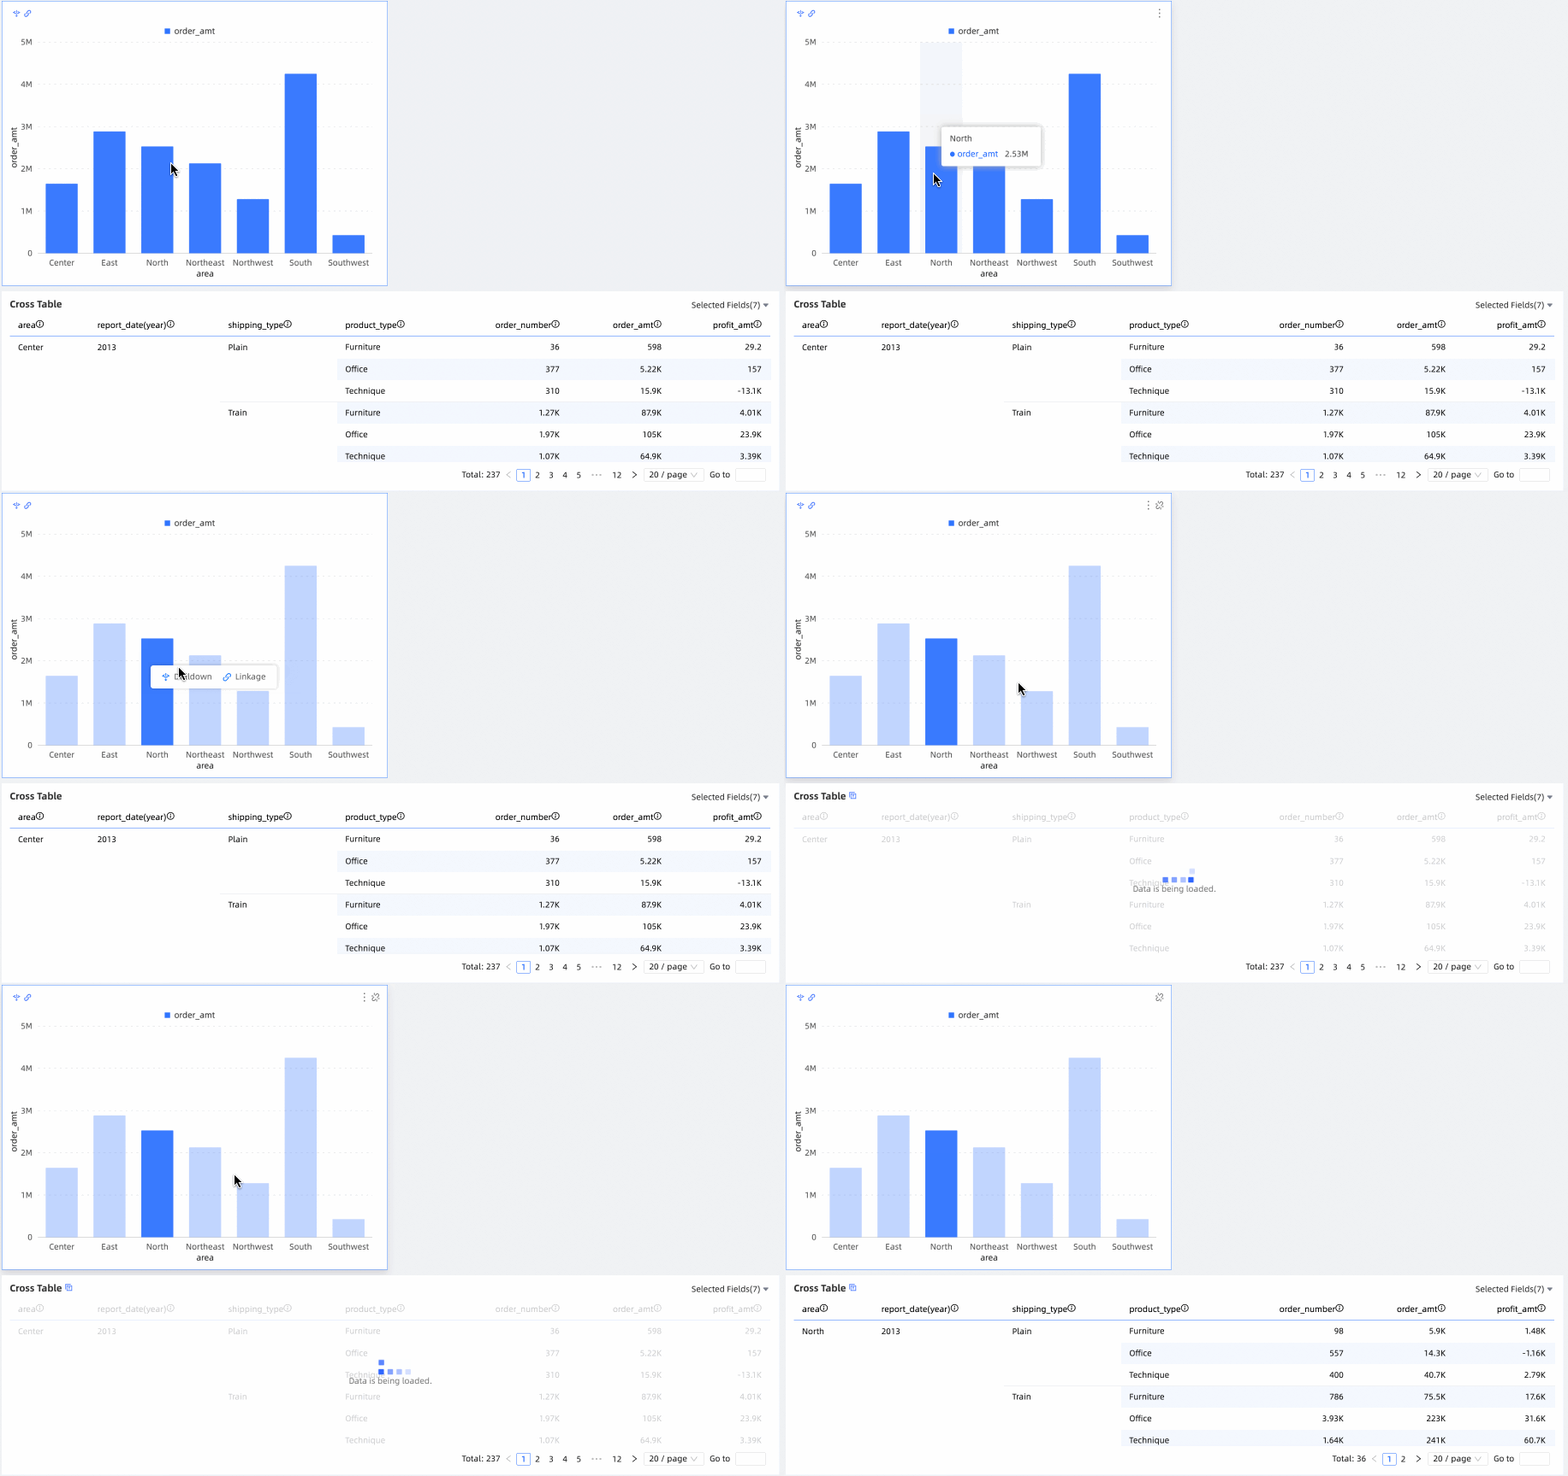
In the column chart Regional Sales Amount section, click East. In the dialog box that appears, select Linkage.
In the cross table, Orders by Region displays the orders in the East region.
Method 2: configure the filter interaction feature first
This example takes the sales data report of each region of the company as an example, sets the drilling and linkage functions of the column chart and displays the effect.
On the column chart Analysis tab, click the Pen icon next to Interaction.
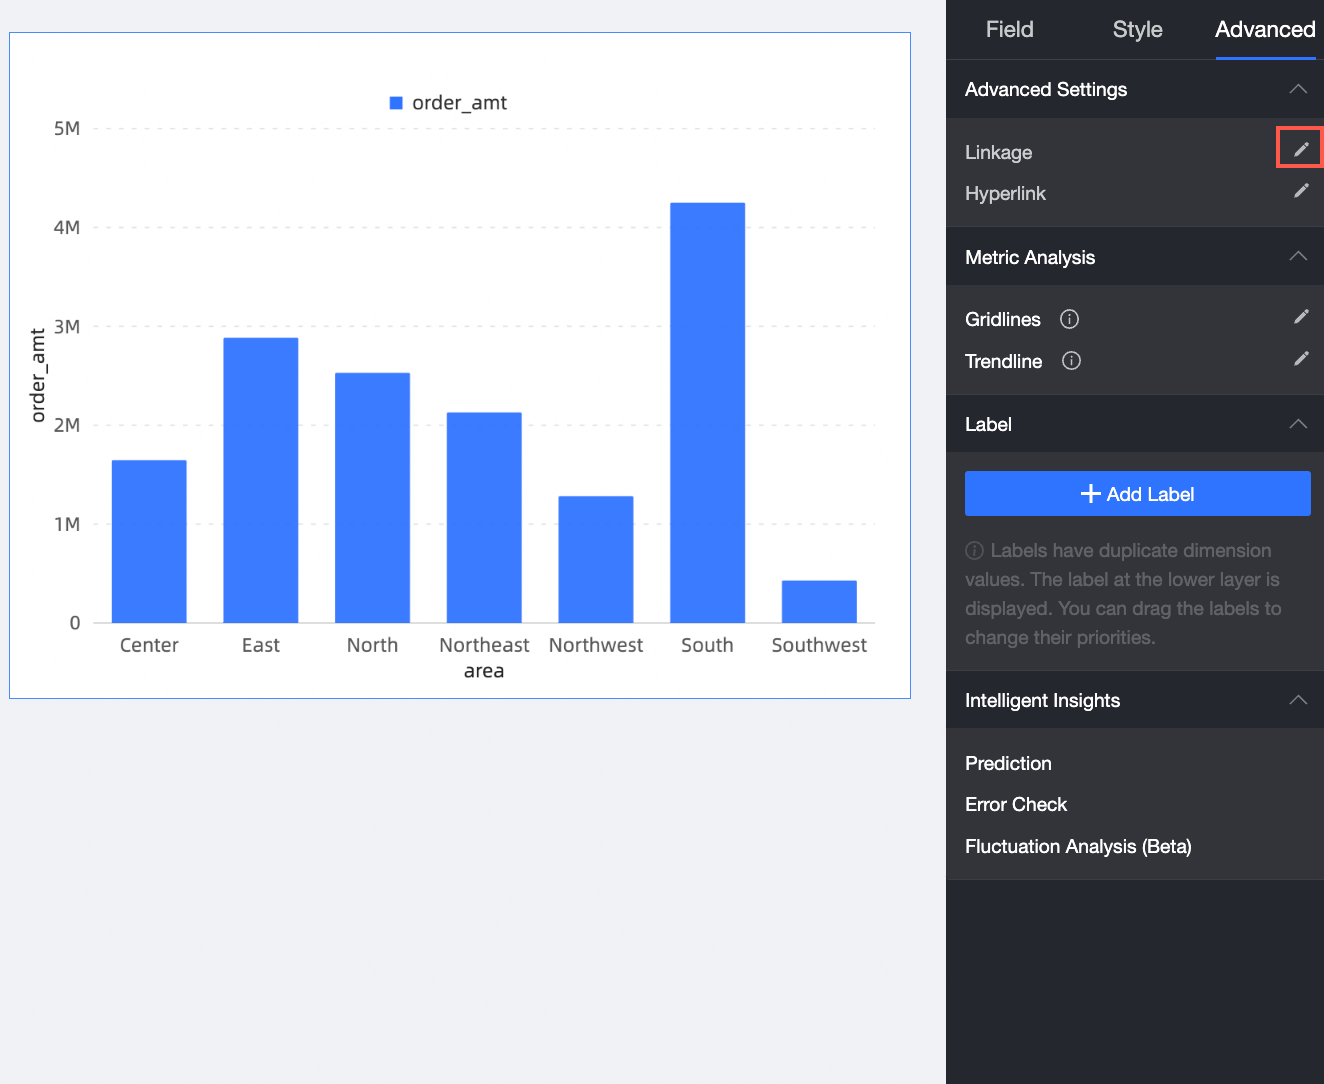
In the Chart Interaction Settings step, select a dimension field from the Region section, associate the dimension field with the chart, and then click OK.
The current chart can be associated with charts in the same dataset and charts in different datasets.
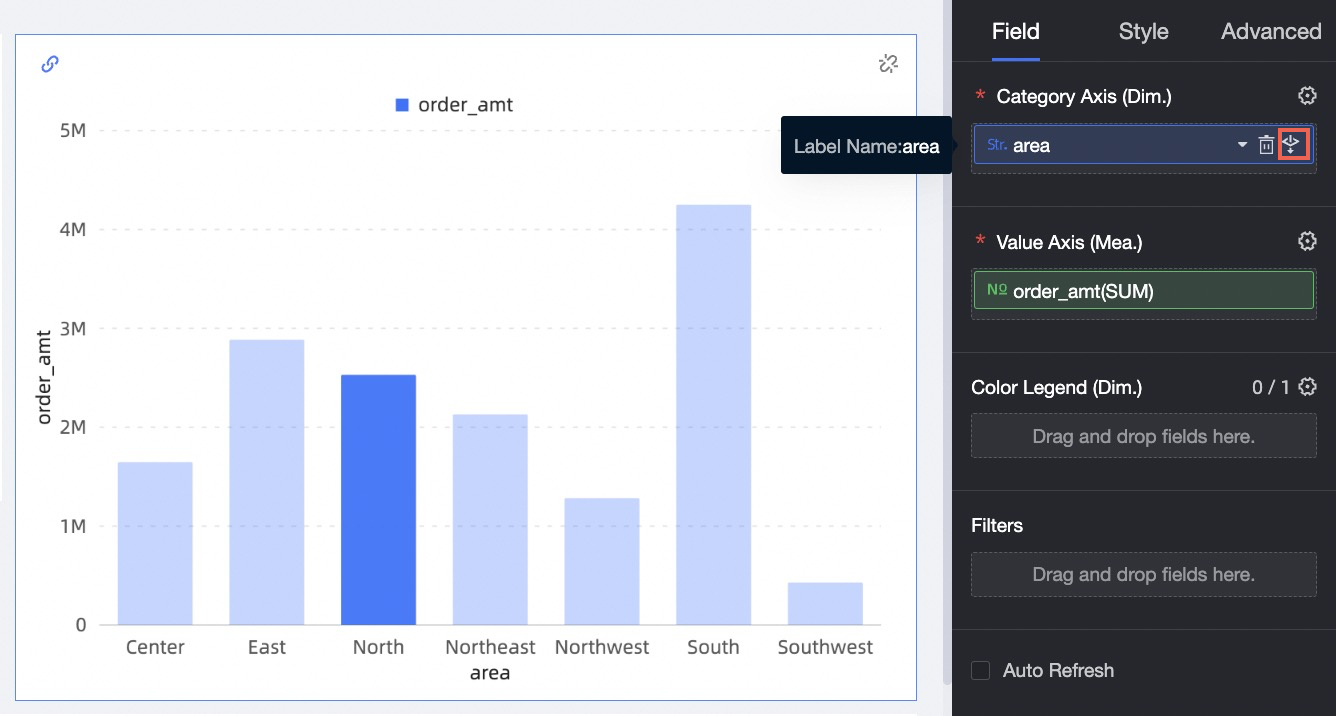
On the column chart Regional Sales Amount Fields tab, click the
 icon on the right side of the Dimensions section.
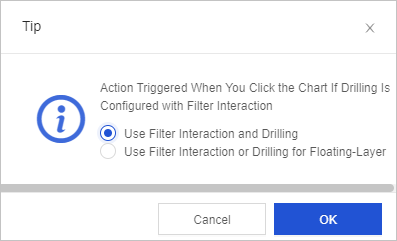
In the dialog box that appears, select a chart presentation mode and click OK.
When you click the associated chart, the linkage and drillthrough feature is set to Simultaneous or Floating Layer Selection Linkage or Drillthrough.
In the Sales Amount by Region section of the column chart, click East. In the dialog box that appears, select Drill Down.
The sales of each province in the East China region are displayed in the column chart area.
