Performance Testing (PTS) runs Apache JMeter scripts to execute load tests. This guide walks you through building a JMeter script that tests WebSocket connections and running that script in PTS. The JMeter WebSocket Samplers plug-in is used throughout.
How WebSocket testing differs from HTTP: Unlike HTTP request-response cycles, a WebSocket connection is persistent and full-duplex. A single request can produce multiple responses, which JMeter queues in arrival order. Each read sampler pulls the next response from the front of this queue, and each newly received response is placed at the end of the queue. If the number of read and write samplers does not match, responses may become misaligned. Keep this behavior in mind when designing test scripts.
Prerequisites
Apache JMeter installed on a local machine
A WebSocket service endpoint to test
Workflow overview
The end-to-end workflow has five steps:
Install the JMeter WebSocket Samplers plug-in.
Create a test script with WebSocket samplers.
Debug the script locally.
Export the script as a
.jmxfile.Upload the script to PTS and run the load test.
Step 1: Install the JMeter WebSocket Samplers plug-in
Step 2: Create a test script
The following example demonstrates a basic WebSocket test script. Adjust the samplers to match your use case.
Sampler reference
| Sampler | Purpose | Blocking behavior |
|---|---|---|
| WebSocket Open Connection | Opens a WebSocket connection to the server | Blocks until connection is established or times out |
| WebSocket Ping/Pong | Sends a ping frame and waits for a pong frame | Blocks until pong is received or times out |
| WebSocket request-response Sampler | Sends a frame and reads one response | Blocks until a response is read or times out |
| WebSocket Single Write Sampler | Sends a frame without waiting for a response | Non-blocking |
| WebSocket Single Read Sampler | Reads one response from the queue | Blocks until a response is read or times out |
| WebSocket Close | Closes the connection through negotiation | Blocks until close handshake completes |
For proxy services, data filtering, and data sharding samplers, see the JMeter WebSocket Samplers documentation.
Build the script
Right-click Test Plan and choose Add > Threads (Users) > Thread Group.
Add the following samplers to the thread group in order. Right-click Thread Group and choose Add > Sampler > *sampler name* for each one.
a. WebSocket Open Connection
Configure the Server URL section to point to the service under test.
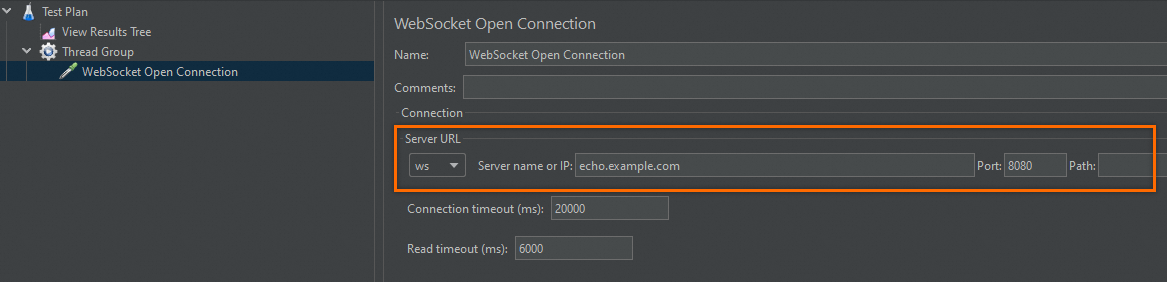
This example targets a Python Echo service that echoes every received message. The sample server code:
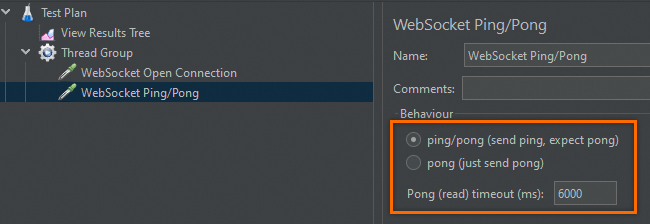
b. WebSocket Ping/Pong
Set Pong (read) timeout (ms) to 6000. If JMeter does not receive a pong frame within 6,000 ms, the sampler fails and reuses the existing connection.
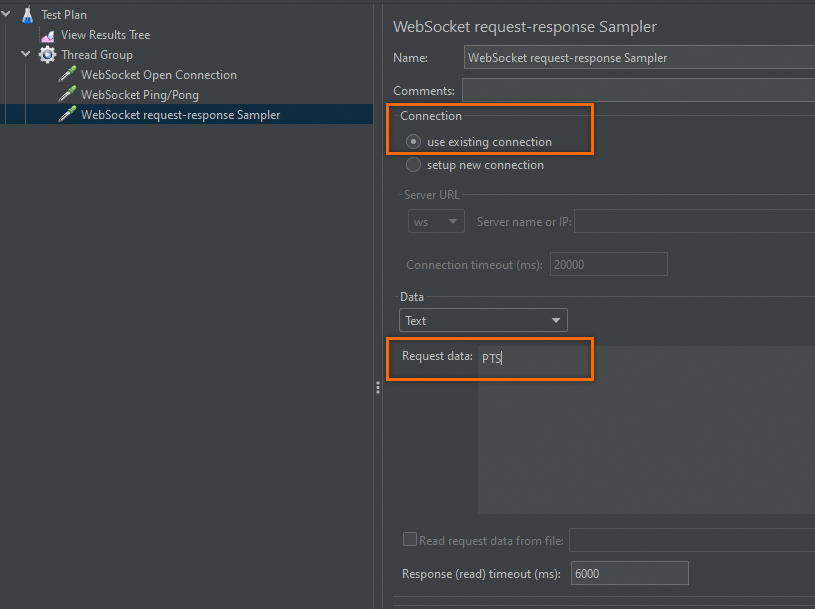
c. WebSocket request-response Sampler
This sampler sends a frame and reads the response in a single step.
| Parameter | Example value | Description |
|---|---|---|
| Connection | use existing connection | Reuses the connection opened earlier. |
| Data type | Text | Frame data type. |
| Request data | PTS | The payload to send. |
| Response (read) timeout (ms) | 6000 | Maximum wait time for a response. |
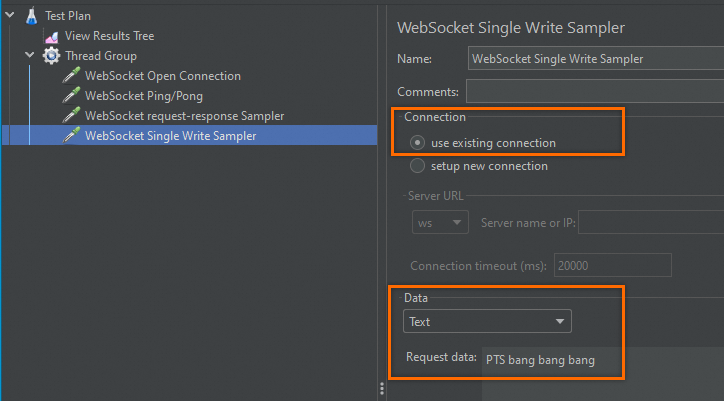
d. WebSocket Single Write Sampler
This sampler sends a frame and returns immediately without waiting for a response.
| Parameter | Example value | Description |
|---|---|---|
| Connection | use existing connection | Reuses the connection opened earlier. |
| Data type | Text | Frame data type. |
| Request data | PTS bang bang bang | The payload to send. |
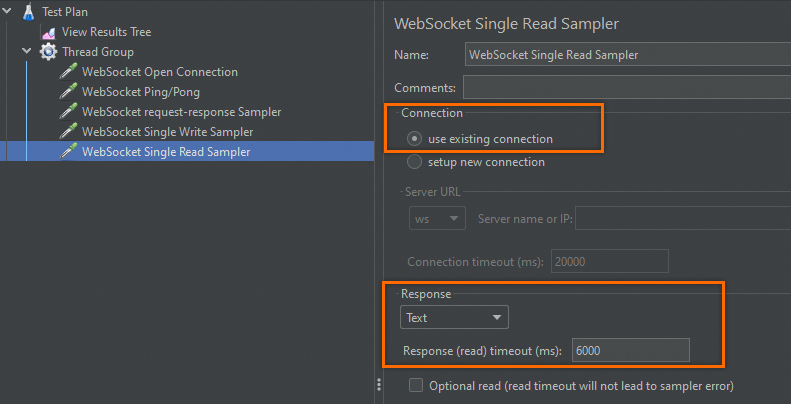
e. WebSocket Single Read Sampler
This sampler reads the next response from the queue without sending anything.
| Parameter | Example value | Description |
|---|---|---|
| Connection | use existing connection | Reuses the connection opened earlier. |
| Data type | Text | Frame data type. |
| Response (read) timeout (ms) | 6000 | Maximum wait time for a response. |
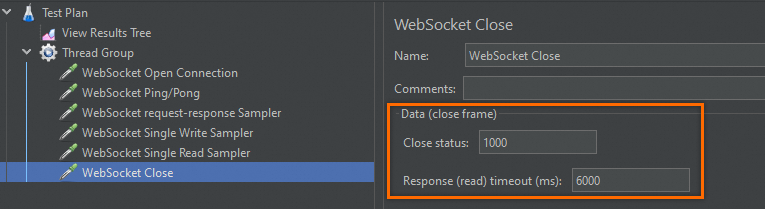
f. WebSocket Close
Closes the WebSocket connection through the standard close handshake. A successful close returns 1000:sampler requested close.
| Parameter | Example value | Description |
|---|---|---|
| Close status | 1000 | Status code sent in the close frame (first two bytes of the data frame). |
| Response (read) timeout (ms) | 6000 | Maximum wait time for the close acknowledgment. |
(Optional) Add HTTP headers
To include headers such as authentication tokens, right-click Thread Group and choose Add > Config Element > HTTP Header Manager. For details, see the Apache JMeter Header Manager documentation.
Add a listener
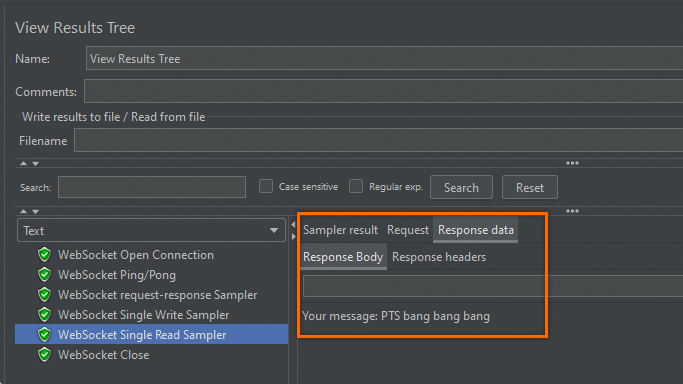
Right-click Thread Group and choose Add > Listener > View Results Tree to inspect request and response data during debugging.
Step 3: Debug the script
Click the Start button in the JMeter toolbar to run the script.
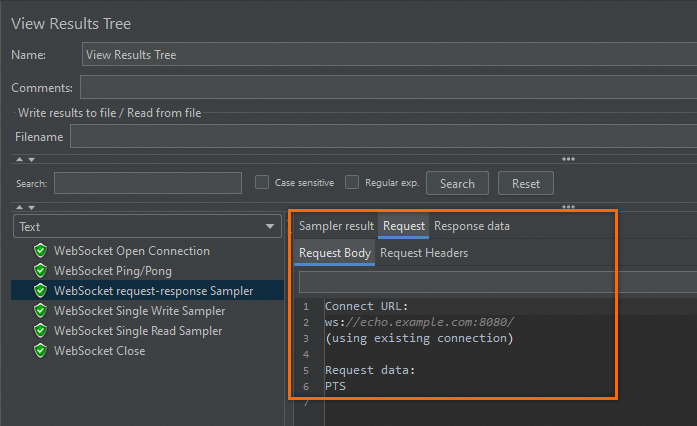
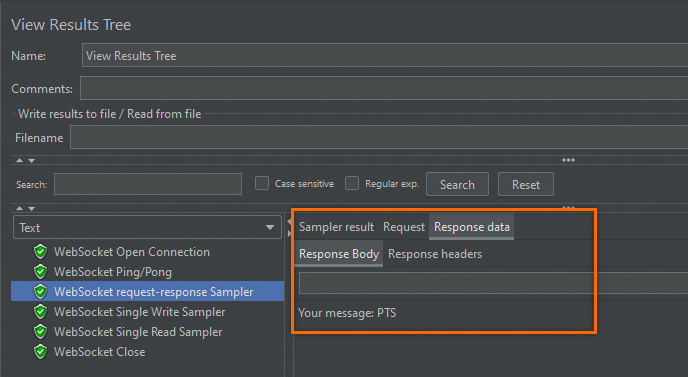
Open the View Results Tree listener. A green check mark next to a sampler indicates success. A red icon indicates failure.
For any failed sampler, review the request and response data to identify the issue. The following screenshots show successful results: WebSocket request-response Sampler -- Request data: WebSocket request-response Sampler -- Response data (Text): WebSocket Single Read Sampler -- Response data (Text):
Step 5: Run the load test in PTS
Upload the script
Log on to the PTS console. Choose Performance Test > Create Scenario, then click JMeter.
Enter a scenario name and upload the
wsTest.jmxfile.PTS automatically resolves plug-in dependencies. If automatic resolution fails, click Upload File to manually upload the
JMeterWebSocketSamplers-1.2.10.jarfile and any data files such as CSV parameter files.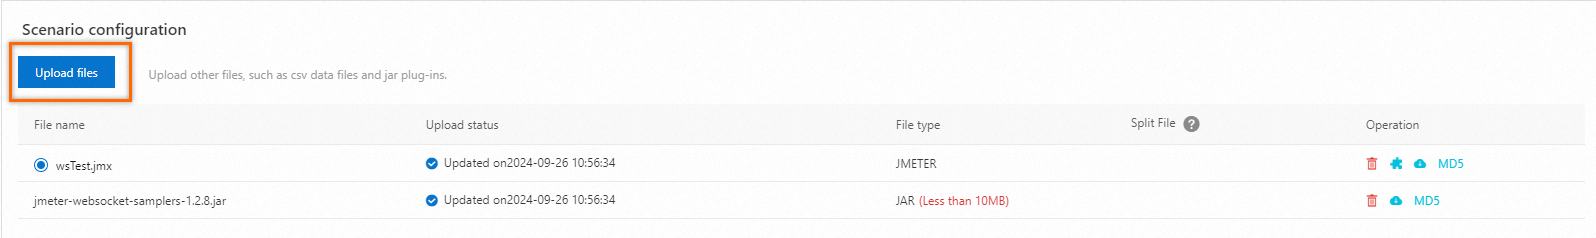
Configure load settings
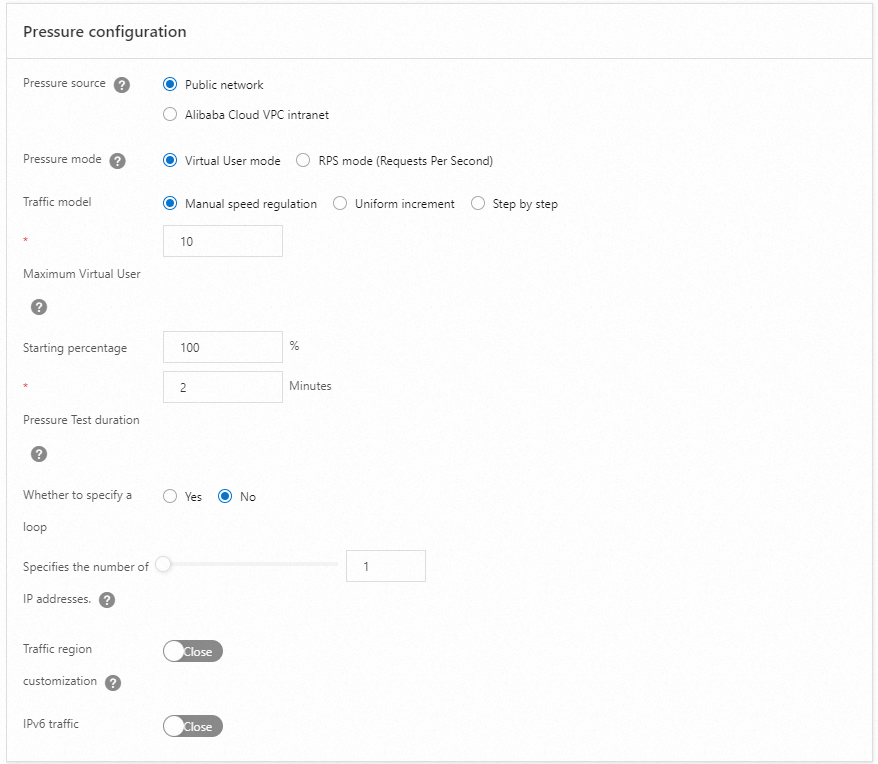
Set the following parameters for an initial test run. Adjust values based on your testing requirements.
| Parameter | Example value | Description |
|---|---|---|
| Max VUs | 10 | Maximum number of concurrent virtual users. |
| Test Duration | 2 minutes | Total duration of the load test. |
| Increment Duration | 2 minutes | Time to ramp up to the maximum VU count. |
Keep the default values for other parameters.
Load testing incurs charges. Set the load level based on your actual requirements. For pricing, see Billing overview. For load model details, see Configure the stress testing model and level.
Start the load test
(Recommended) Debug the scenario to verify the configuration before running the full test. For details, see Debug a stress testing scenario.
Click Save and Test. On the Tips page, select Trigger Now and Make sure that the test is approved and complies with local laws, then click Start Stress Testing.
Analyze the test results
After the load test finishes, PTS automatically generates a performance report that includes:
Scenario-level metrics
Per-API business details
Monitoring details
API sampling logs
For details, see View a JMeter performance testing report.
What's next
Create a JMeter scenario -- Explore additional JMeter scenario options in PTS.
View a JMeter performance testing report -- Understand the metrics and data in your test report.