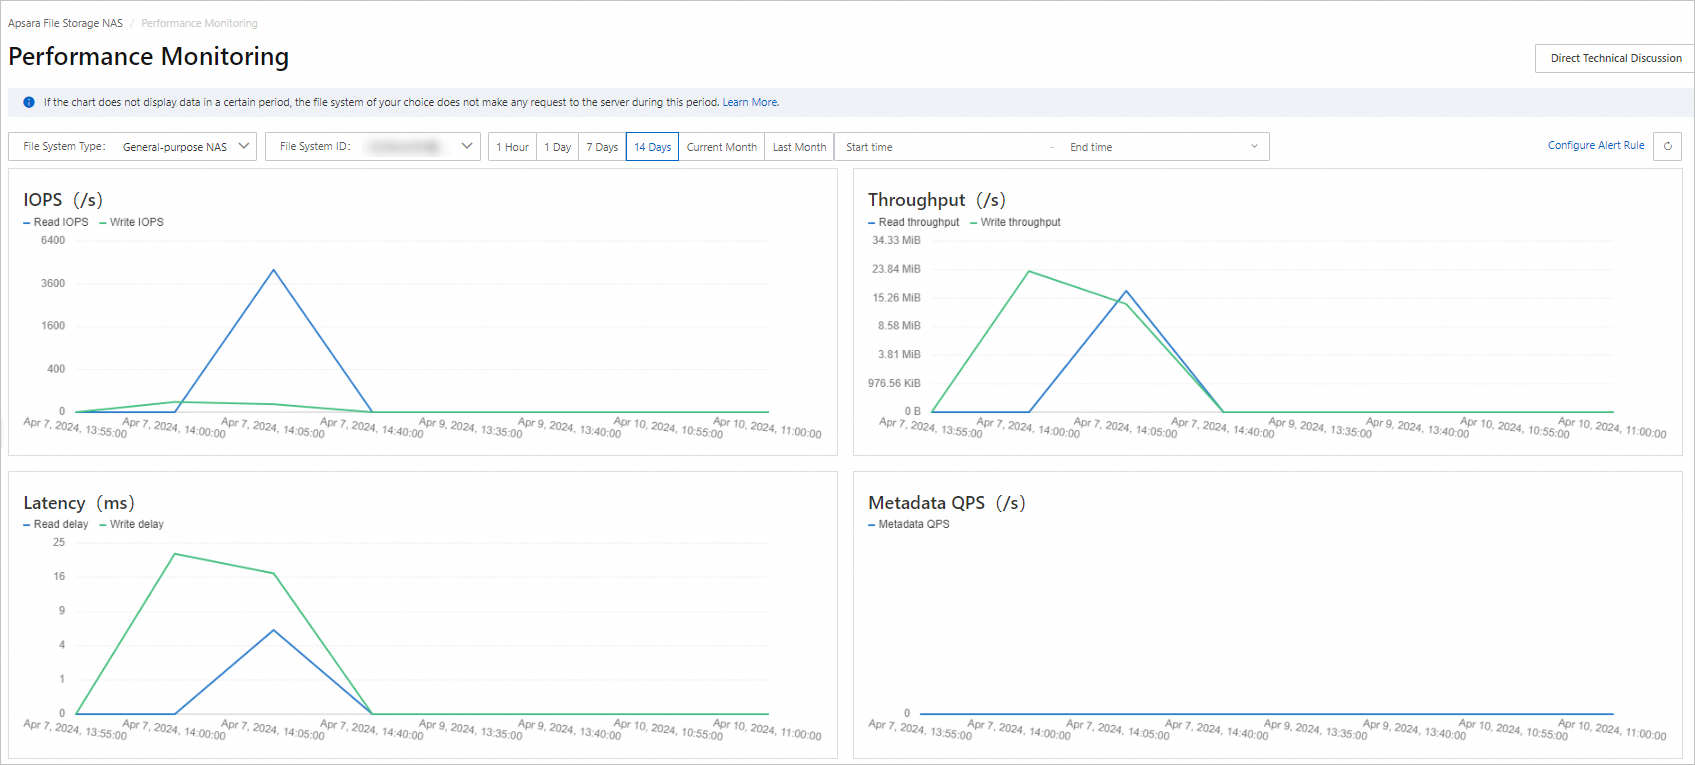
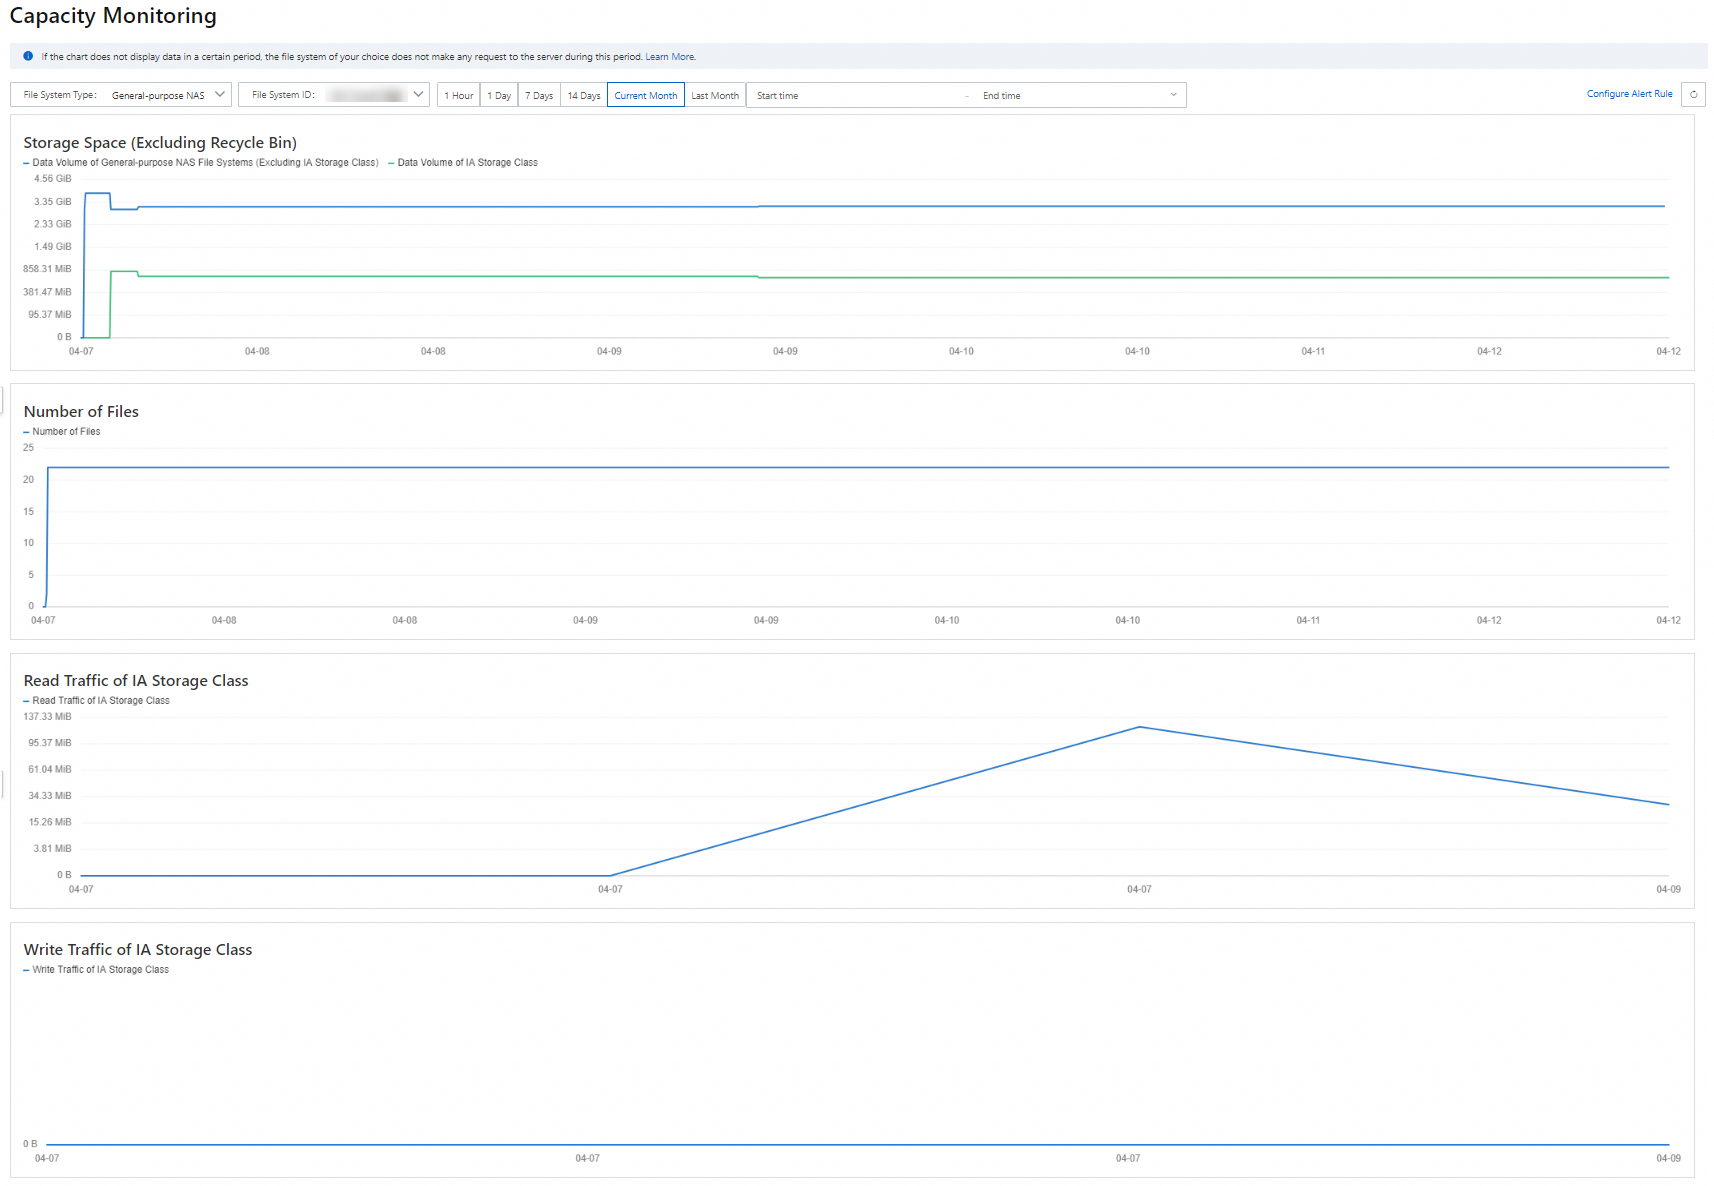
Monitoring and logging are essential for ensuring the availability of your File Storage NAS (NAS) resources and maintaining the health and normal operation of your services. You can use monitoring services to continuously collect metric data. Alibaba Cloud provides a variety of monitoring and log auditing services, such as CloudMonitor and ActionTrail. These services help you monitor resource usage and service performance in real time and respond to alerts promptly.
Resource data monitoring for file systems
You can monitor the performance and capacity metrics of file systems in the NAS console. For more information about monitoring, see Metrics.
Performance metrics
On the Performance Monitoring page, select a file system type and the ID of the file system to view its metric data, including the read and write input/output operations per second (IOPS), throughput, latency, and metadata QPS.

Capacity metrics
On the Capacity Monitoring page, select a file system type and the ID of the file system to view its metric data, including the storage usage, the number of files, and the read and write traffic of the Infrequent Access (IA) storage class.

Health status monitoring
We recommend that you keep track of the health status of your Alibaba Cloud resources. This allows you to identify and handle exceptions promptly. For more information, visit Alibaba Cloud Health Status.
On the Alibaba Cloud Health Status page, you can check the health status of each service in different regions and subscribe to Really Simple Syndication (RSS) feeds about service exceptions.

CloudMonitor Basic
NAS is integrated with CloudMonitor Basic. You can use CloudMonitor Basic free of charge to monitor the metrics of cloud resources and Internet applications in real time. You can use CloudMonitor Basic to monitor the status, usage, and exceptions of cloud service resources in real time.
You can use the NAS console, CloudMonitor console, or CloudMonitor API to view the metric data of file storage resources. For more information, see Data monitoring.
View the metric data in the CloudMonitor console
You can monitor metrics of NAS file systems in the CloudMonitor console. On the Cloud Service Monitoring page of the CloudMonitor console, choose . View the performance and capacity metric data of file systems.
View the metric data by using CloudMonitor SDKs
You can use a CloudMonitor API to view metric data of NAS file systems. You can call the DescribeMetricList operation of CloudMonitor to view the capacity metrics of a file system, such as AlignedSize, SecondaryAlignedSize, and FileCount, and the performance metrics of the file system, such as IopsRead, IopsWrite, LatencyRead, and LatencyWrite.
You can configure alert rules for metrics in the CloudMonitor console. If the conditions specified in an alert rule are met, CloudMonitor automatically sends you an alert notification. This allows you to learn about metric anomalies and troubleshoot issues promptly. For more information, see Configure a basic alert rule or Configure an advanced alert rule.
ActionTrail
NAS is integrated with ActionTrail, which can monitor and record operations performed by Alibaba Cloud accounts. In addition, ActionTrail can analyze security risks, detect intrusions, track resource changes, and perform compliance auditing.
ActionTrail can generate logs for cloud service access and usage by using the Alibaba Cloud Management Console, API operations, and developer tools. For more information about the audit events, see Audit events of NAS.
By default, ActionTrail tracks and retains events for the last 90 days. To retain events for a longer period, create a trail that delivers events to a Simple Log Service Logstore or an Object Storage Service (OSS) bucket. For more information, see Step 1: Create a trail.
After you create a trail to deliver events to a Simple Log Service Logstore or an OSS bucket, you can query or analyze the events in the Simple Log Service or OSS console. For more information, see Query events in the Simple Log Service or OSS console.
To access historical events beyond the default 90-day retention period, submit a ticket to request the necessary permissions.
Simple Log Service
NAS is integrated with Simple Log Service. You can enable the log auditing feature on the Audit Logs page. Simple Log Service collects and processes log data of cloud services, such as operation information, status, and business dynamics, and analyzes and ships log data in real time. This way, you can monitor and audit logs in real time. For more information about how to enable Simple Log Service in the NAS console, see Enable the log analysis feature. Log data is retained for 30 days by default. You can change the retention period based on your business requirements. For more information, see Modify the configurations of a logstore.
Query and analyze logs
When you perform operations on resources of a NAS file system, the system automatically collects audit logs and creates indexes. You can query and analyze the collected logs in real time on the query and analysis page of Simple Log Service. For more information, see Guide to log query and analysis.