The Account Overview page lets you view basic information about all your sites, including Traffic Statistics, ESA service security and performance monitoring, Recently Used Websites, Expiring Plans, and a portal to the official ESA documentation. On this page, you can use this information to quickly modify the basic information of your sites based on your business needs.
ESA access data
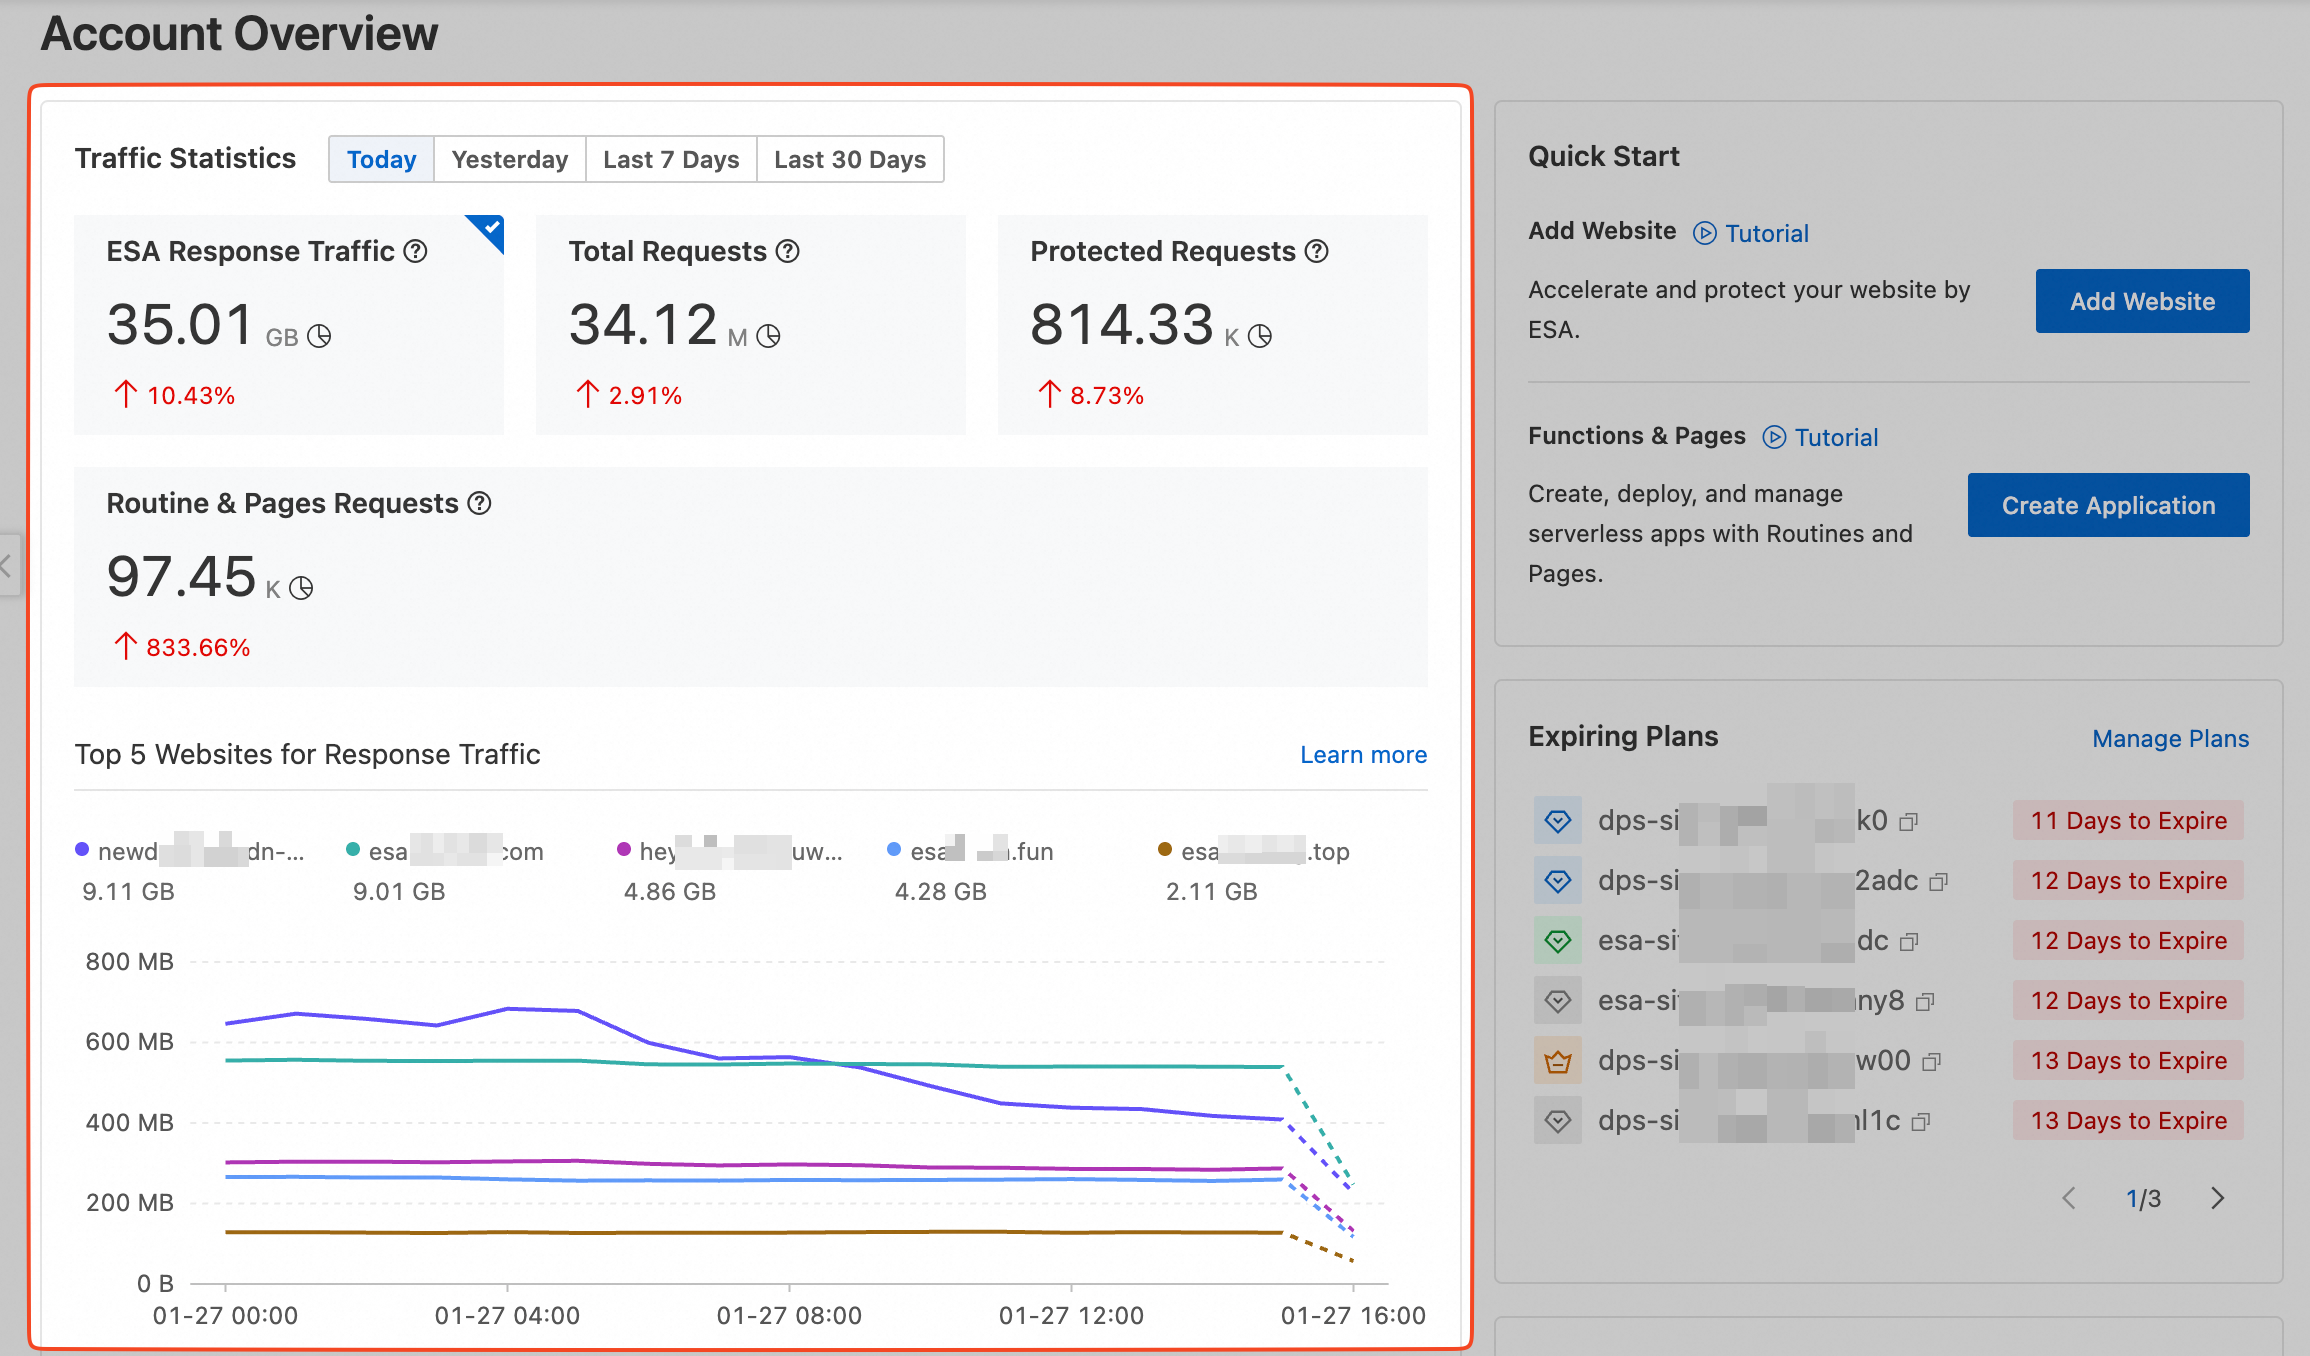
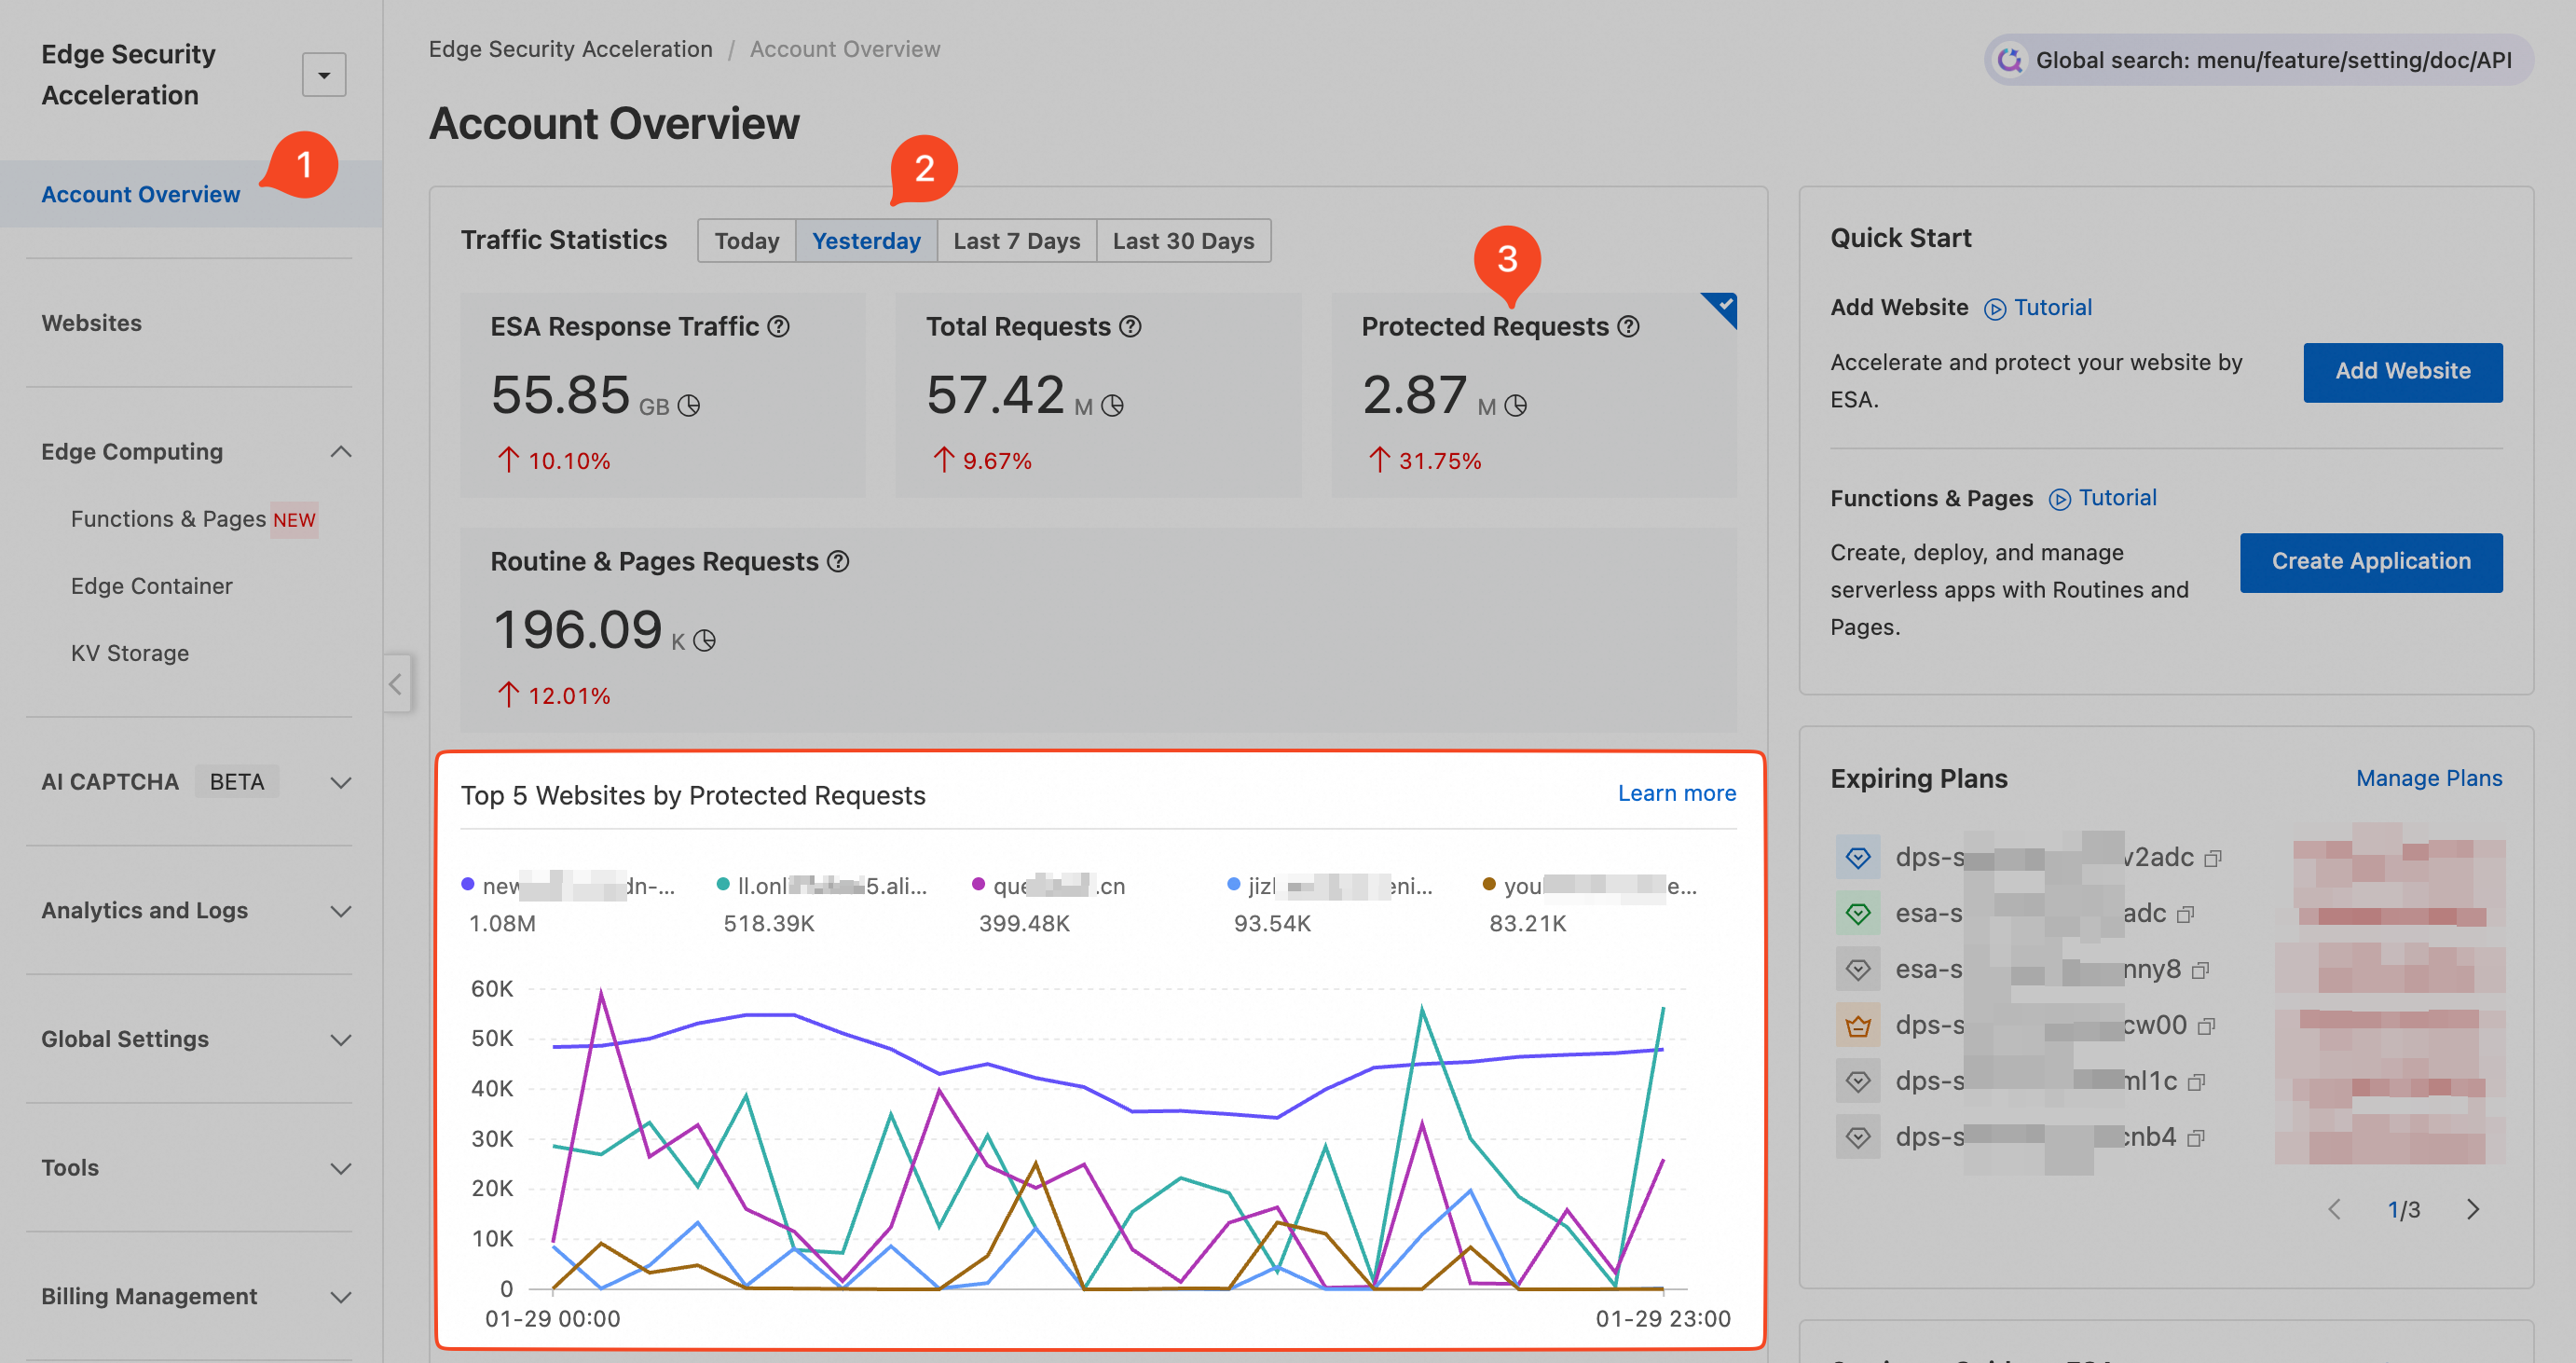
You can view statistics for all sites under your account for four time periods: Today, Yesterday, Last 7 Days, and Last 30 Days. These statistics include ESA Response Traffic, Total Requests, Protected Requests, and Functions & Pages Requests. You can use this data to manage your sites effectively.
Dimension | Description |
ESA Response Traffic | ESA Response Traffic shows traffic consumption for all sites under your account during the selected period. By default, it displays data for the current day, helping you track day-over-day traffic changes. |
Total Requests | Total Requests is the number of requests that ESA receives from clients within the selected statistical period. By default, the statistical period is the current day. You can check for abnormalities in the period-over-period growth rate and take corresponding actions, such as request throttling. |
Protected Requests | The number of requests on which ESA performed the following operations: Intercept, Slider Challenge, JS Challenge, or Dynamic Token Challenge. |
Functions & Pages Requests | This metric counts requests processed by Functions and Pages. |
Service security and performance checks
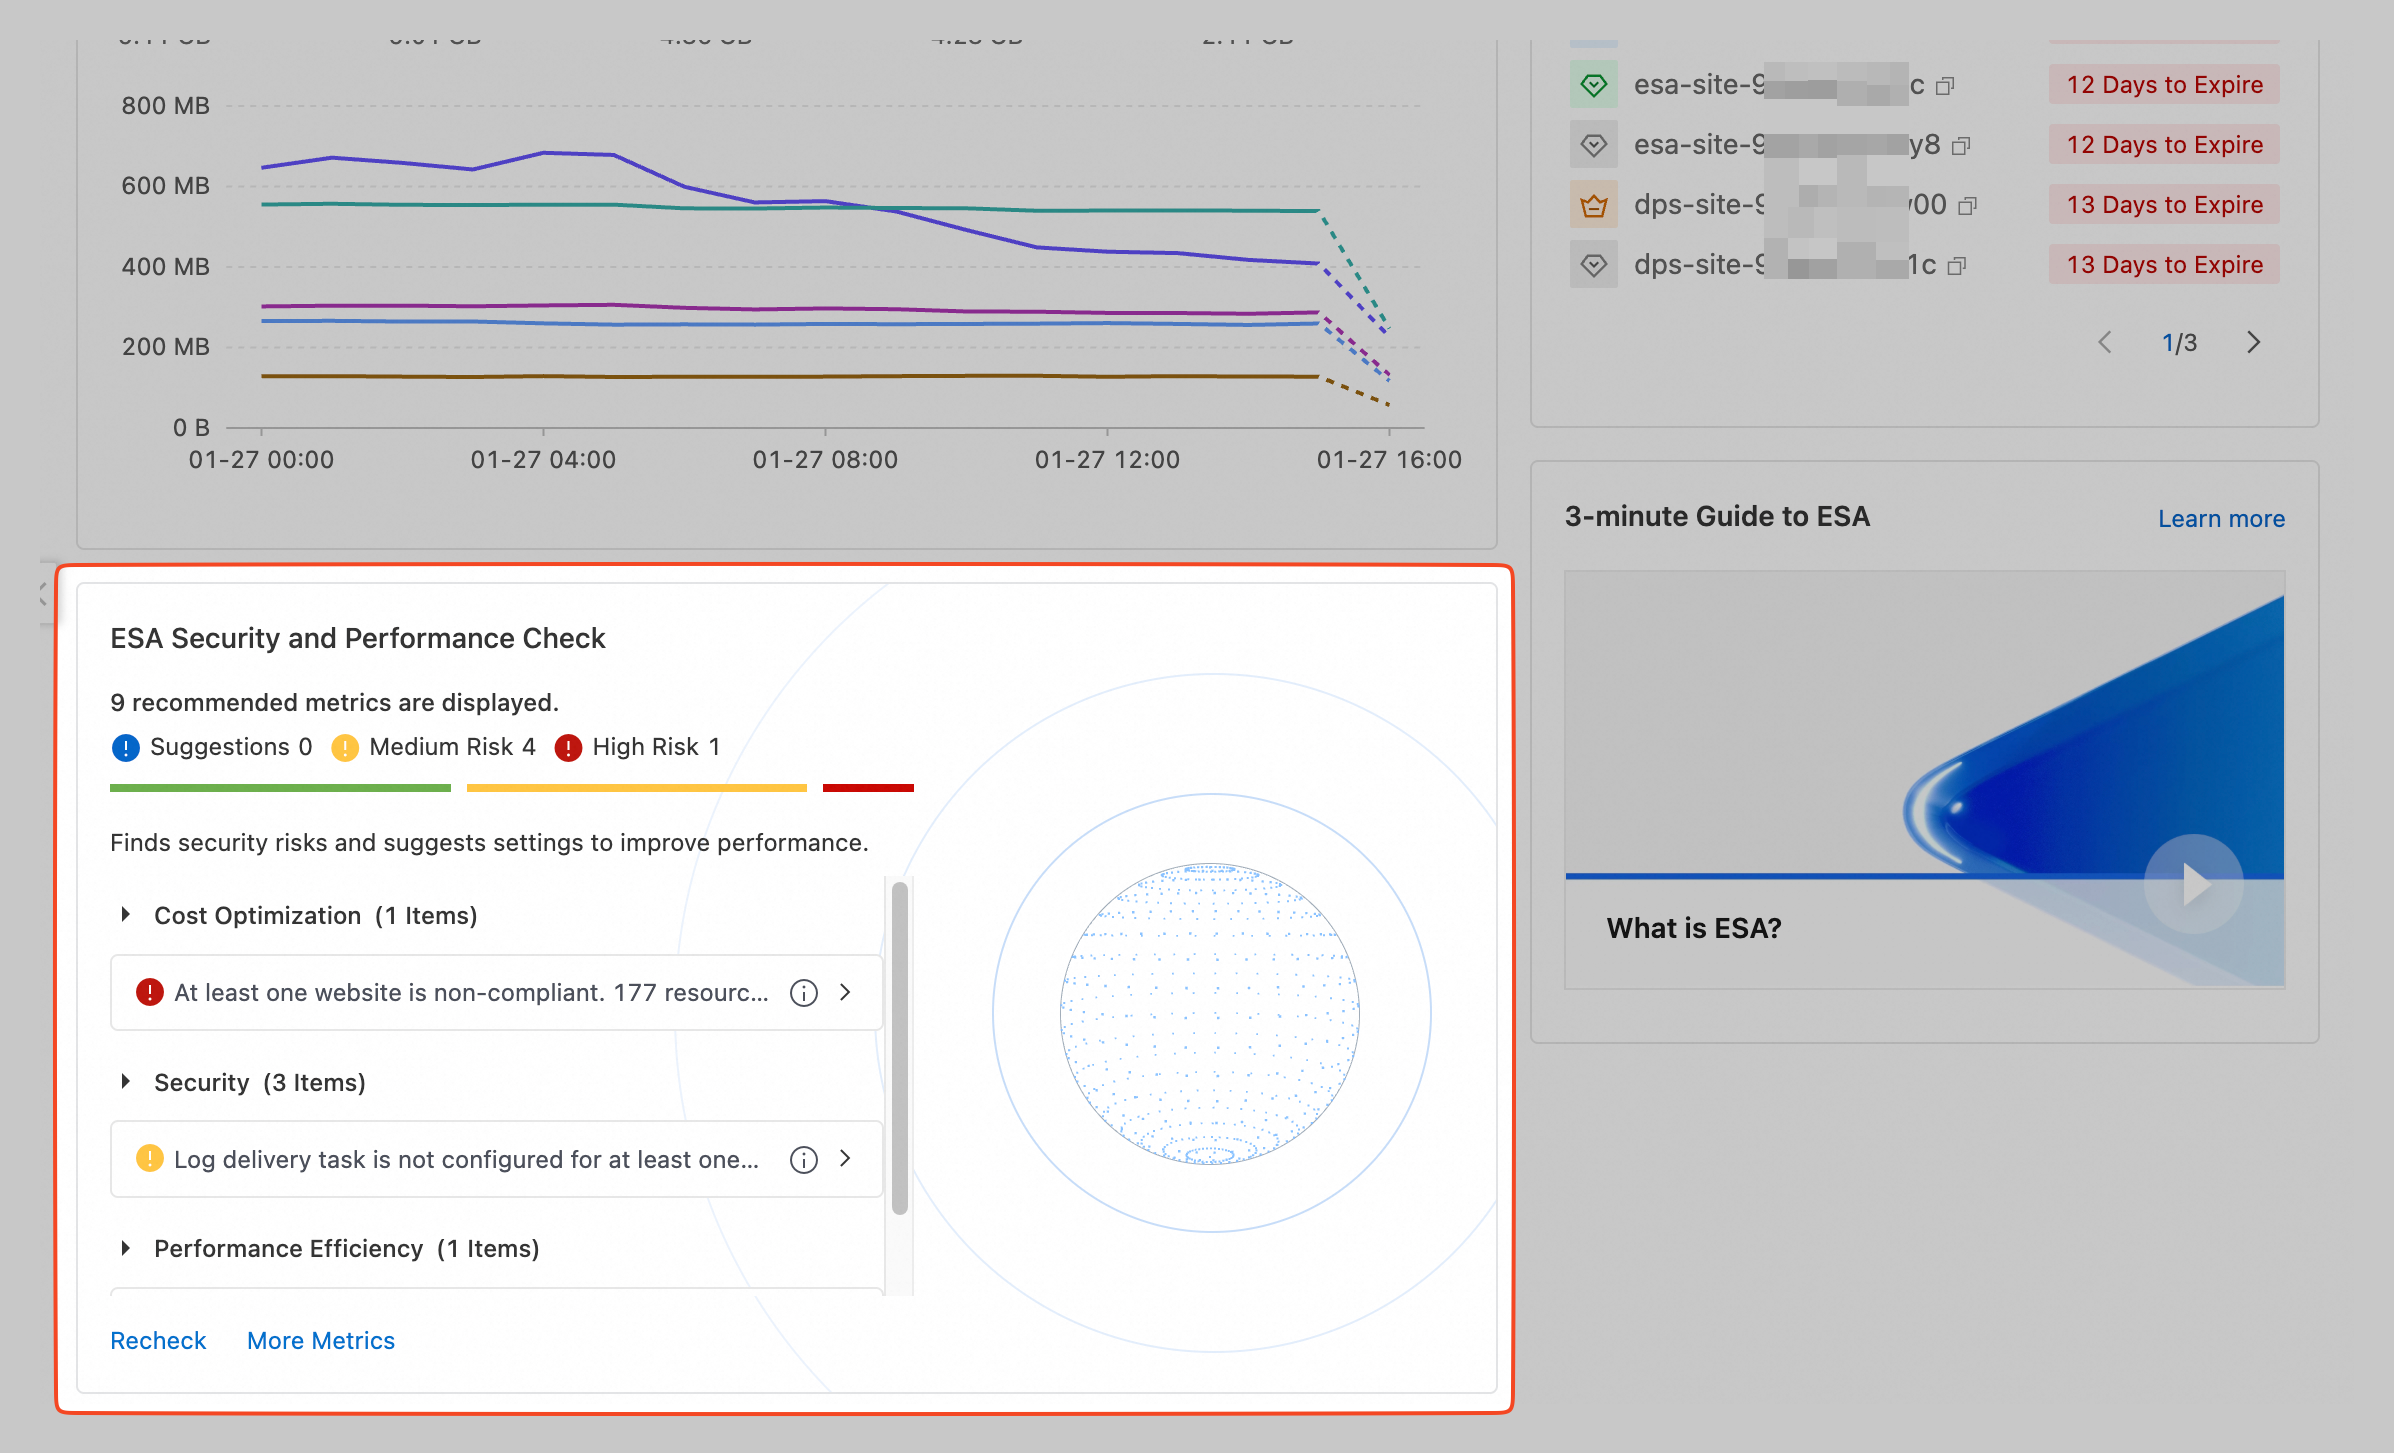
The ESA security and performance check detects security risks and identifies configuration items that you can optimize for performance. If a relevant feature is not enabled or configured, this is considered a deviation from best practices and a corresponding security risk is flagged. Risk Levels are divided into three categories: Suggestion, Medium Risk, and High Risk.
Features | Description |
TLS v1.2 | This check ensures your site has TLS v1.2 enabled. Using a newer protocol version improves your site’s security. For setup instructions, see TLS cipher suites and protocol version configuration. |
WAF managed rules | This check ensures your site has managed rules configured to better protect web and API applications against vulnerabilities. For setup instructions, see Managed rules. |
Abnormal ESA site | This check item ensures that the site is enabled so that ESA can provide acceleration and protection for the site. To enable the site, see Add a DNS record and enable the site. |
Log delivery tasks | This check item ensures that at least one type of log is configured for the site. This provides detailed, real-time log information about access to ESA resources, which helps you monitor, analyze, and optimize content delivery performance. For configuration instructions, see Create a real-time log delivery task. |
HSTS | This check ensures your site has HTTP Strict Transport Security (HSTS) enabled to reduce the risk of hijacking during the first visit. For setup instructions, see Configure HSTS. |
Force HTTPS | This check item ensures that Force HTTPS is enabled for your site to guarantee that HTTP requests from clients to the ESA point of presence (POP) are forcibly redirected to HTTPS. For configuration instructions, see Force HTTPS. |
WAF custom rules | This check ensures your site has WAF custom rules configured to detect and mitigate malicious requests. For setup instructions, see Custom rules. |
Cache rules | This check ensures your site has cache rules configured to reduce origin fetch traffic. For more information, see Caching. |
Smart routing | This check ensures your site has smart routing enabled to improve ESA’s global acceleration performance. For setup instructions, see Smart routing. |
Expiring plans dashboard
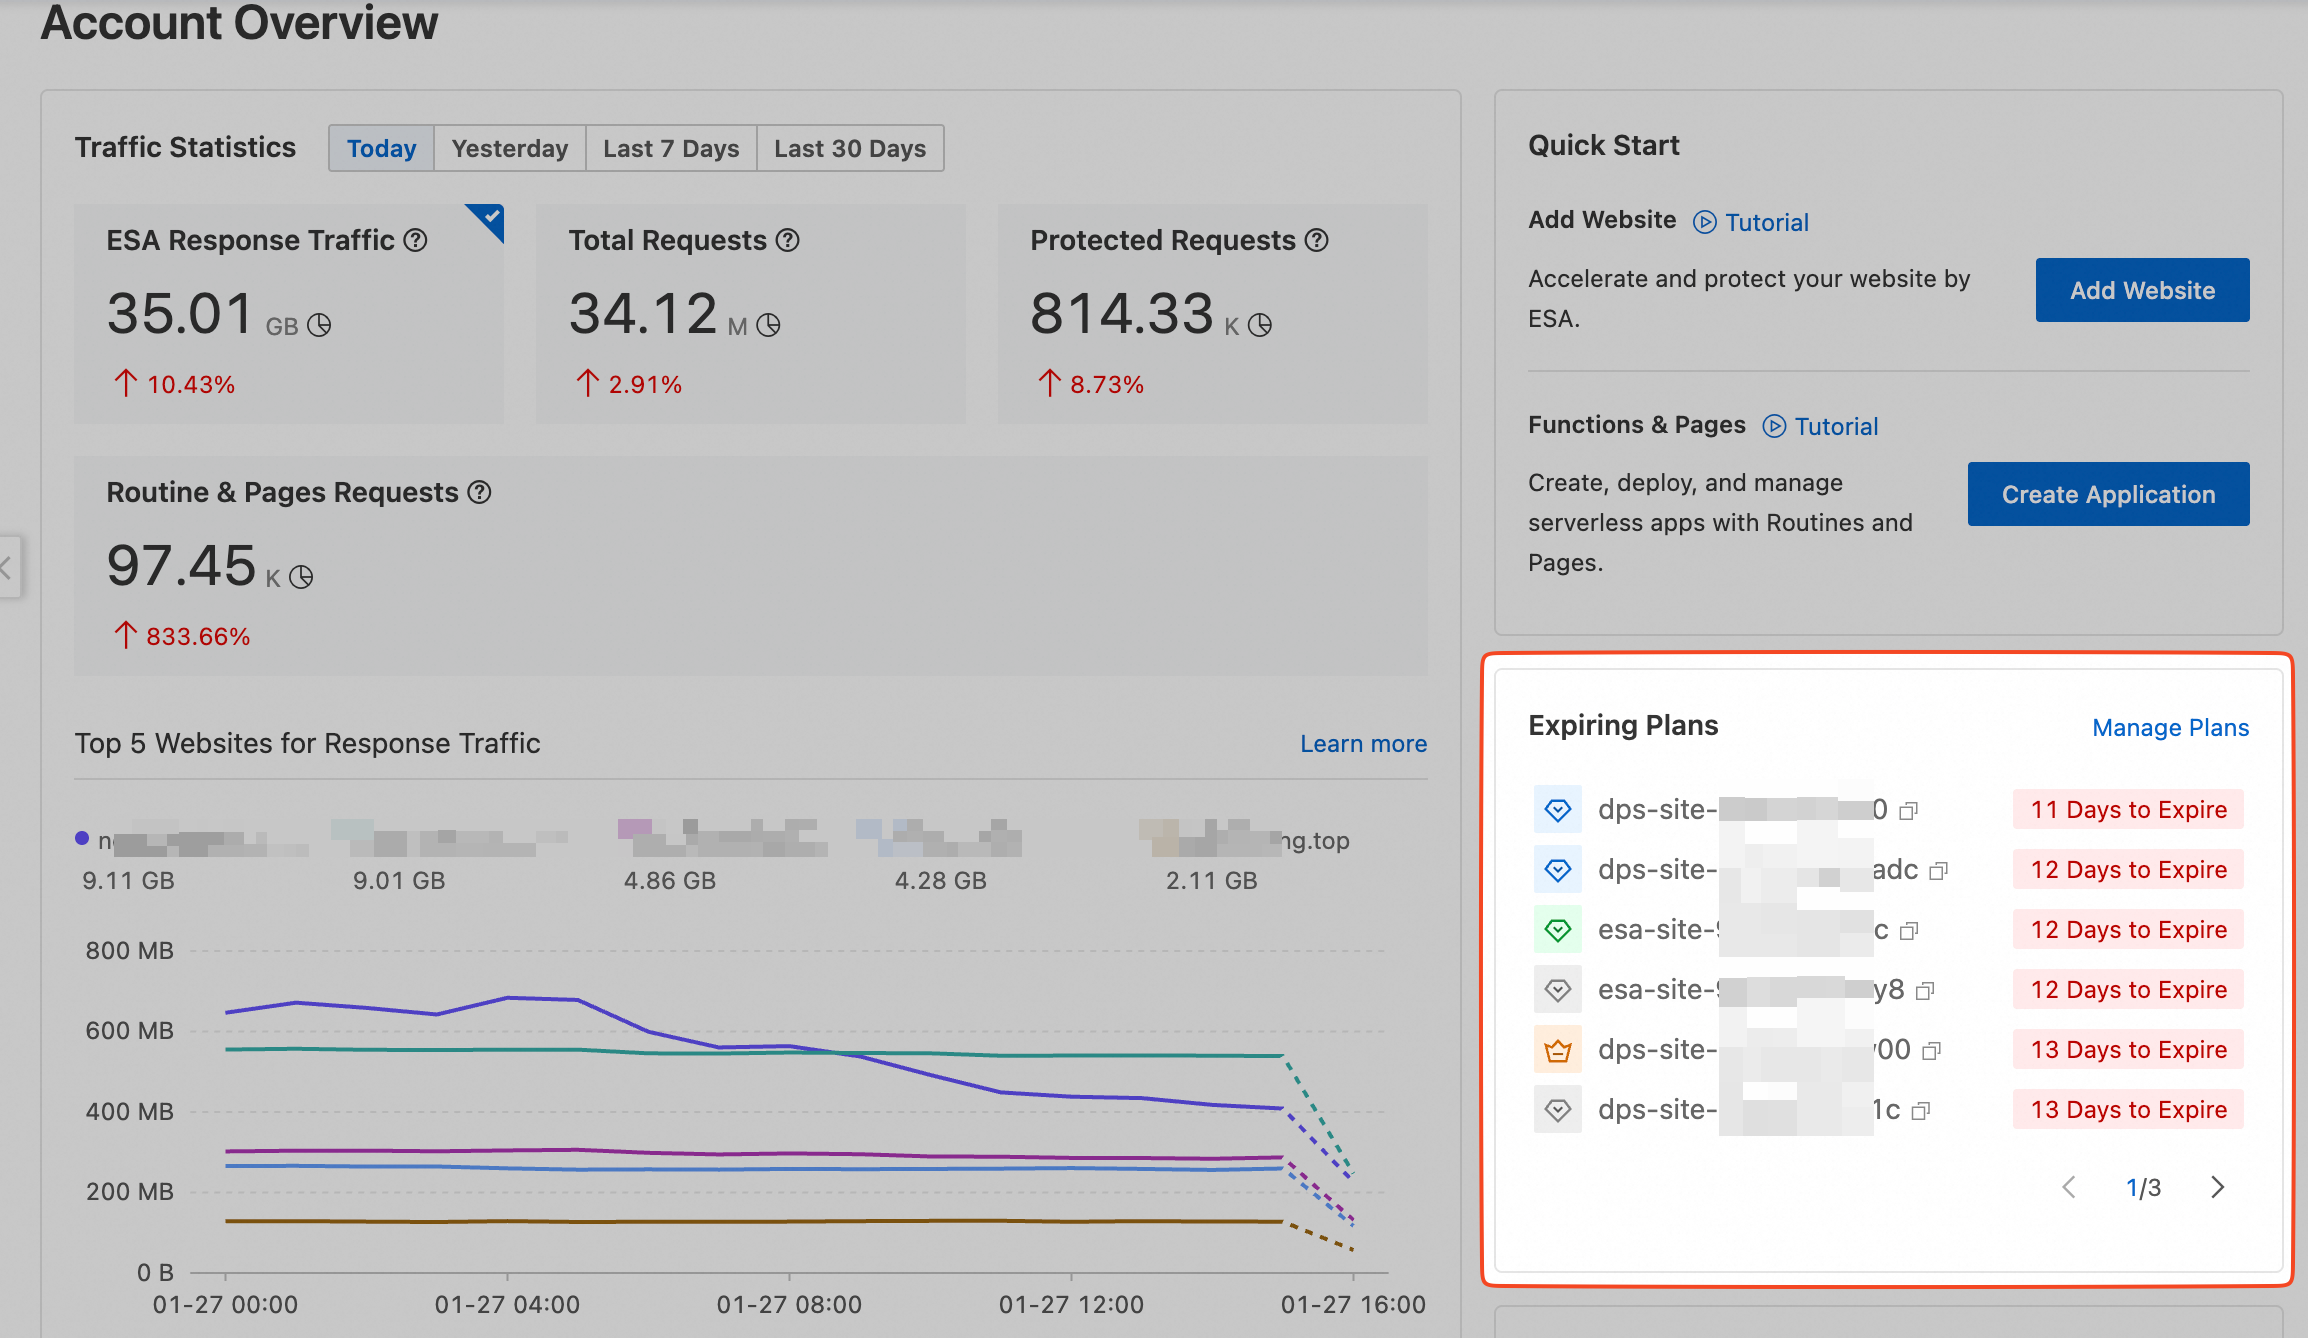
This section displays the names of sites with ESA plans that are expiring soon. By default, 6 sites are displayed per page. To view plan information for more sites, you can go to the page. The remaining duration of the plan, in days, is displayed next to the corresponding site.
You can hover over the site that you want to manage and click Renew or Upgrade based on your needs.
Video and documentation
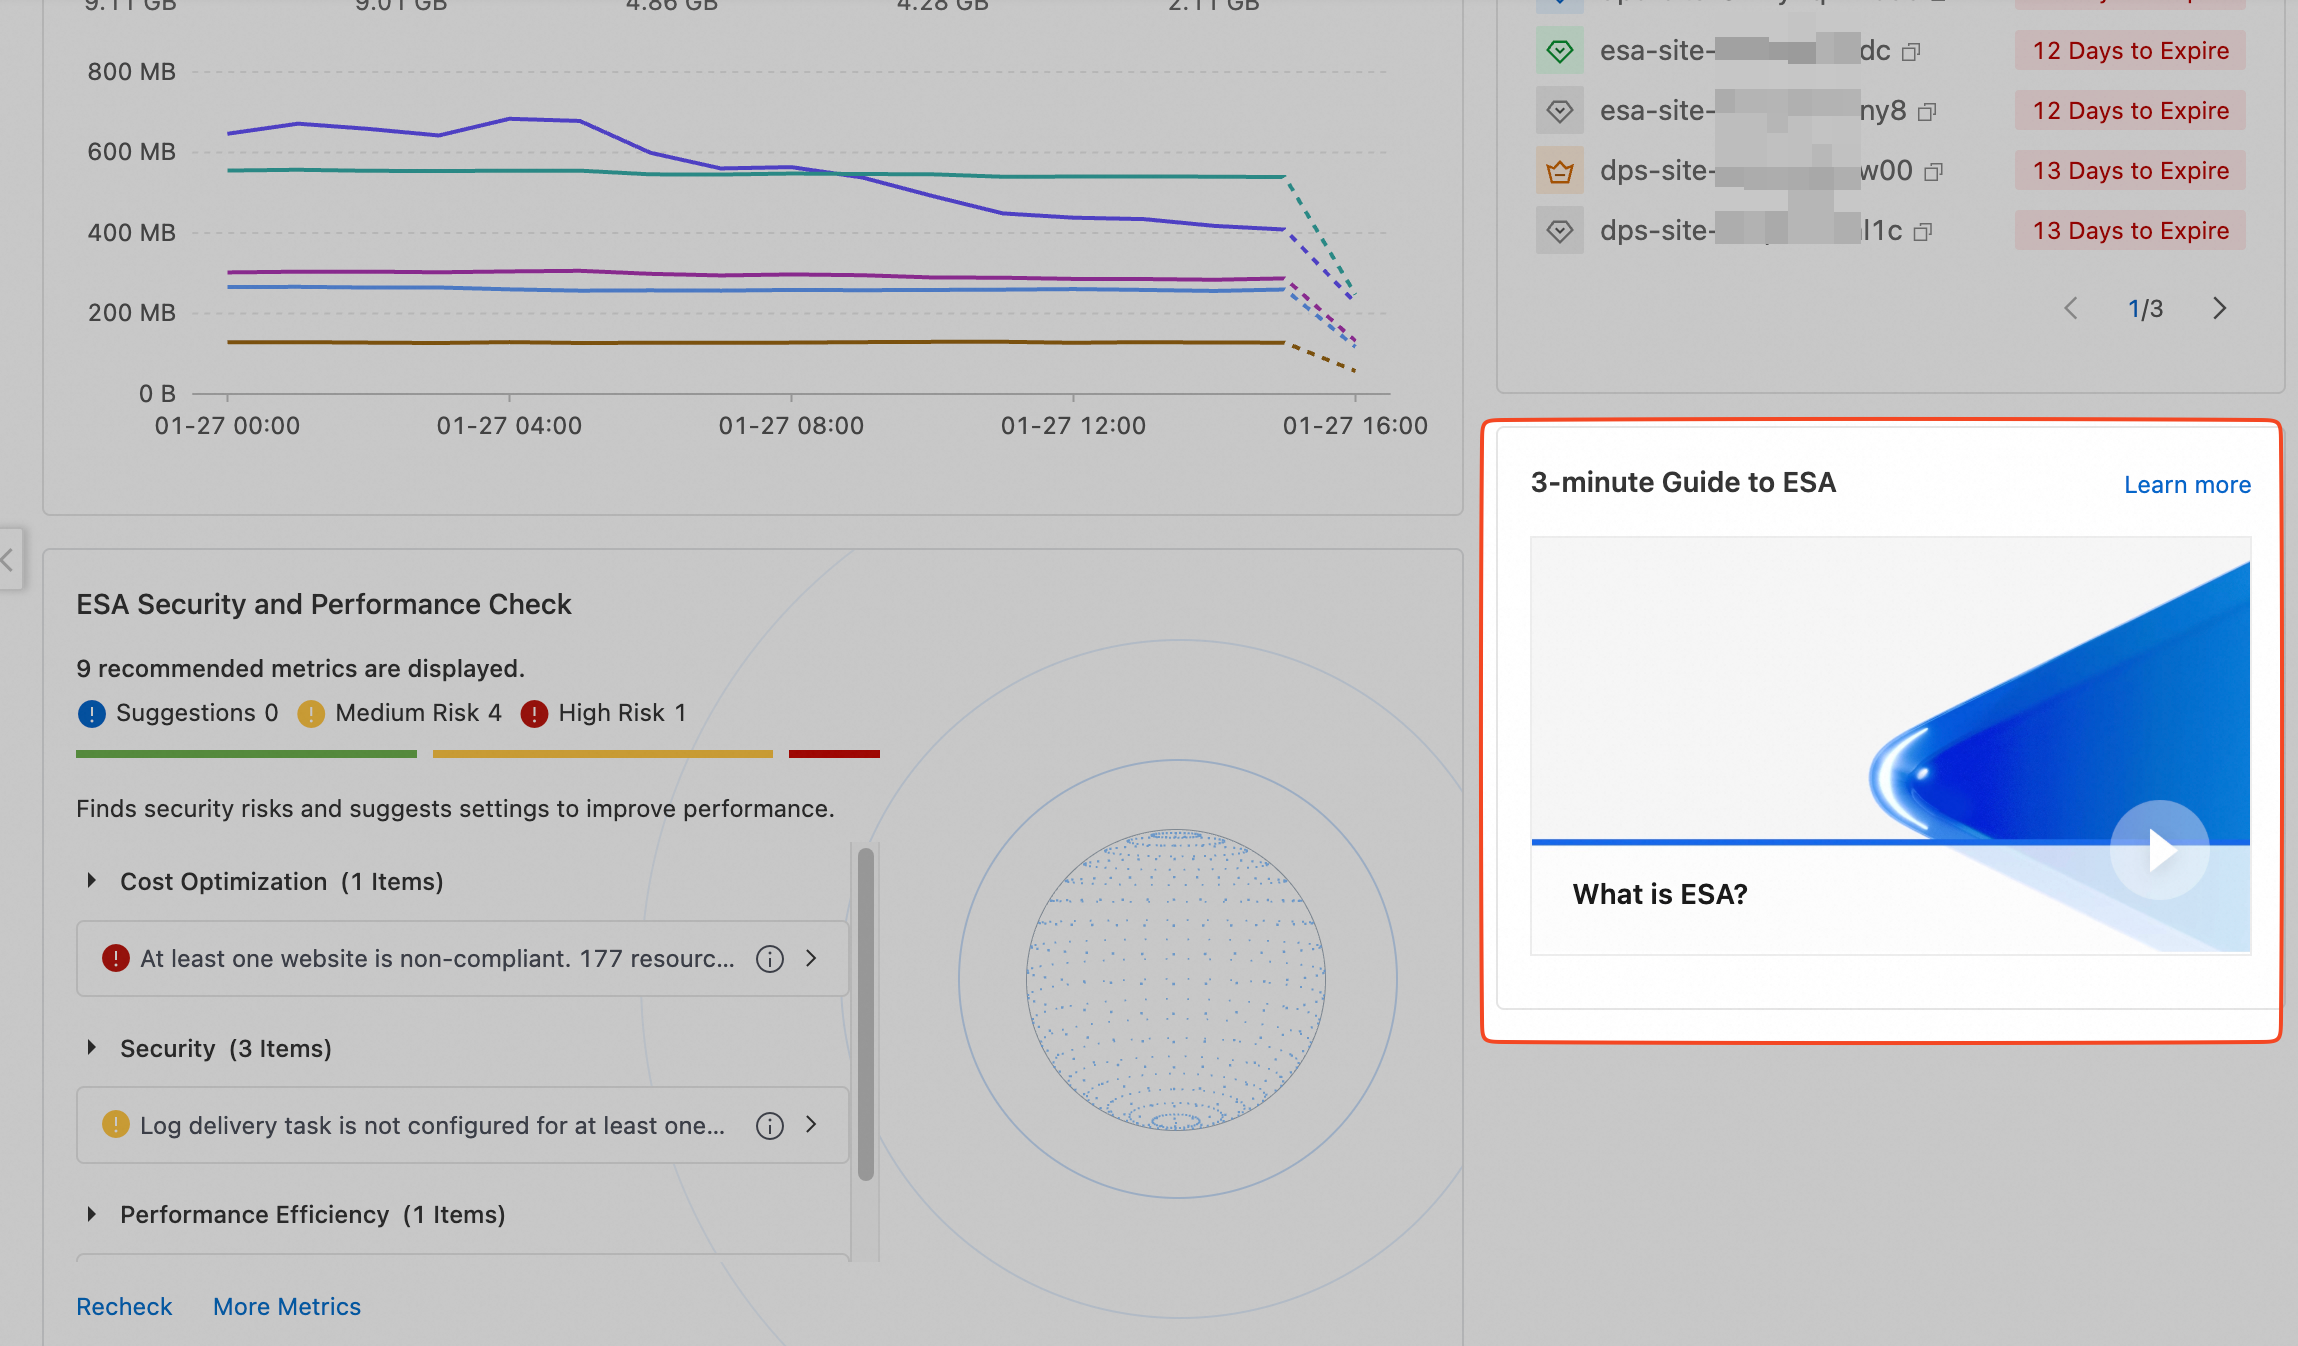
An ESA introduction video is provided to help you quickly understand the benefits for your site after you enable ESA.
You can click More to access the official documentation for ESA. This helps you gain a deeper understanding of other ESA features and better maintain your ESA-connected sites.
Reference
Risk level
Risk level | Configuration item |
High risk | ESA sites in an abnormal state. |
An ESA site is not configured with WAF managed rules. | |
An ESA site does not have TLS v1.2 enabled. | |
Medium risk | A log delivery job is not configured for an ESA site. |
Some ESA sites are not configured with WAF custom rules. | |
An ESA site does not have HSTS enabled. | |
An ESA site does not have forced HTTPS enabled. | |
Some ESA sites do not have cache rules configured. | |
An ESA site in a global region does not have smart routing enabled. |
FAQ
Where do all the protected requests come from?
On the Account Overview page, the system automatically aggregates and analyzes the number of requests from all sites in your account that received protective actions from ESA. If you notice an unusually high volume of protective request data, you can use the following procedure to identify the source of the anomaly:
In the Traffic Statistics dashboard, select a time period such as Yesterday. Click Protected Requests to view the Top 5 Websites by Protected Requests for yesterday.
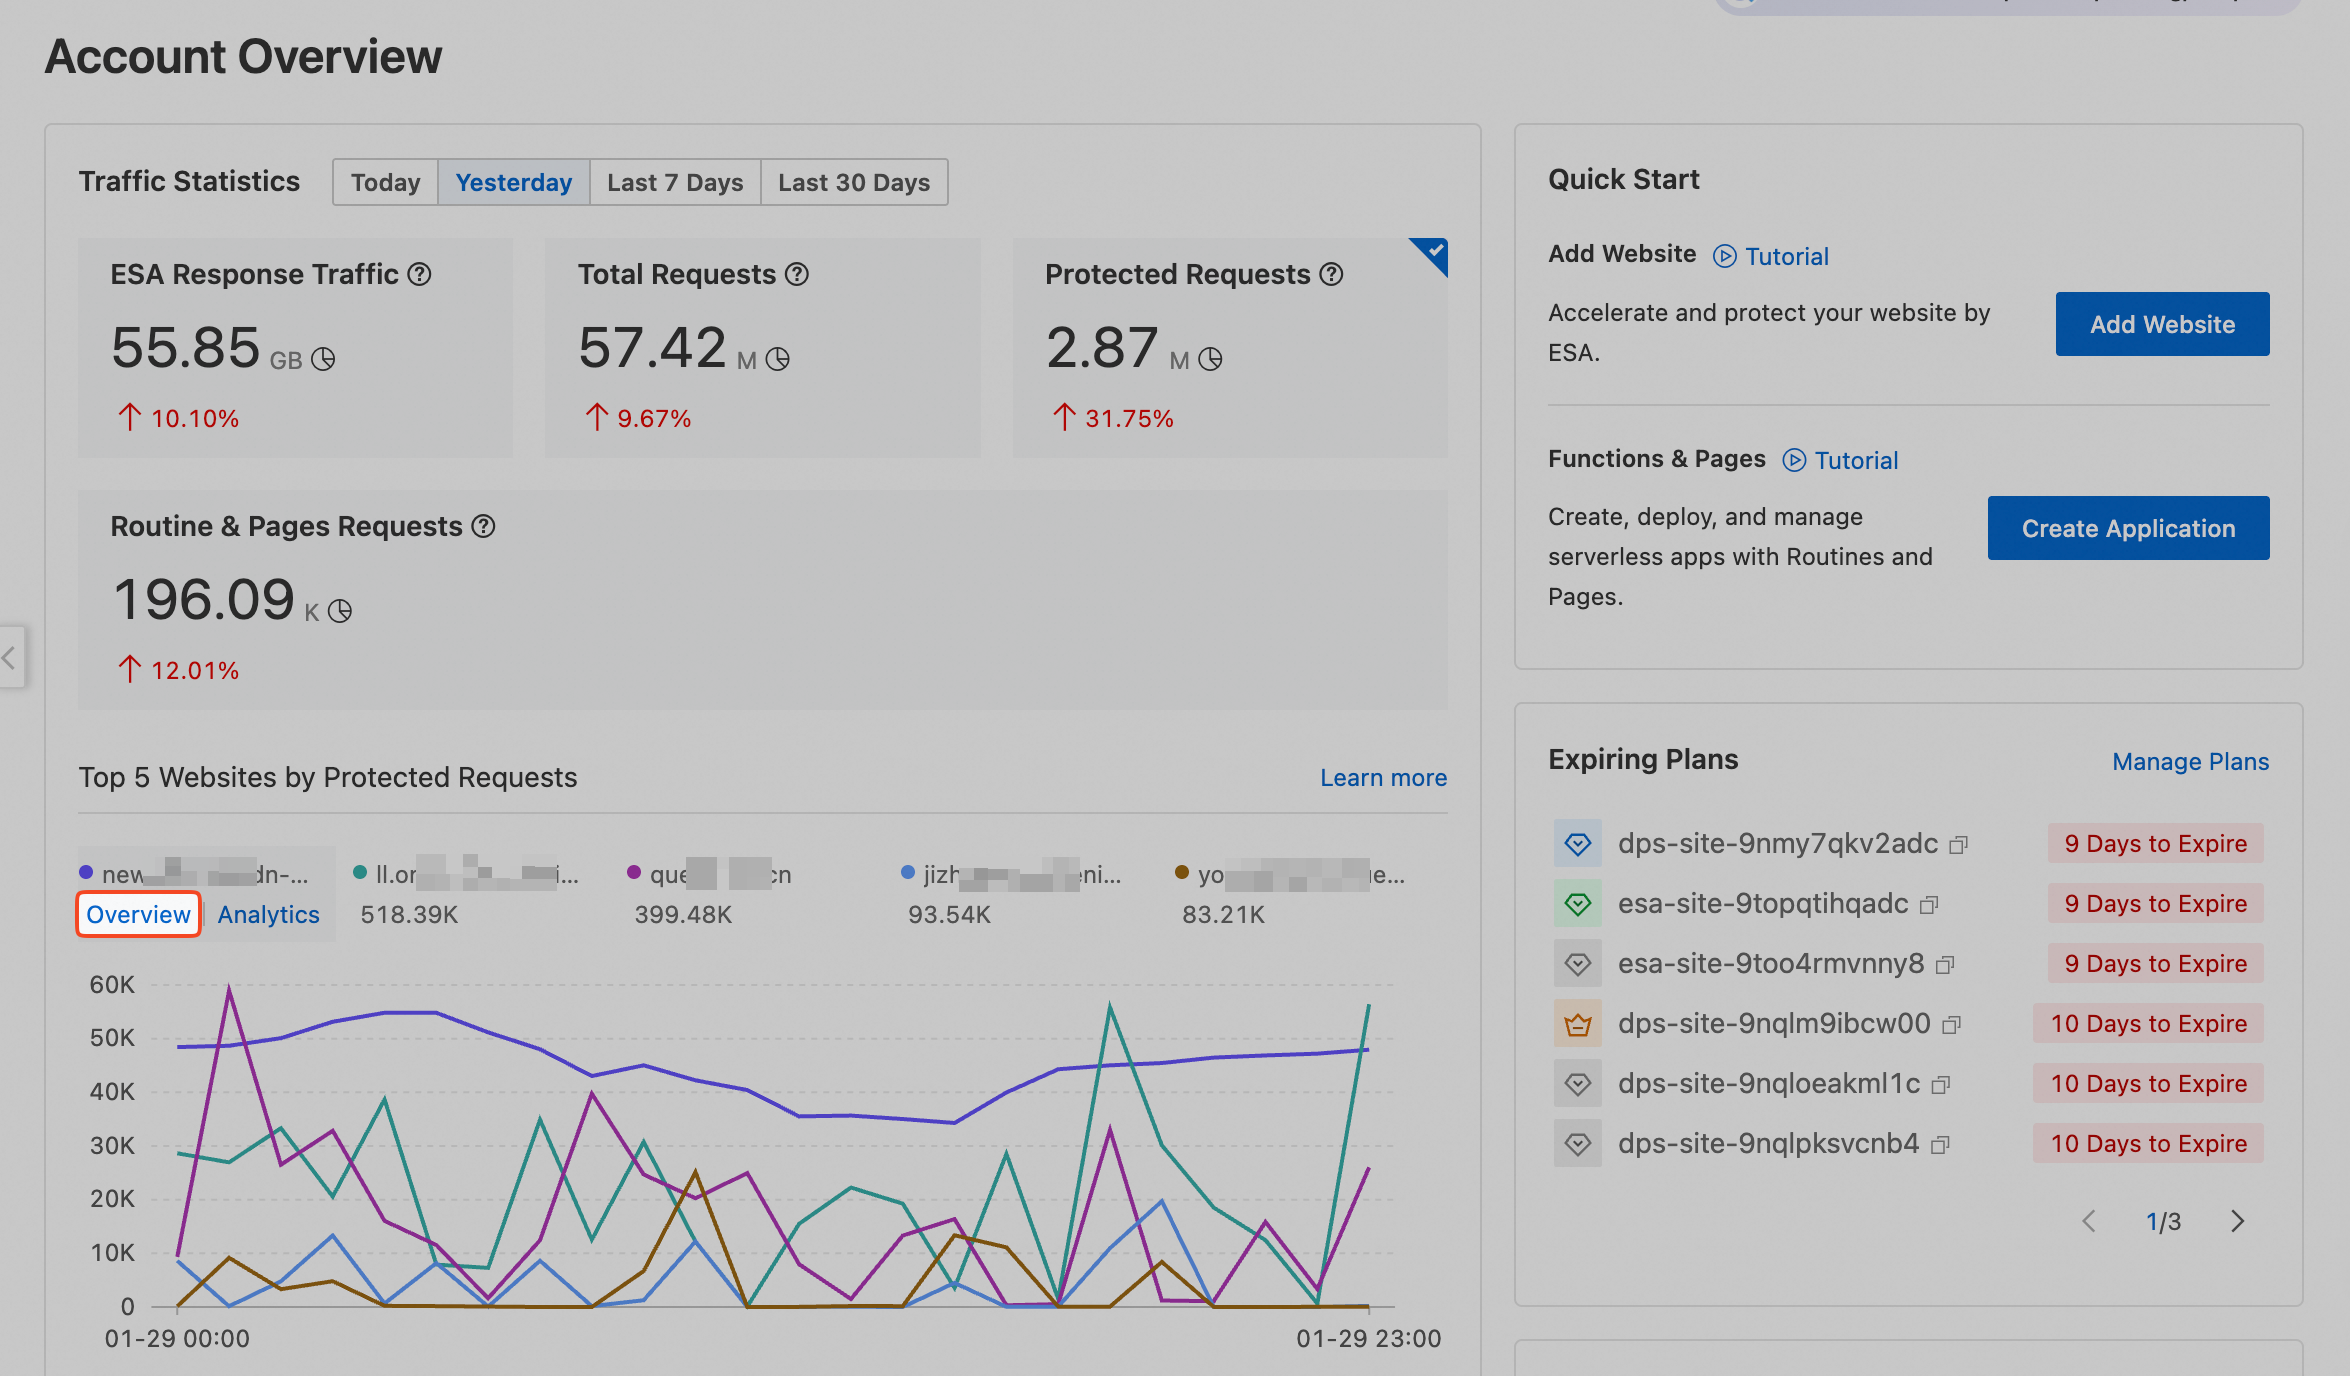
In the Top 5 Websites by Protected Requests list, click Overview for the site with abnormal data.
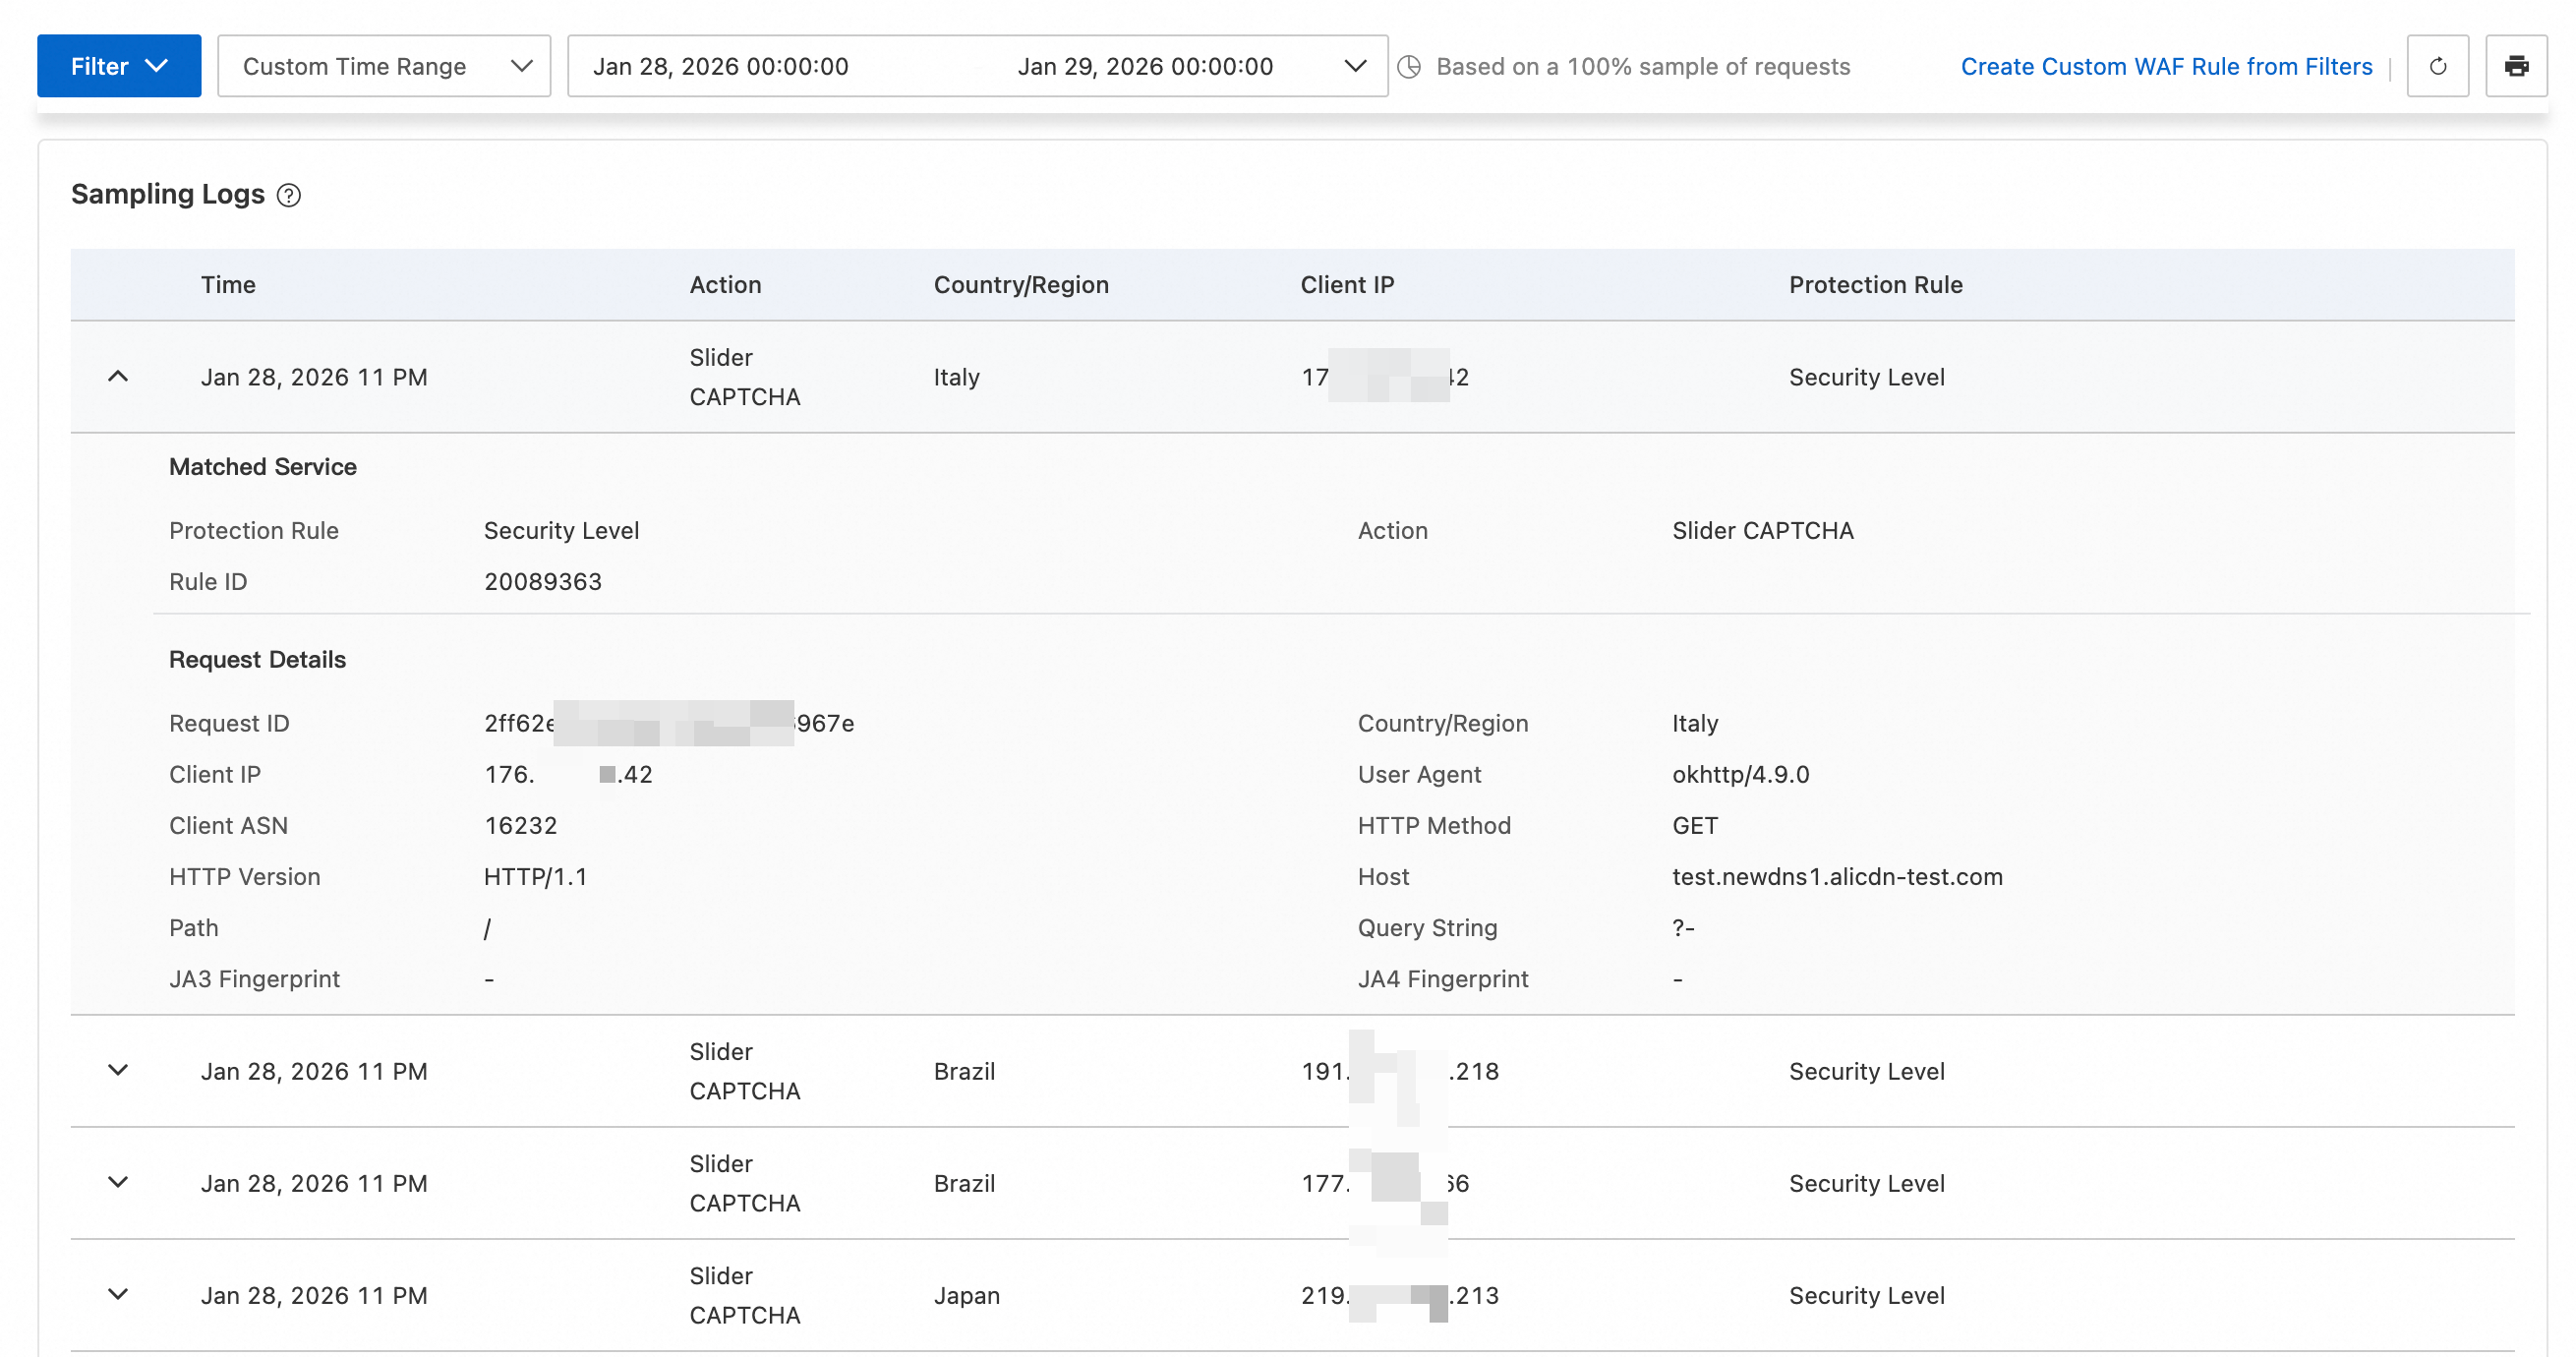
In the navigation pane on the left, select . Select Custom Time Range, such as
2025-01-28 00:00:00 ~ 2025-01-29 00:00:00, to display the protection action statistics.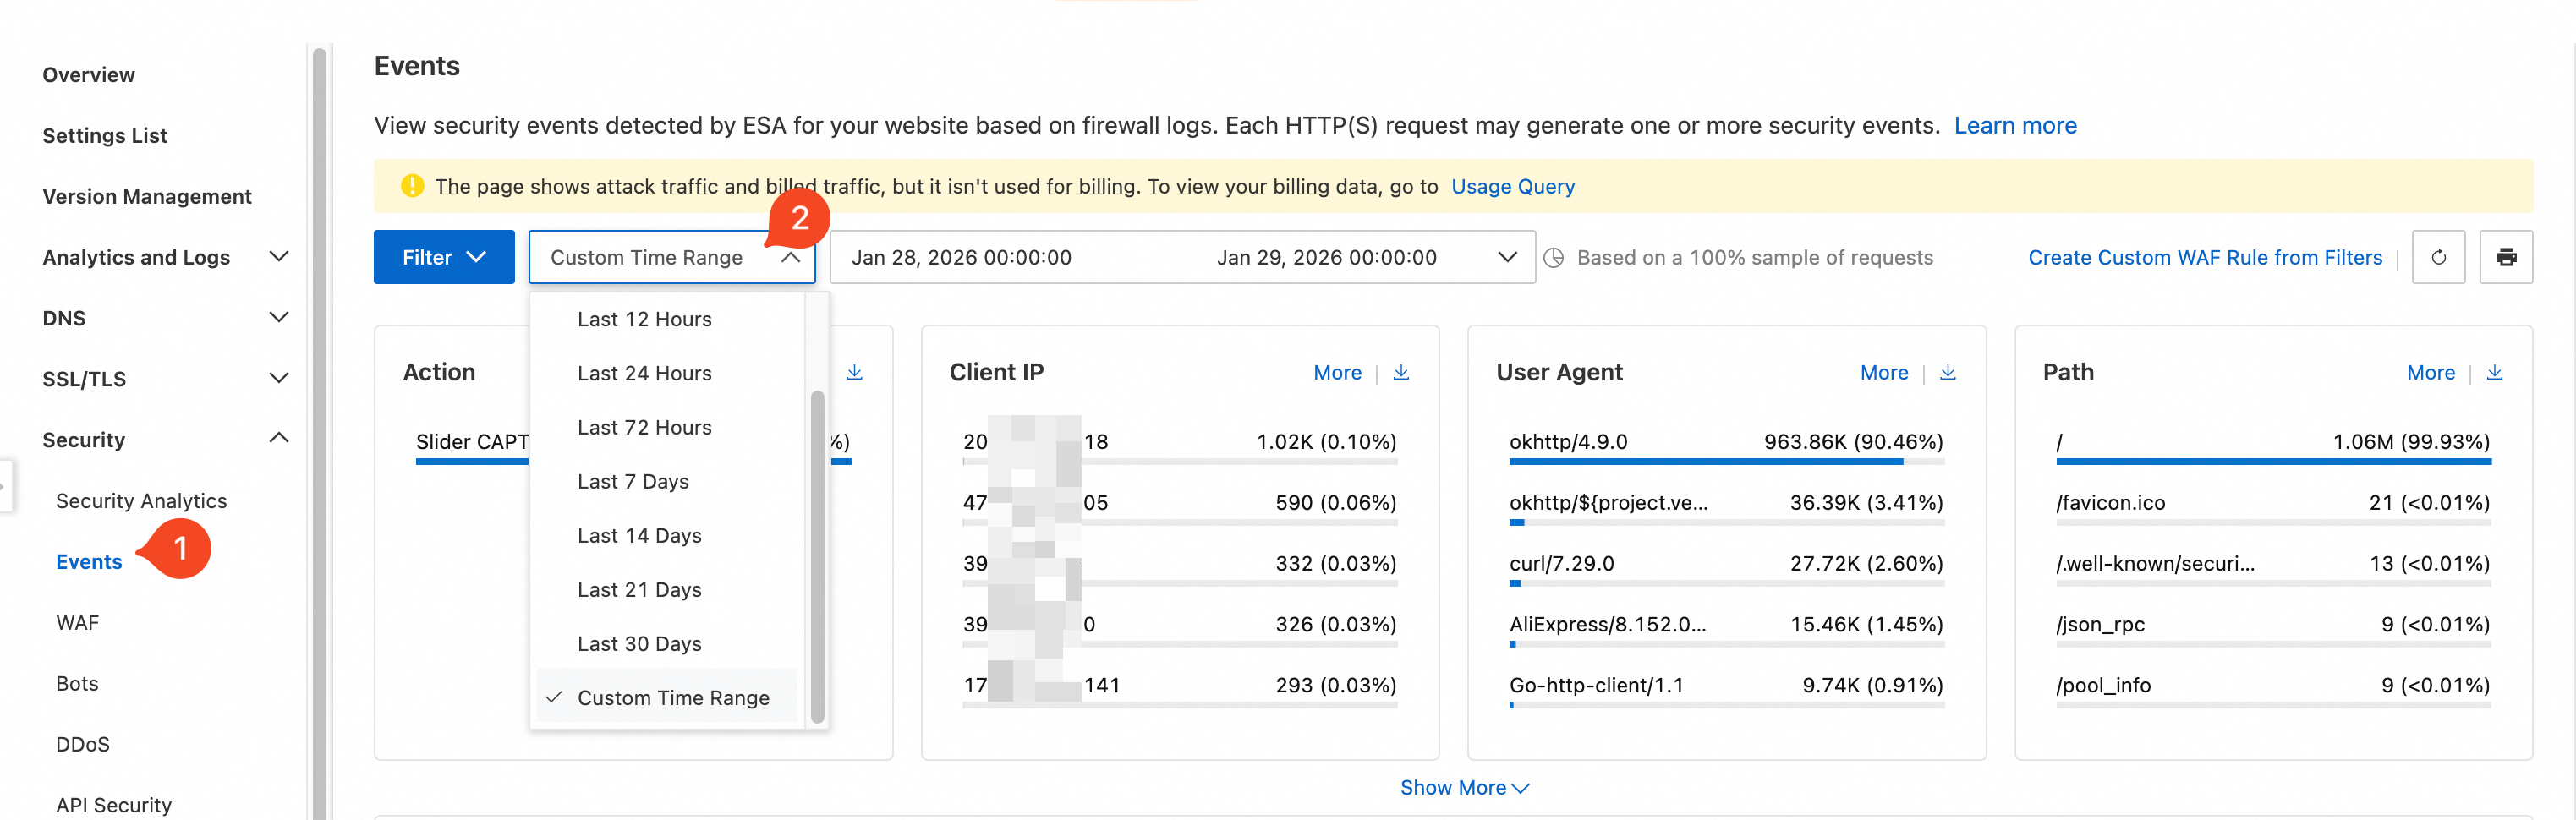
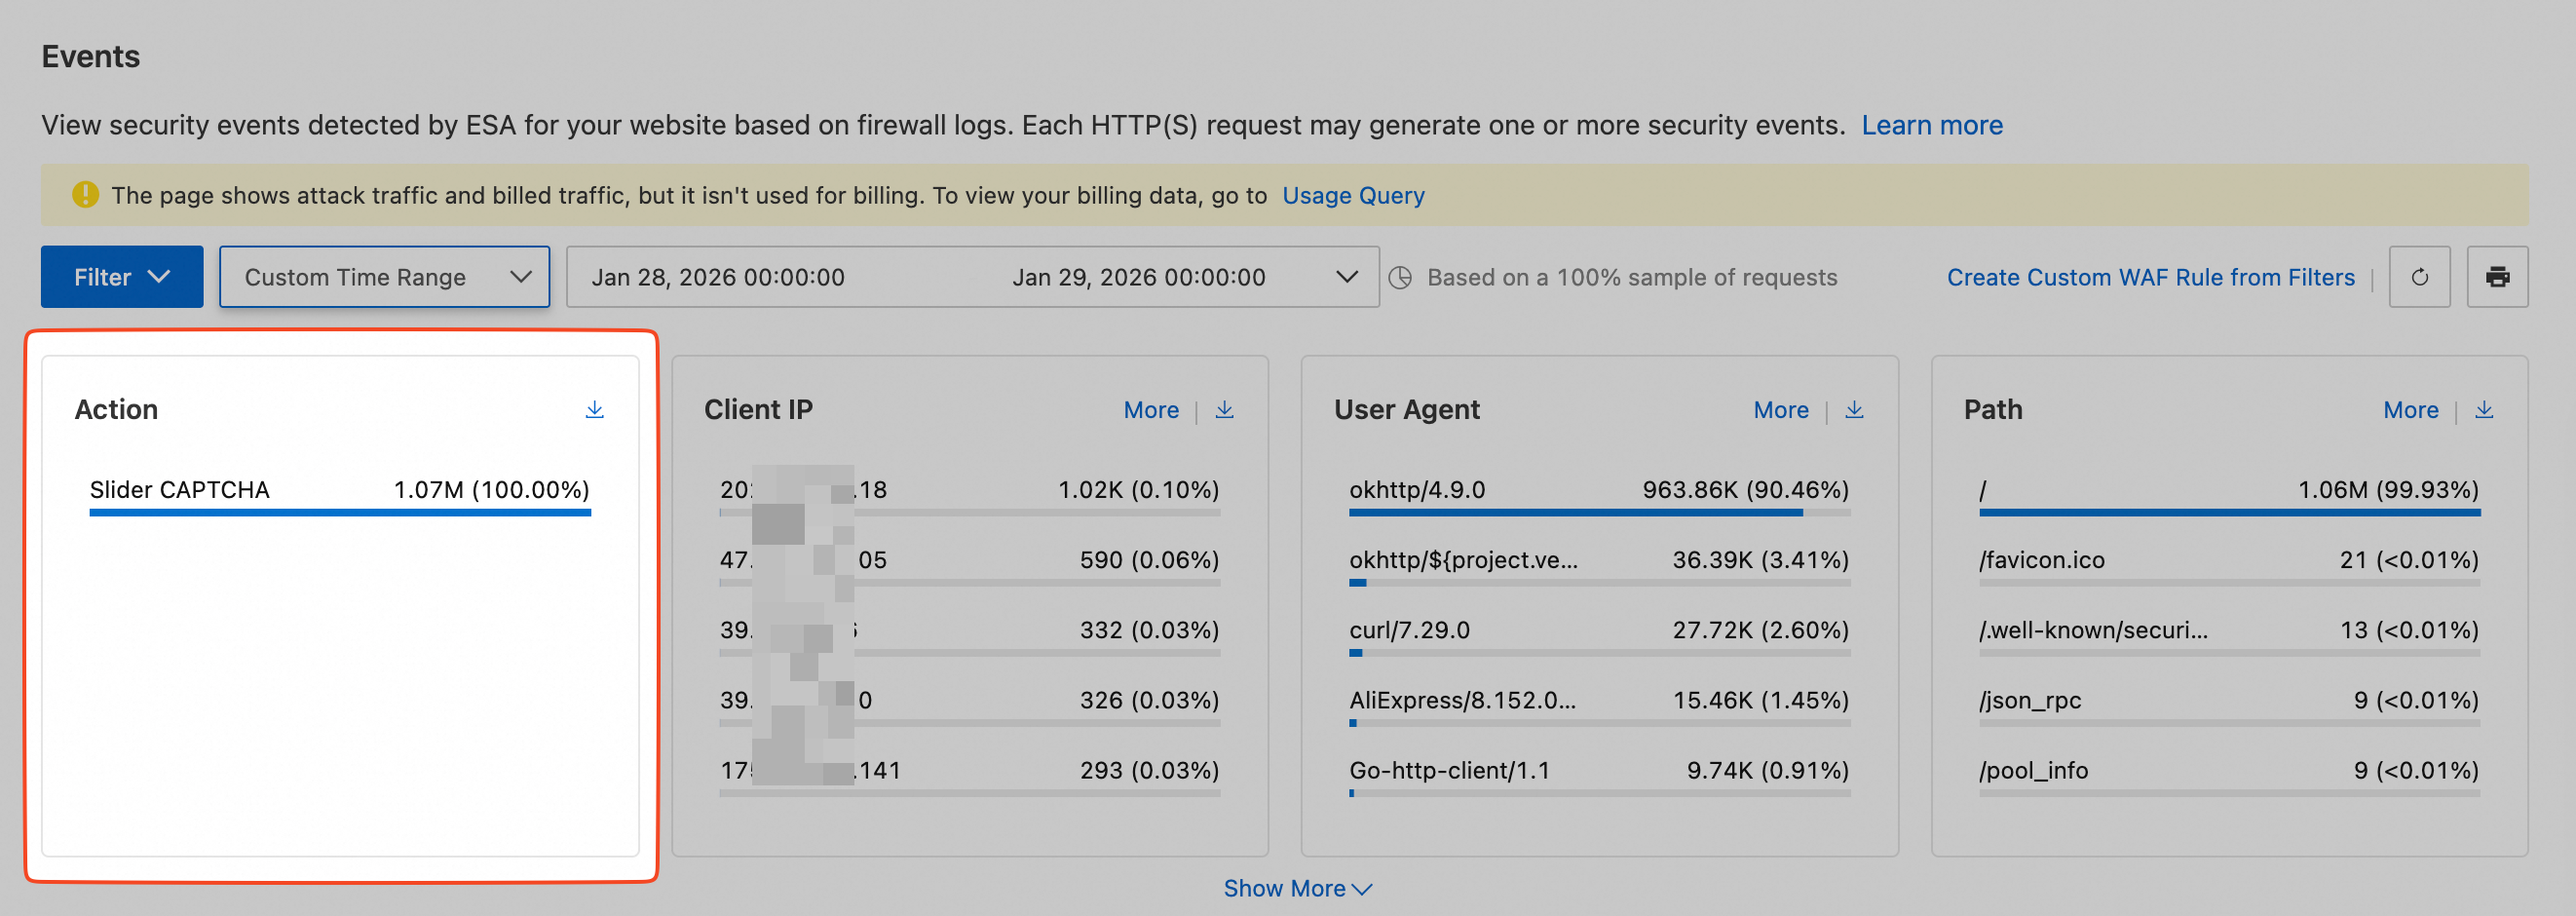
Scroll down to the Sampling Logs section to view detailed protection information.