By introducing monitoring code to web pages, Web Frontend Performance monitors user access data. This helps you monitor your website performance, such as page loading, page stability, and success rate of calls to external services.
Common scenario
You want to confirm whether website access issues are due to performance or other reasons.
There are a large number of asynchronous data calls within the website, but the performance and success rate of calls are unknown.
There are differences in user access in different regions. Regions with poor access quality need to be monitored and improved.
Prerequisites
ARMS is activated. For more information, see Activate ARMS.
You have a free 15-day trial of Web Frontend Performance after you activate ARMS. After the free trial expires, you must activate the Basic Edition or Pro Edition of Web Frontend Performance to continue using the feature.
Billing examples
Web Frontend Performance is implemented by Alibaba Cloud CDN and ARMS, and is charged by ARMS.
You have a free 15-day trial of Web Frontend Performance after you activate ARMS. During the free trial, the free quota is 20,000 times of data reporting per day. After the quota is used up, the service is automatically stopped and resumed the next day.
After the trial period ends, you can activate the Basic Edition or Pro Edition of ARMS Browser Monitoring. The pay-as-you-go billing method is available. For more information, see Overview.
Procedure
Create a monitoring task in Web Frontend Performance
Log on to the Alibaba Cloud CDN console.
In the left-side navigation pane, click Application Center.
On the Application Center page, click Try Now in the Web Frontend Performance section.
On the Web Frontend Performance page, click Create Task and set the following parameters.
Parameter
Description
Application Type
The application that supports frontend monitoring. Valid values:
Web and HTML5
DingTalk Mini Program
Alipay Mini programs
WeChat Mini program
Accelerated Domain Name
The accelerated domain name of the web application to be monitored.
Click Configure Now in the following dialog box that appears.
Install the ARMS browser monitoring agent for a web application
For more information, see Install the browser monitoring agent.
In the SDK Extension Configuration section of the ARMS configuration page, select the required options. The code of the BI probe to be pasted into the page is then generated based on the selected options.
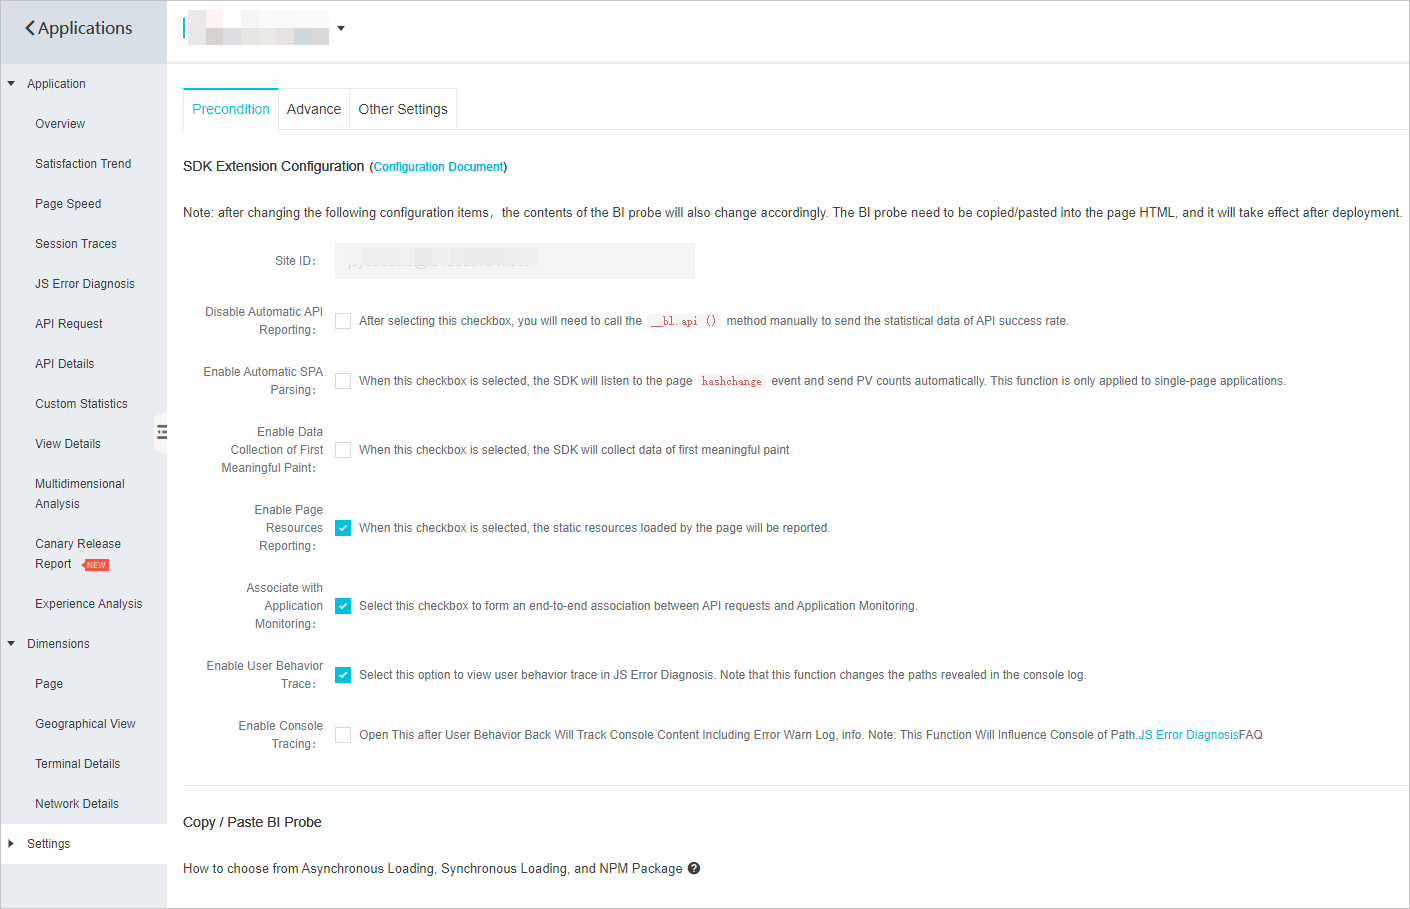
In the Copy / Paste BI Probe section, select a method to install the browser monitoring agent.
Asynchronous Loading or Synchronous Loading: Copy the provided code, paste it to the first line of the
<body>element of the HTML page, and then restart the application.NMP Package:
Run the following command to install the npm package:
npm install alife-logger --saveCopy and run the following command from the console to initialize the npm package:
const BrowserLogger = require('alife-logger');
const __bl = BrowserLogger.singleton({pid:"b590lhguqs@8cc3f63543d****",appType:"web",imgUrl:"https://arms-retcode.aliyuncs.com/r.png?",sendResource:true,behavior:true,enableLinkTrace:true,enableConsole:true});
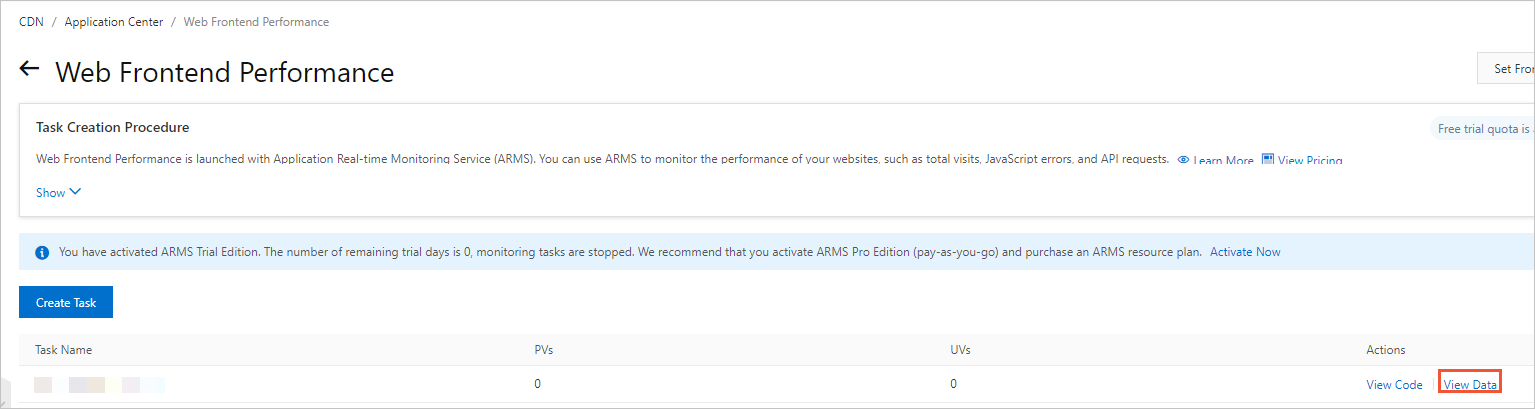
View web performance data
In Web Frontend Performance page in the Alibaba Cloud CDN console, click View Data.
On the Overview page of Web Frontend Performance, you can view all the critical monitoring data in real time. For more information, see Console features.
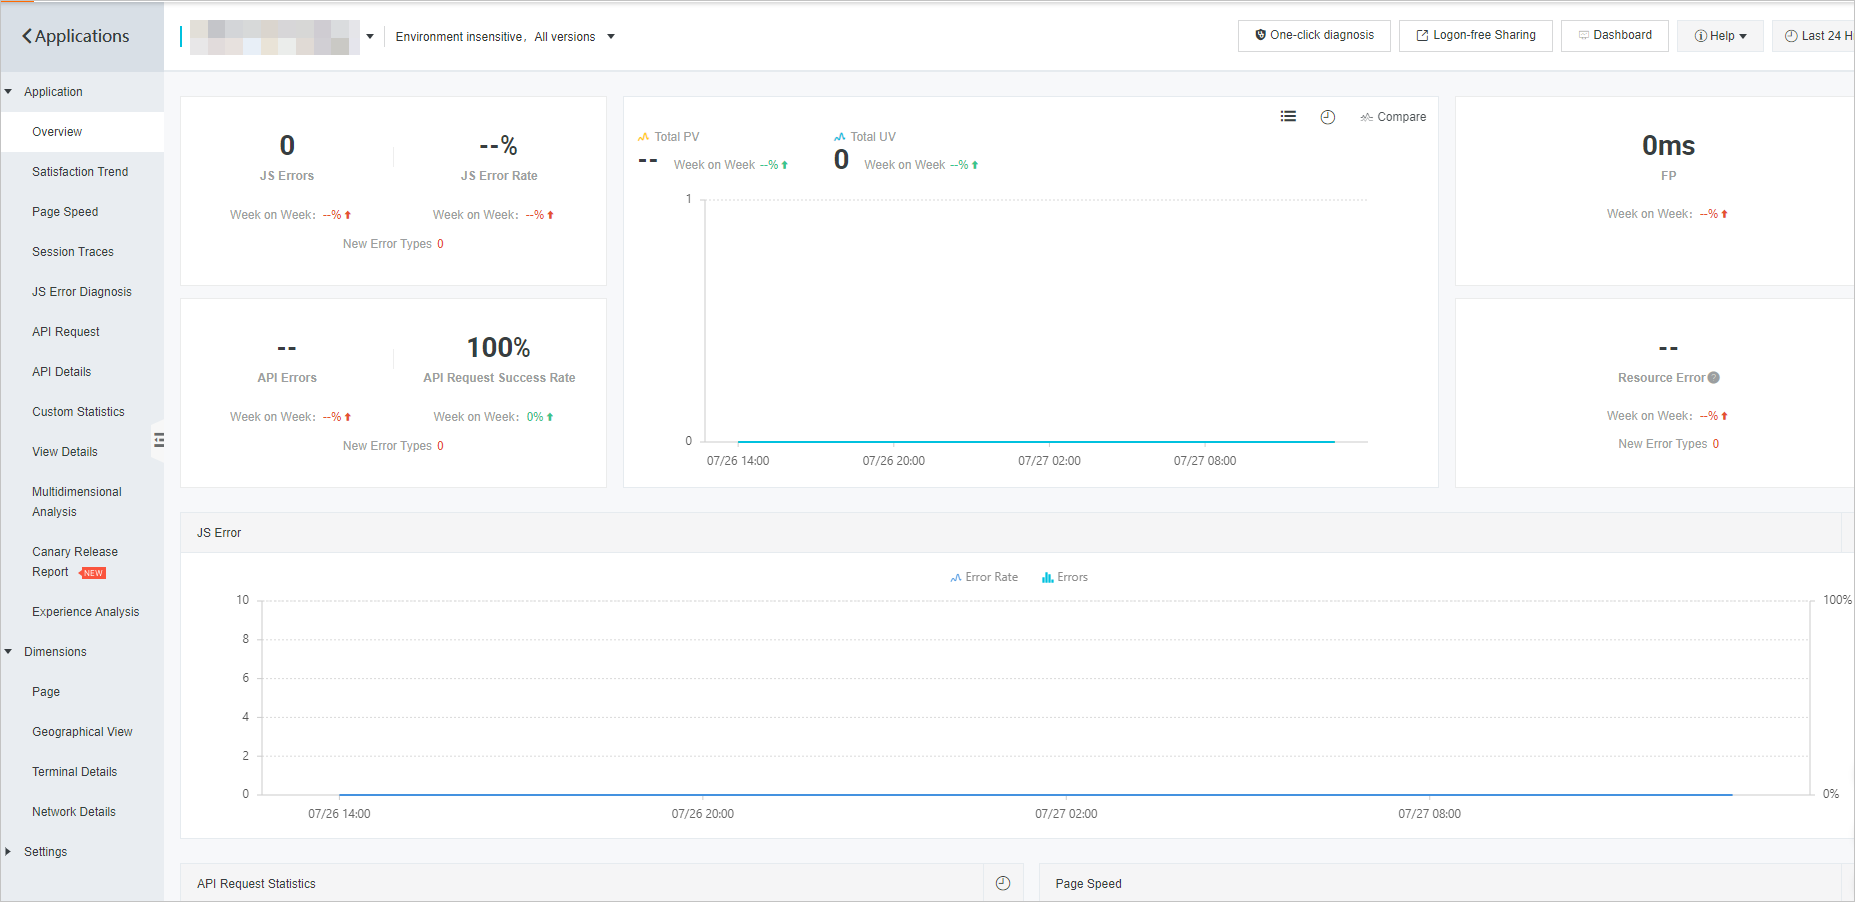
Data fields
Item | Description |
JS Errors |
|
Alerts in the last 24 hours |
|
PV/UV |
|
API request success rate |
|
Page loading speed |
|
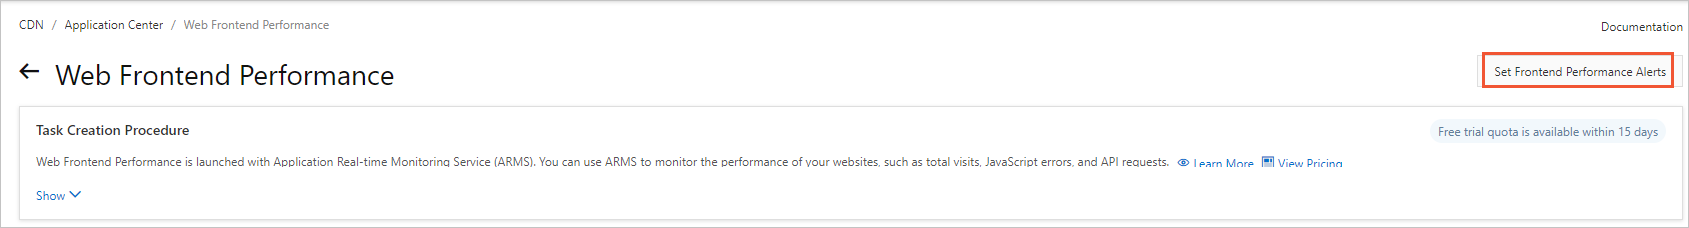
Set frontend performance alerts
In Web Frontend Performance page in the Alibaba Cloud CDN console, click Set Frontend Performance Alerts.
You can select multiple alert metrics, such as the first paint time (FPT), first meaningful paint (FMP), page, and region, to set alerts and alert rules. If an alert is triggered, alert notifications are sent to the contacts or DingTalk group chat based on the specified notification methods. This topic describes how to configure dynamic thresholds in RUM alerting. For more information, see Create and manage a Browser Monitoring alert rules.