If you use Application Monitoring of Application Real-Time Monitoring Service (ARMS) to monitor an application with a common Java framework, the ARMS agent automatically instruments the framework. You can collect trace information without the need to modify business code. To reflect the execution status of a business method in the trace information, you can use an OpenTelemetry SDK for Java to add custom instrumentation code to the code. This topic describes how to use the SDK to instrument your application, and capture trace contexts, custom baggages, and attributes.
For information about the components and frameworks supported by ARMS, see Java components and frameworks supported by ARMS.
Prerequisites
Your application is monitored in Application Monitoring.
The ARMS agent is V2.9.1.2 or later. If it's earlier than this version, update it.
Add dependencies
Add the following Maven dependencies to introduce OpenTelemetry SDK for Java. For more information, see Instrumentation.
<dependencies>
    <dependency>
    <groupId>io.opentelemetry</groupId>
    <artifactId>opentelemetry-api</artifactId>
    </dependency>
    <dependency>
    <groupId>io.opentelemetry</groupId>
    <artifactId>opentelemetry-sdk-trace</artifactId>
    </dependency>
    <dependency>
    <groupId>io.opentelemetry</groupId>
    <artifactId>opentelemetry-sdk</artifactId>
    </dependency>
</dependencies>

<dependencyManagement>
  <dependencies>
    <dependency>
      <groupId>io.opentelemetry</groupId>
      <artifactId>opentelemetry-bom</artifactId>
      <version>1.23.0</version>
      <type>pom</type>
      <scope>import</scope>
    </dependency>
  </dependencies>
</dependencyManagement>
Compatibility between ARMS and OpenTelemetry-based instrumentation
Terms
Only some commonly used terms are introduced here. For information about other names, see OpenTelemetry Specification.
Span: a specific operation in a request, such as a remote call or an internal method call.
SpanContext: the context for a single request trace, which includes information such as traceId and spanId.
Attribute: an additional attribute field of a span, which is used to record key information.
Baggage: key-value pairs that are propagated throughout the entire trace.
Use OpenTelemetry SDK for Java
You can use the SDK to perform the following operations:
Create a new Span using instrumentation code.
Add Attributes to the Span.
Propagate Baggage items in the trace context.
Access the trace context and output identifiers like traceId and spanId.
The following sample code shows how to use the SDK to perform the preceding operations.
You must retrieve the OpenTelemetry instance by calling the GlobalOpenTelemetry.get() method, rather than directly use the OpenTelemetry instance that was manually created using the SDK. Otherwise, the Span data generated by SDK instrumentation becomes invisible when using the ARMS agent v4.x.
@RestController
@RequestMapping("/ot")
public class OpenTelemetryController {

    private Tracer tracer;

    private ScheduledExecutorService ses = Executors.newSingleThreadScheduledExecutor();

    @PostConstruct
    public void init() {
	    OpenTelemetrySdk.builder()
			.setPropagators(ContextPropagators.create(W3CTraceContextPropagator.getInstance()))
			.buildAndRegisterGlobal();

		tracer = GlobalOpenTelemetry.get().getTracer("manual-sdk", "1.0.0");

        ses.scheduleAtFixedRate(new Runnable() {
            @Override
            public void run() {
                Span span = tracer.spanBuilder("schedule")
                        .setAttribute("schedule.time", System.currentTimeMillis())
                        .startSpan();
                try (Scope scope = span.makeCurrent()) {
                    System.out.println("scheduled!");
                    Thread.sleep(500L);
                    span.setAttribute("schedule.success", true);
                    System.out.println(Span.current().getSpanContext().getTraceId()); // Obtain the trace ID.
                } catch (Throwable t) {
                    span.setStatus(StatusCode.ERROR, t.getMessage());
                } finally {
                    span.end();
                }
            }
        }, 10, 30, TimeUnit.SECONDS);
    }

    @ResponseBody
    @RequestMapping("/parent")
    public String parent() {
        Span span = tracer.spanBuilder("parent").setSpanKind(SpanKind.SERVER).startSpan();
        try (Scope scope = span.makeCurrent()) {
            // Use Baggage to propagate the custom tags of the service.
            Baggage baggage =  Baggage.current().toBuilder()
                    .put("user.id", "1")
                    .put("user.name", "name")
                    .build();
            try (Scope baggageScope = baggage.storeInContext(Context.current()).makeCurrent()) {
                child();
            }
            span.setAttribute("http.method", "GET");
            span.setAttribute("http.uri", "/parent");
        } finally {
            span.end();
        }
        return "parent";
    }

    private void child() {
        Span span = tracer.spanBuilder("child").startSpan();
        try (Scope scope = span.makeCurrent()) {
            System.out.println("current traceId = " + Span.current().getSpanContext().getTraceId());
            System.out.println("userId in baggage = " + Baggage.current().getEntryValue("user.id"));
            Thread.sleep(1000);
        } catch (Throwable e) {
            span.setStatus(StatusCode.ERROR, e.getMessage());
        } finally {
            span.end();
        }
    }
}
Details:
In the
initmethod of theOpenTelemetryController, a scheduled task is initiated using a ScheduledExecutorService. When the scheduled task starts, it creates a Span and closes this Span when the task ends.In the
parentmethod of theOpenTelemetryController, multiple methods from the OpenTelemetry SDK are invoked.Each time this method is called, it creates a Span named
parentand closes this Span when the method ends.It also calls the Baggage SDK to add two pairs of Baggage named
user.idanduser.name. These two pieces of Baggage will be propagated to downstream applications.Two Attributes are added to the Span created in Step 2.a.
In the
childmethod of theOpenTelemetryController, the following operations are performed.Each time this method is called, it creates a Span named
childand closes this Span when the method ends. Note that this Span is a child of the Span created in Step 2.a.The method retrieves the Trace context and prints the traceId.
It also retrieves and prints the Baggage items (user.id and user.name) added in Step 2.b.
Comparison of agent versions
Different ARMS agent versions provide different support for the preceding steps, as shown in the following table.
Step | ARMS Agent v4.x and later | ARMS Agent v3.x and earlier |
1 | Supported. A new Span is generated. | Supported. A new Span is generated. |
2.1 | Supported | Supported |
2.2 | Supported | Not supported |
2.3 | Supported | Supported |
3.1 | Supported | Supported. This span is used as the method stack of the Span created in Step 2.a. |
3.2 | Supported. The printed traceId is the same as that provided by the agent. | Not supported. The printed traceId is different from that provided by the agent. |
3.2 | Supported | Supported |
Instrumentation effect
ARMS agent v4.x and later
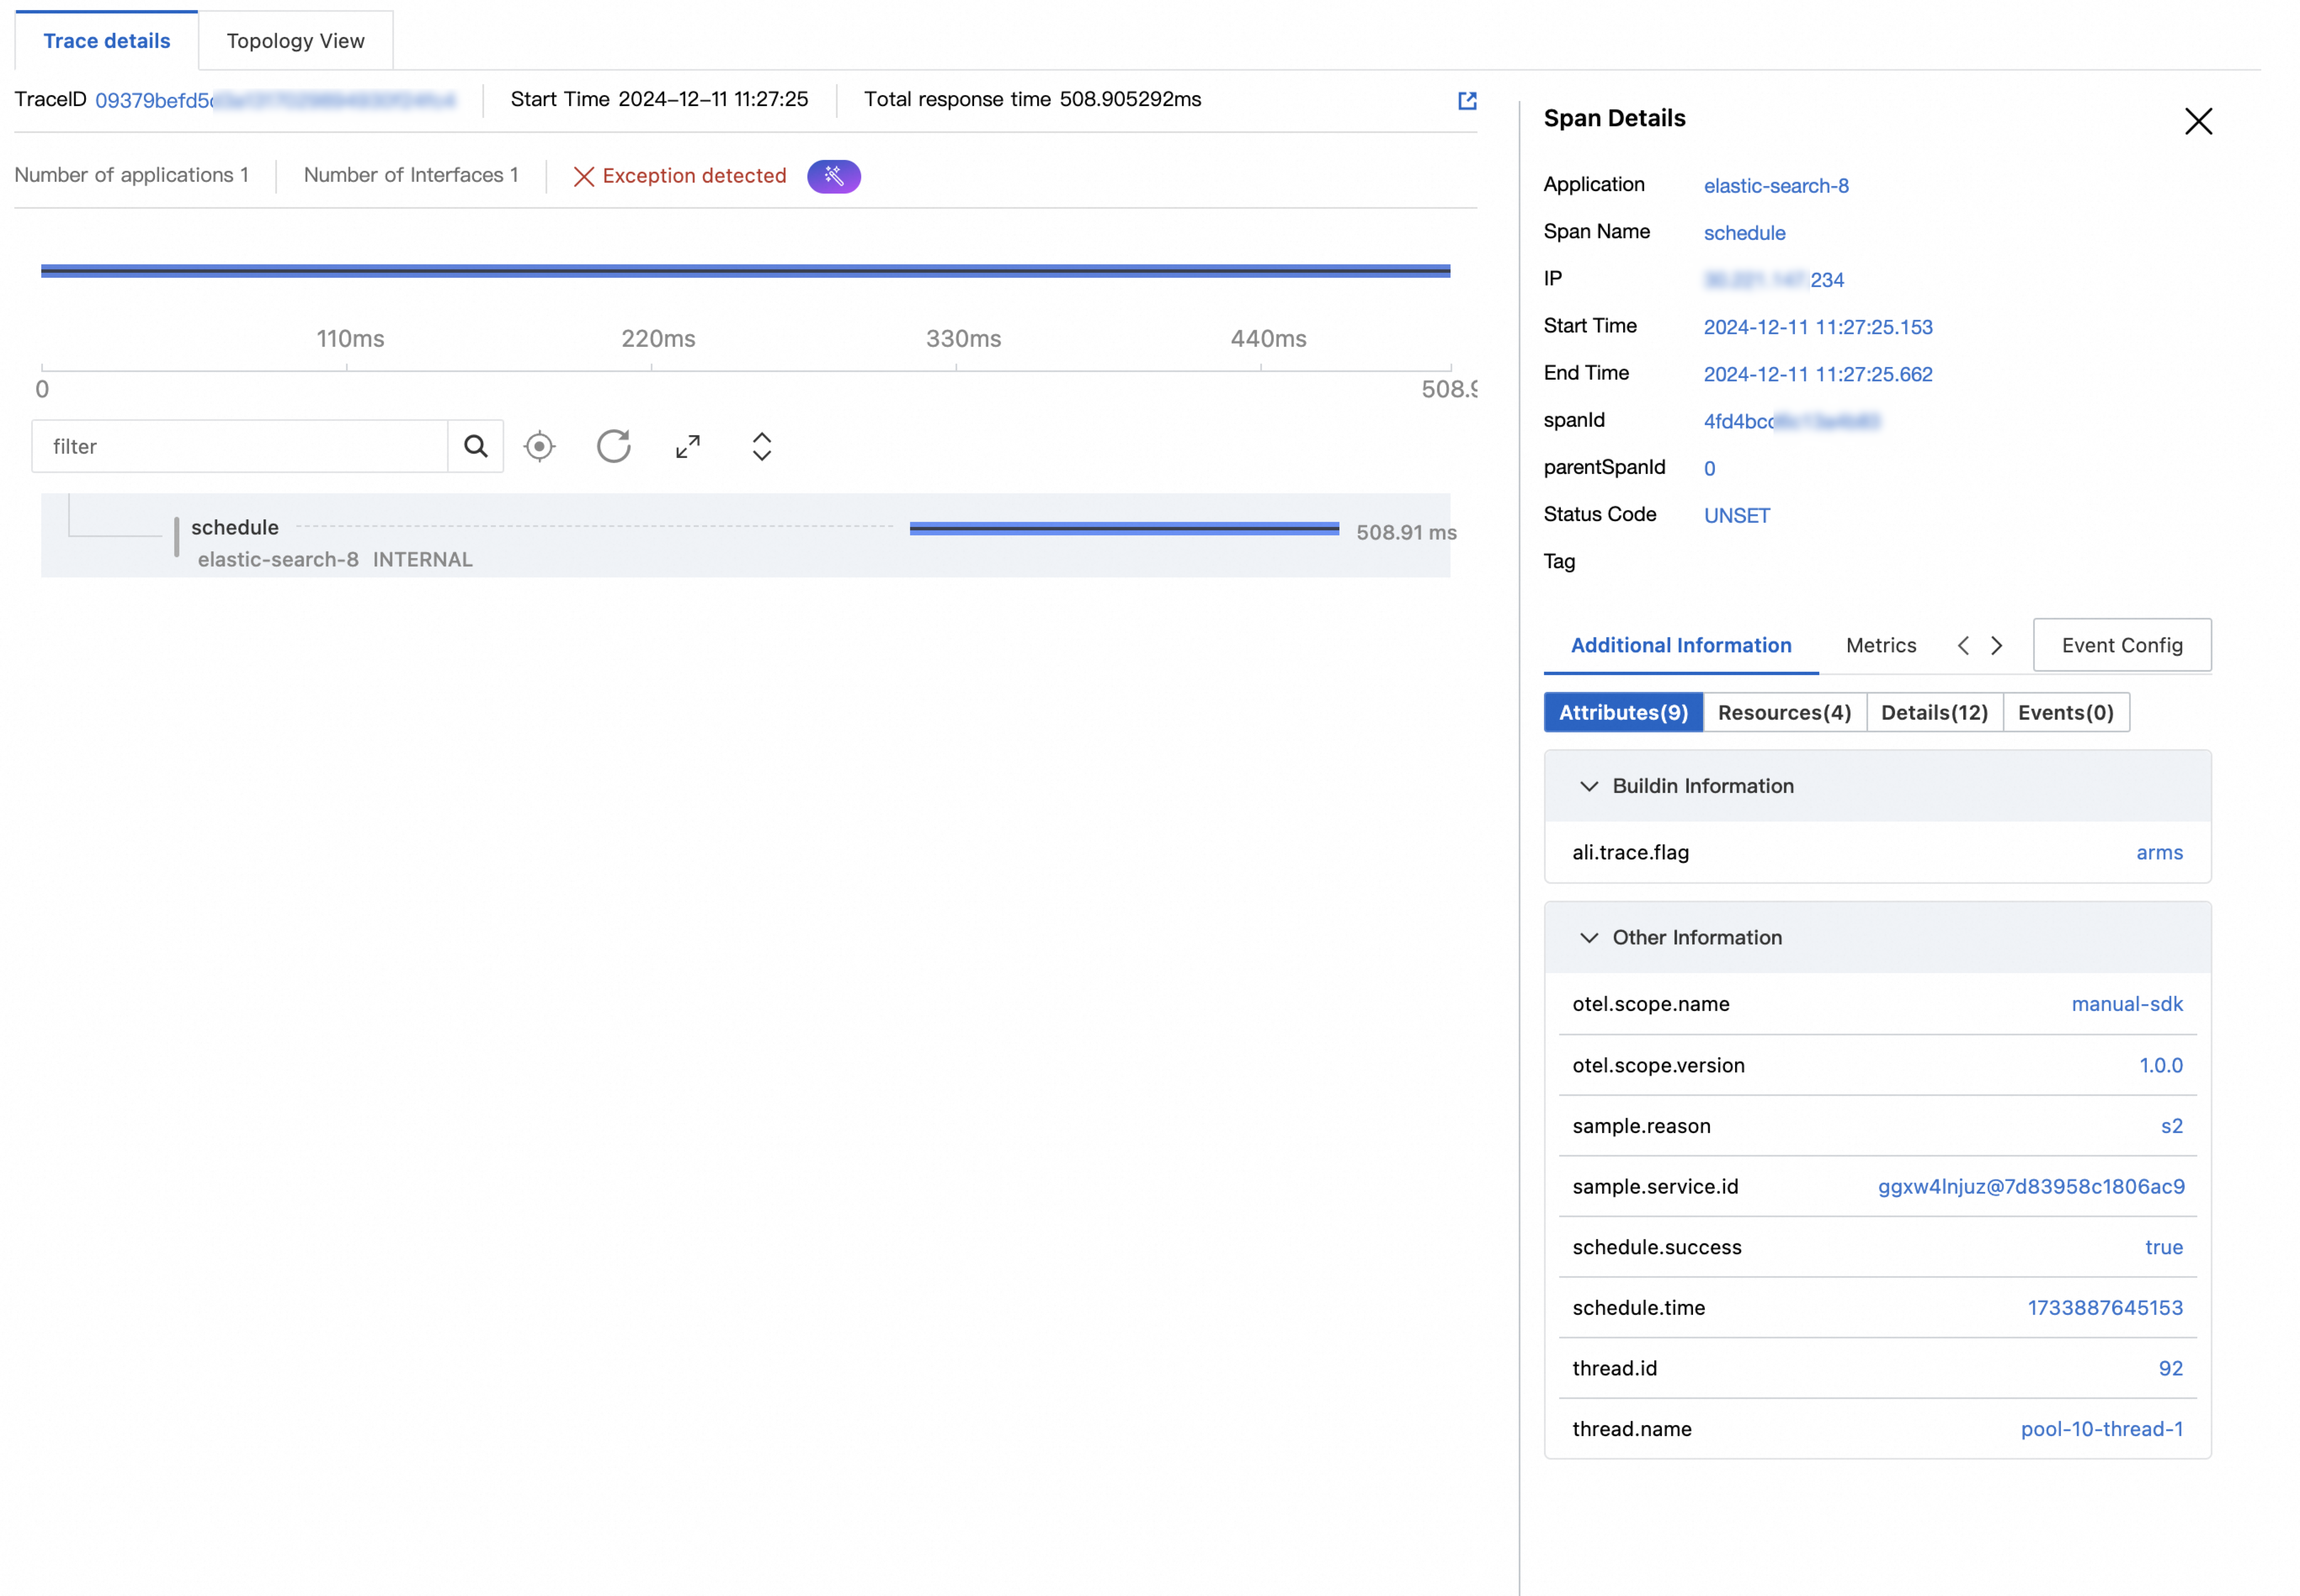
Step 1:
The Spans generated via the OpenTelemetry SDK can be seen normally.
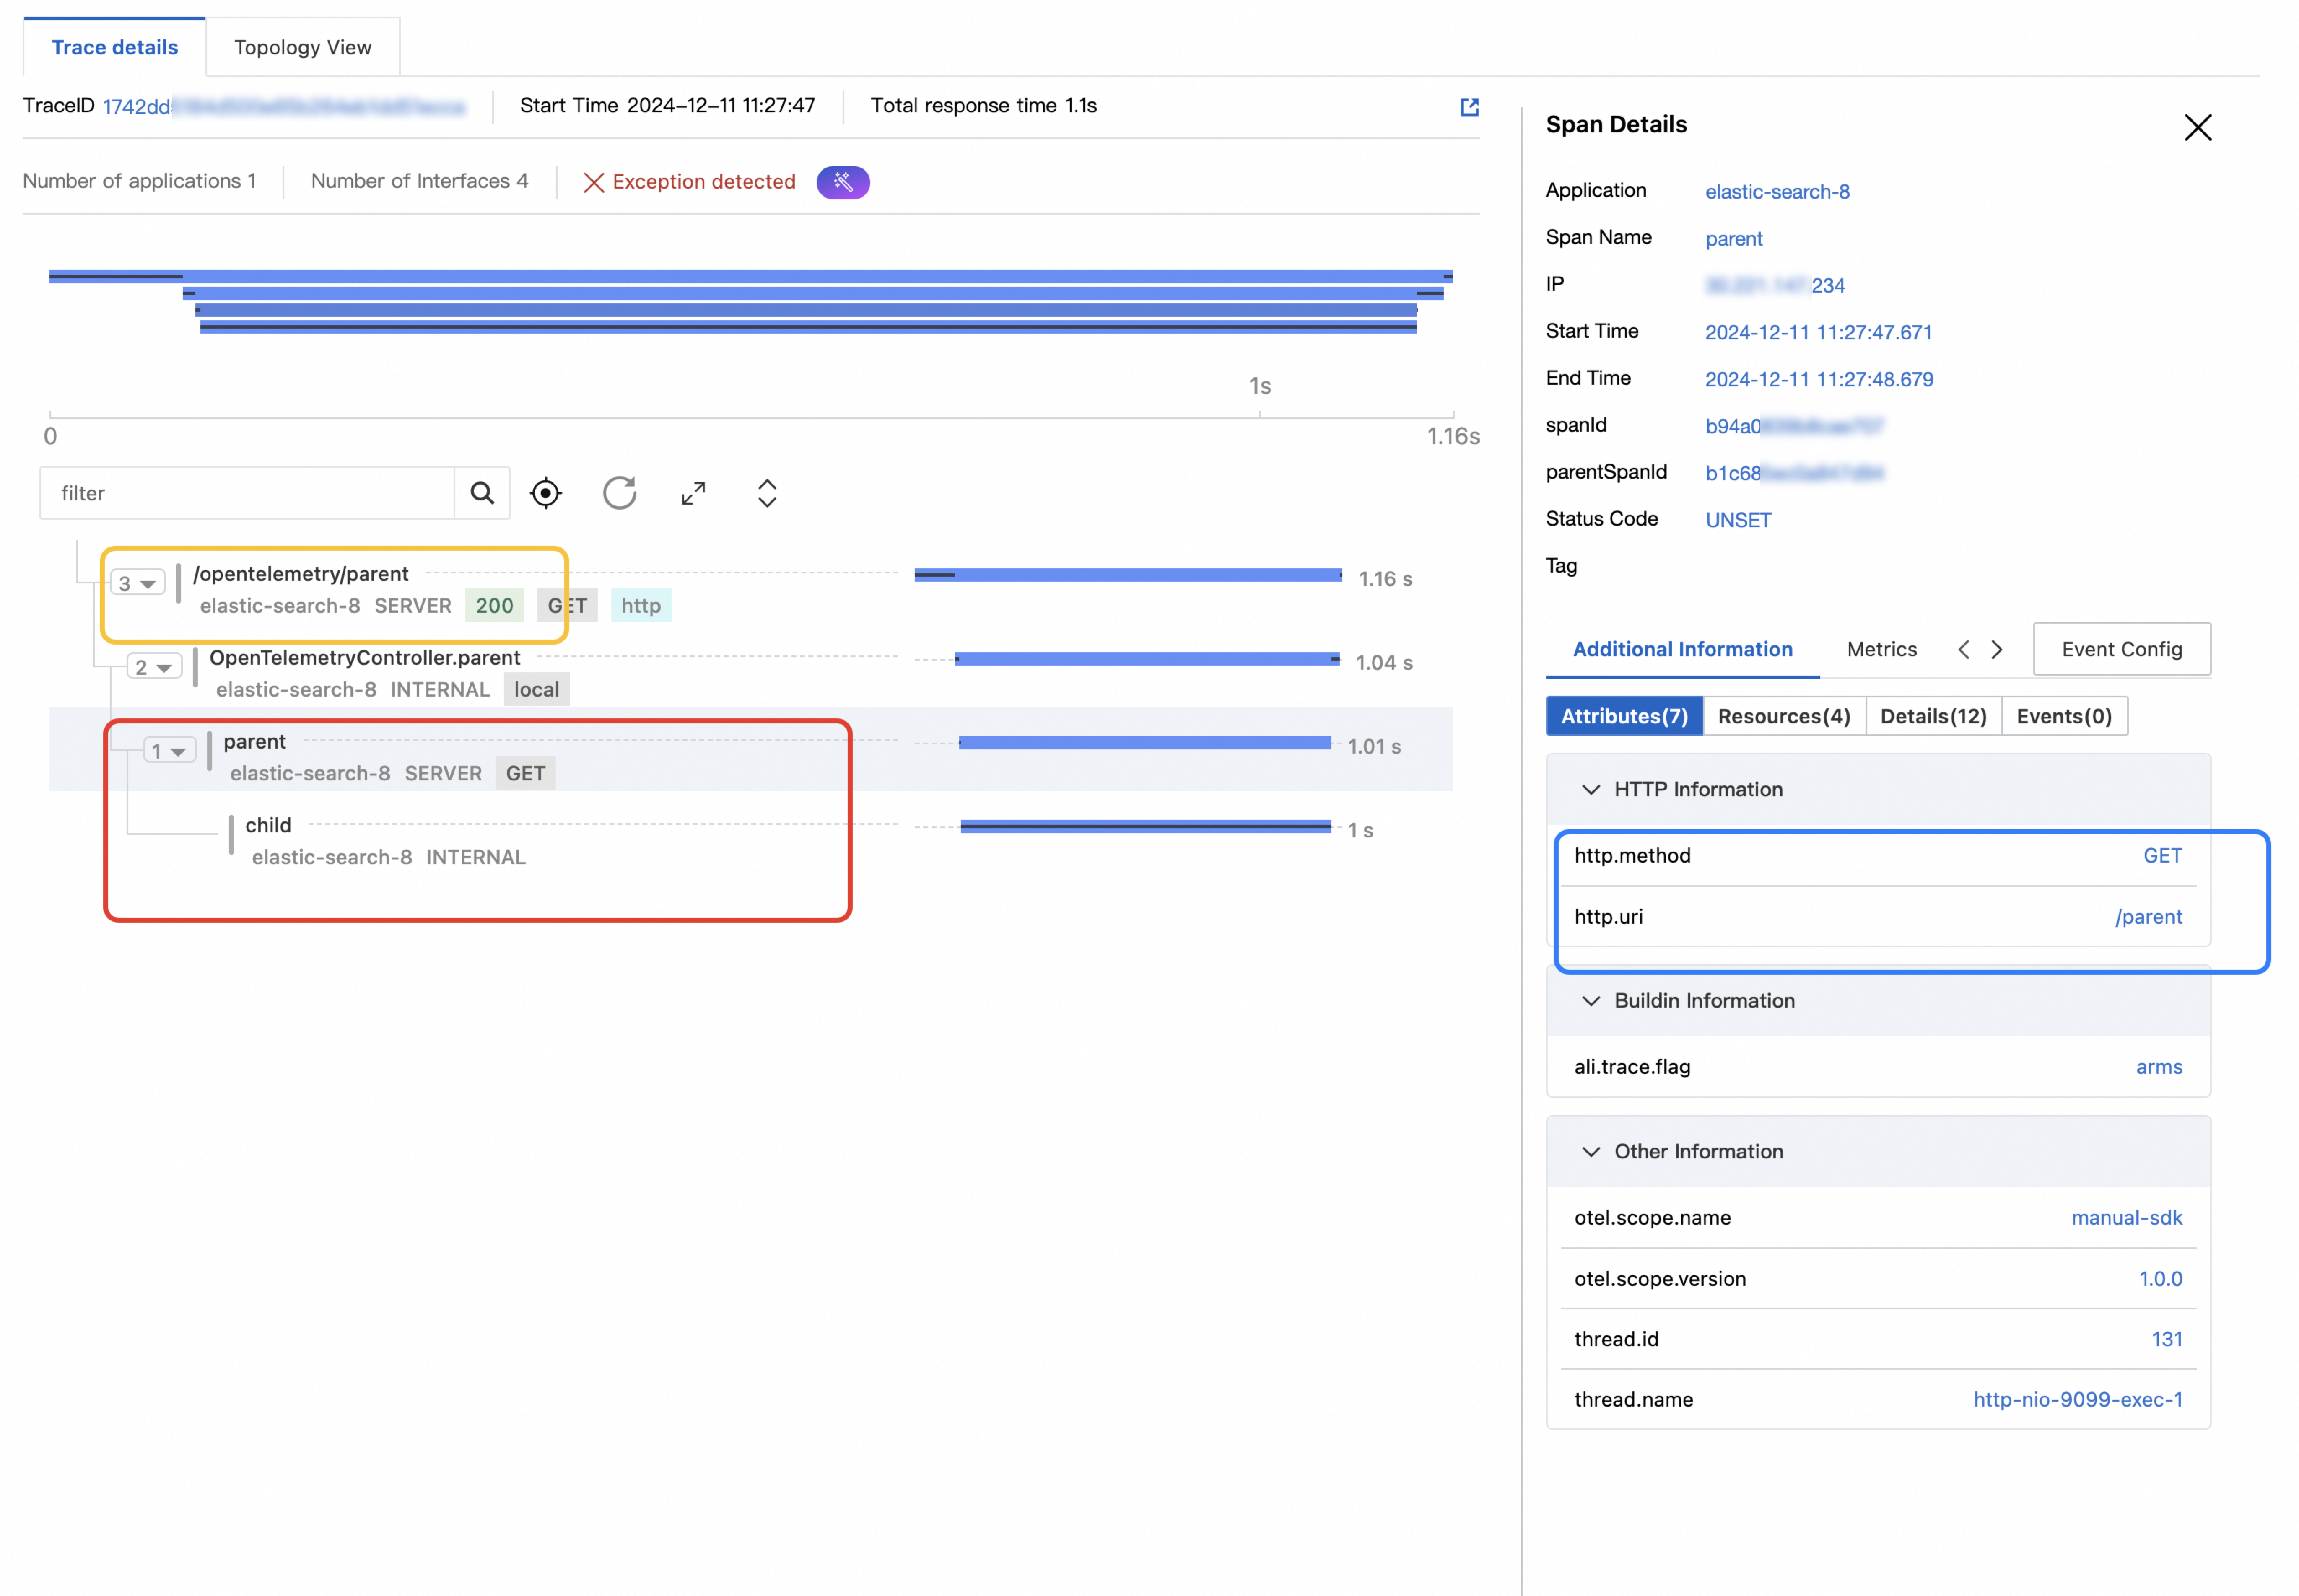
Step 2 and Step 3:
The Spans generated via the OpenTelemetry SDK (indicated by the red box) and the Spans generated by the instrumentation in Tomcat (indicated by the yellow box) are part of the same trace. The Attributes associated with the Spans generated by the OpenTelemetry SDK have been successfully set (indicated by the blue box).
ARMS agent v3.x and later
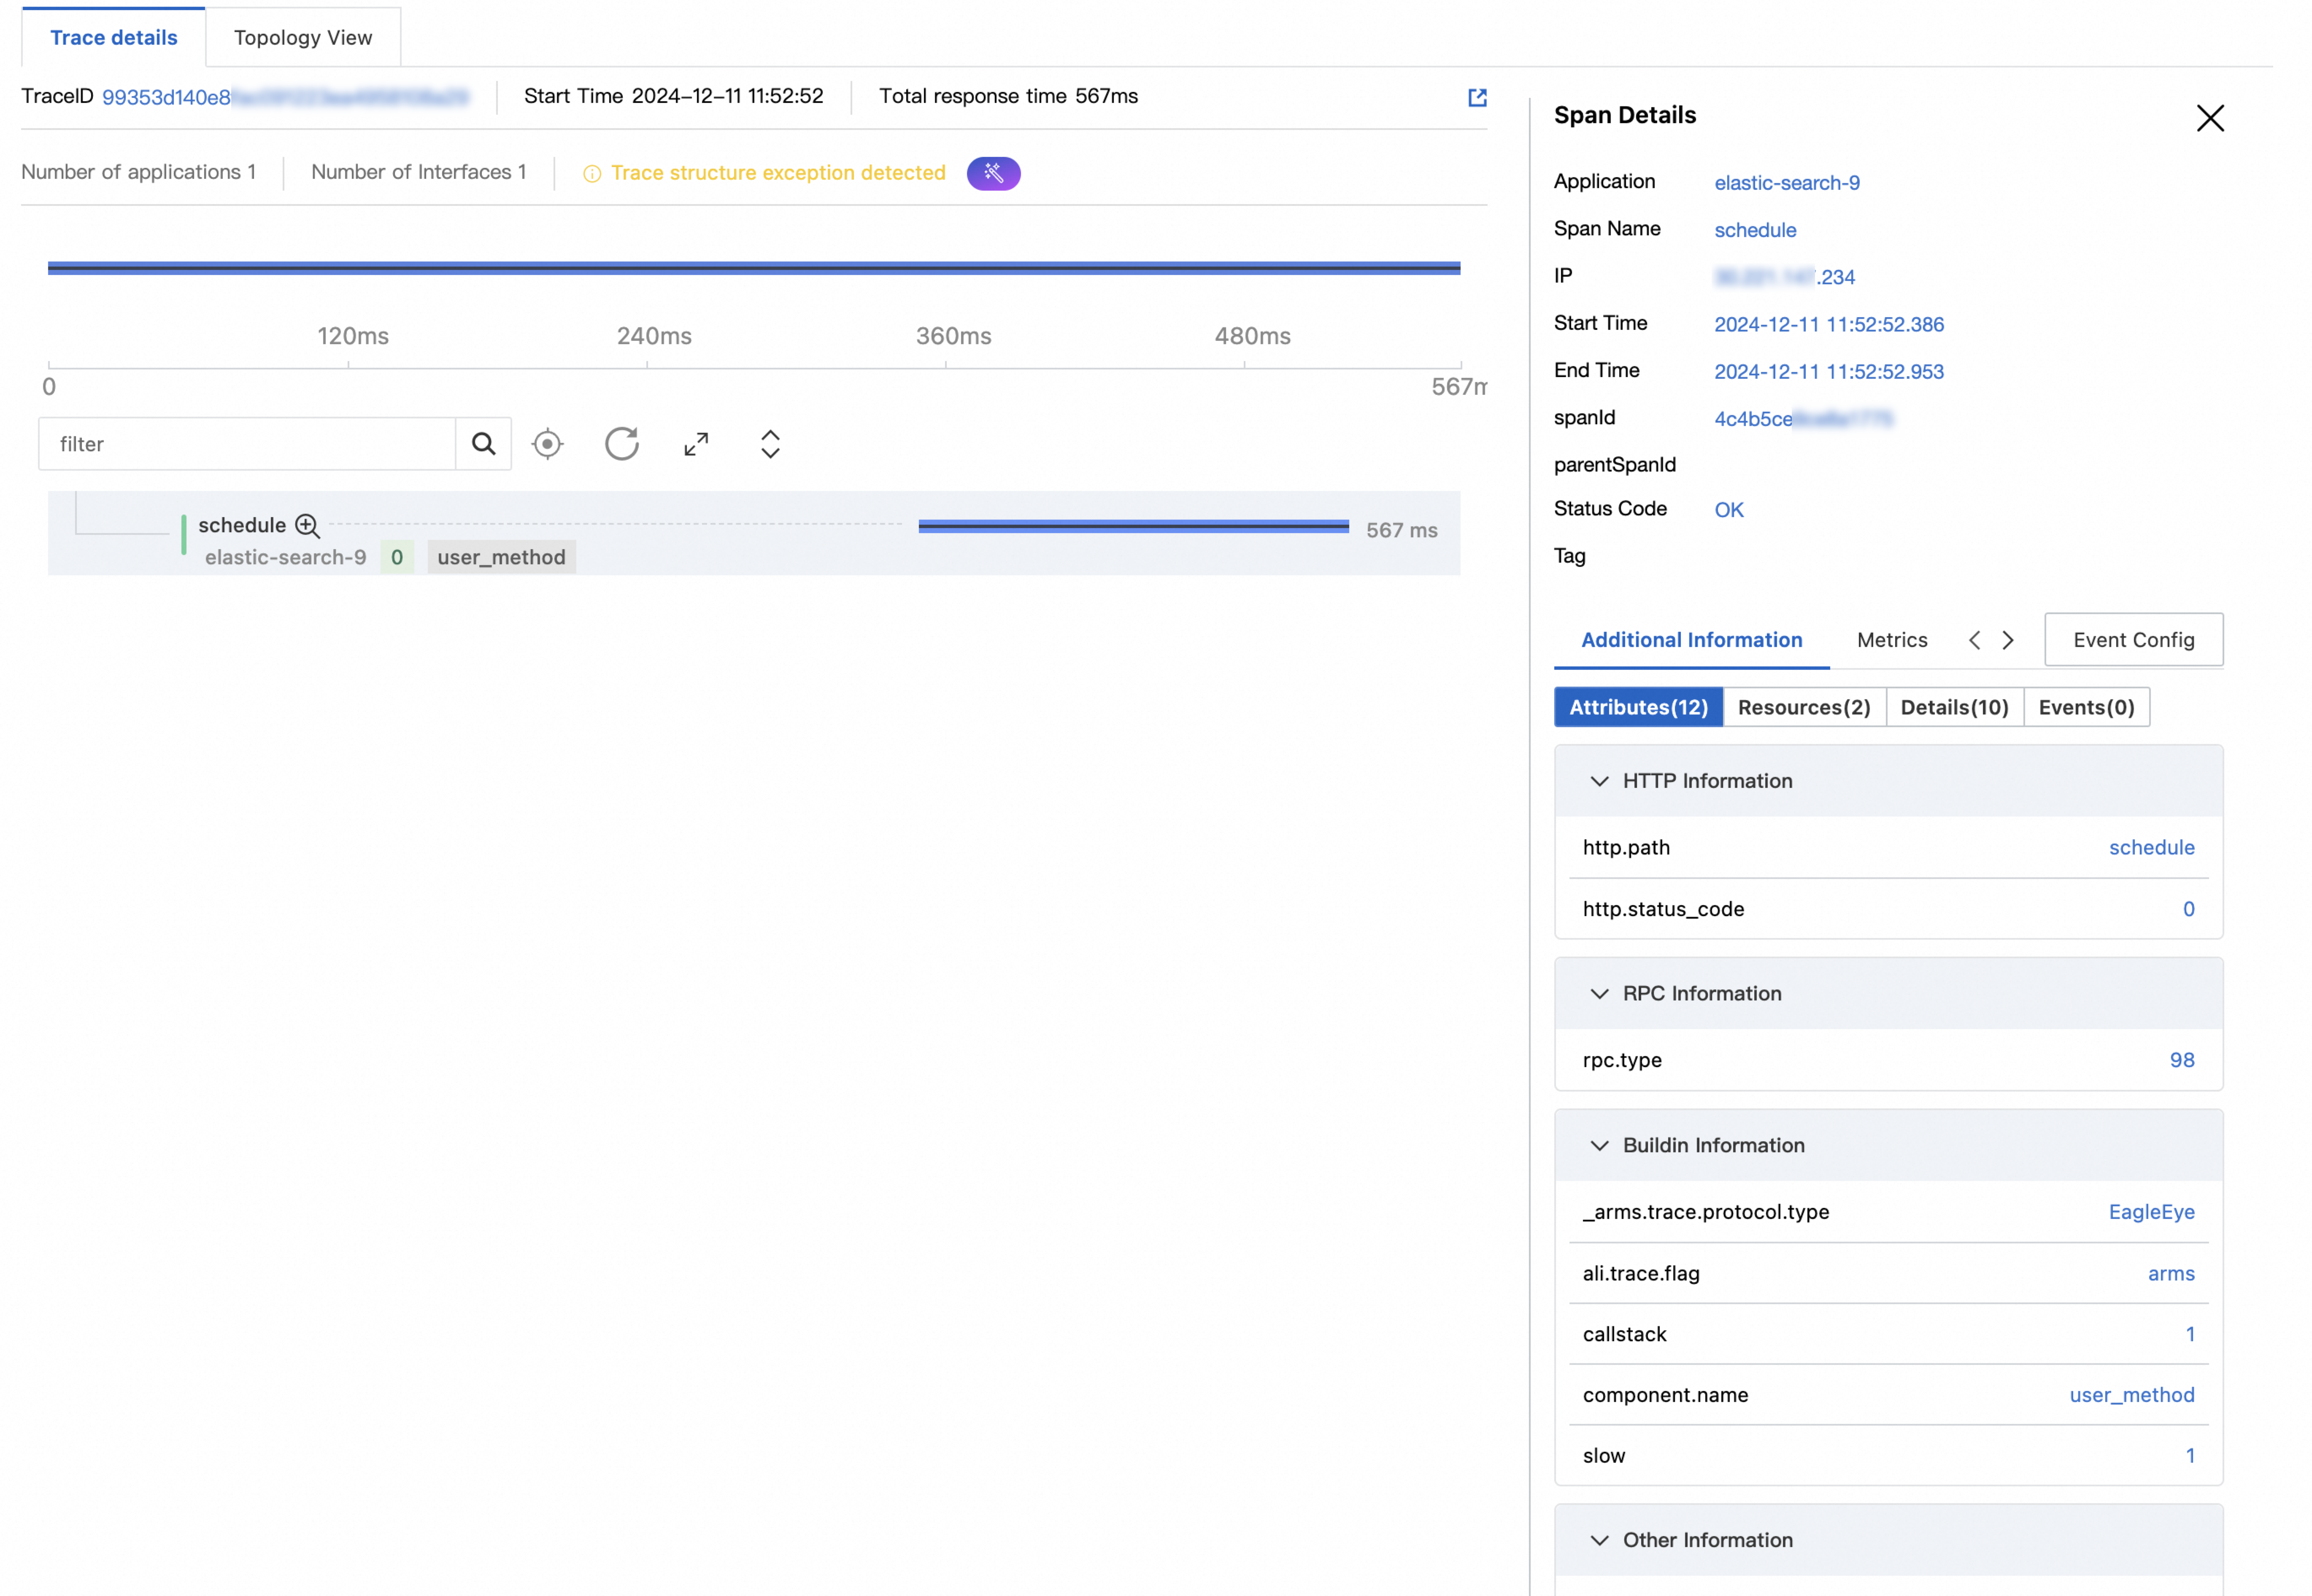
Step 1:
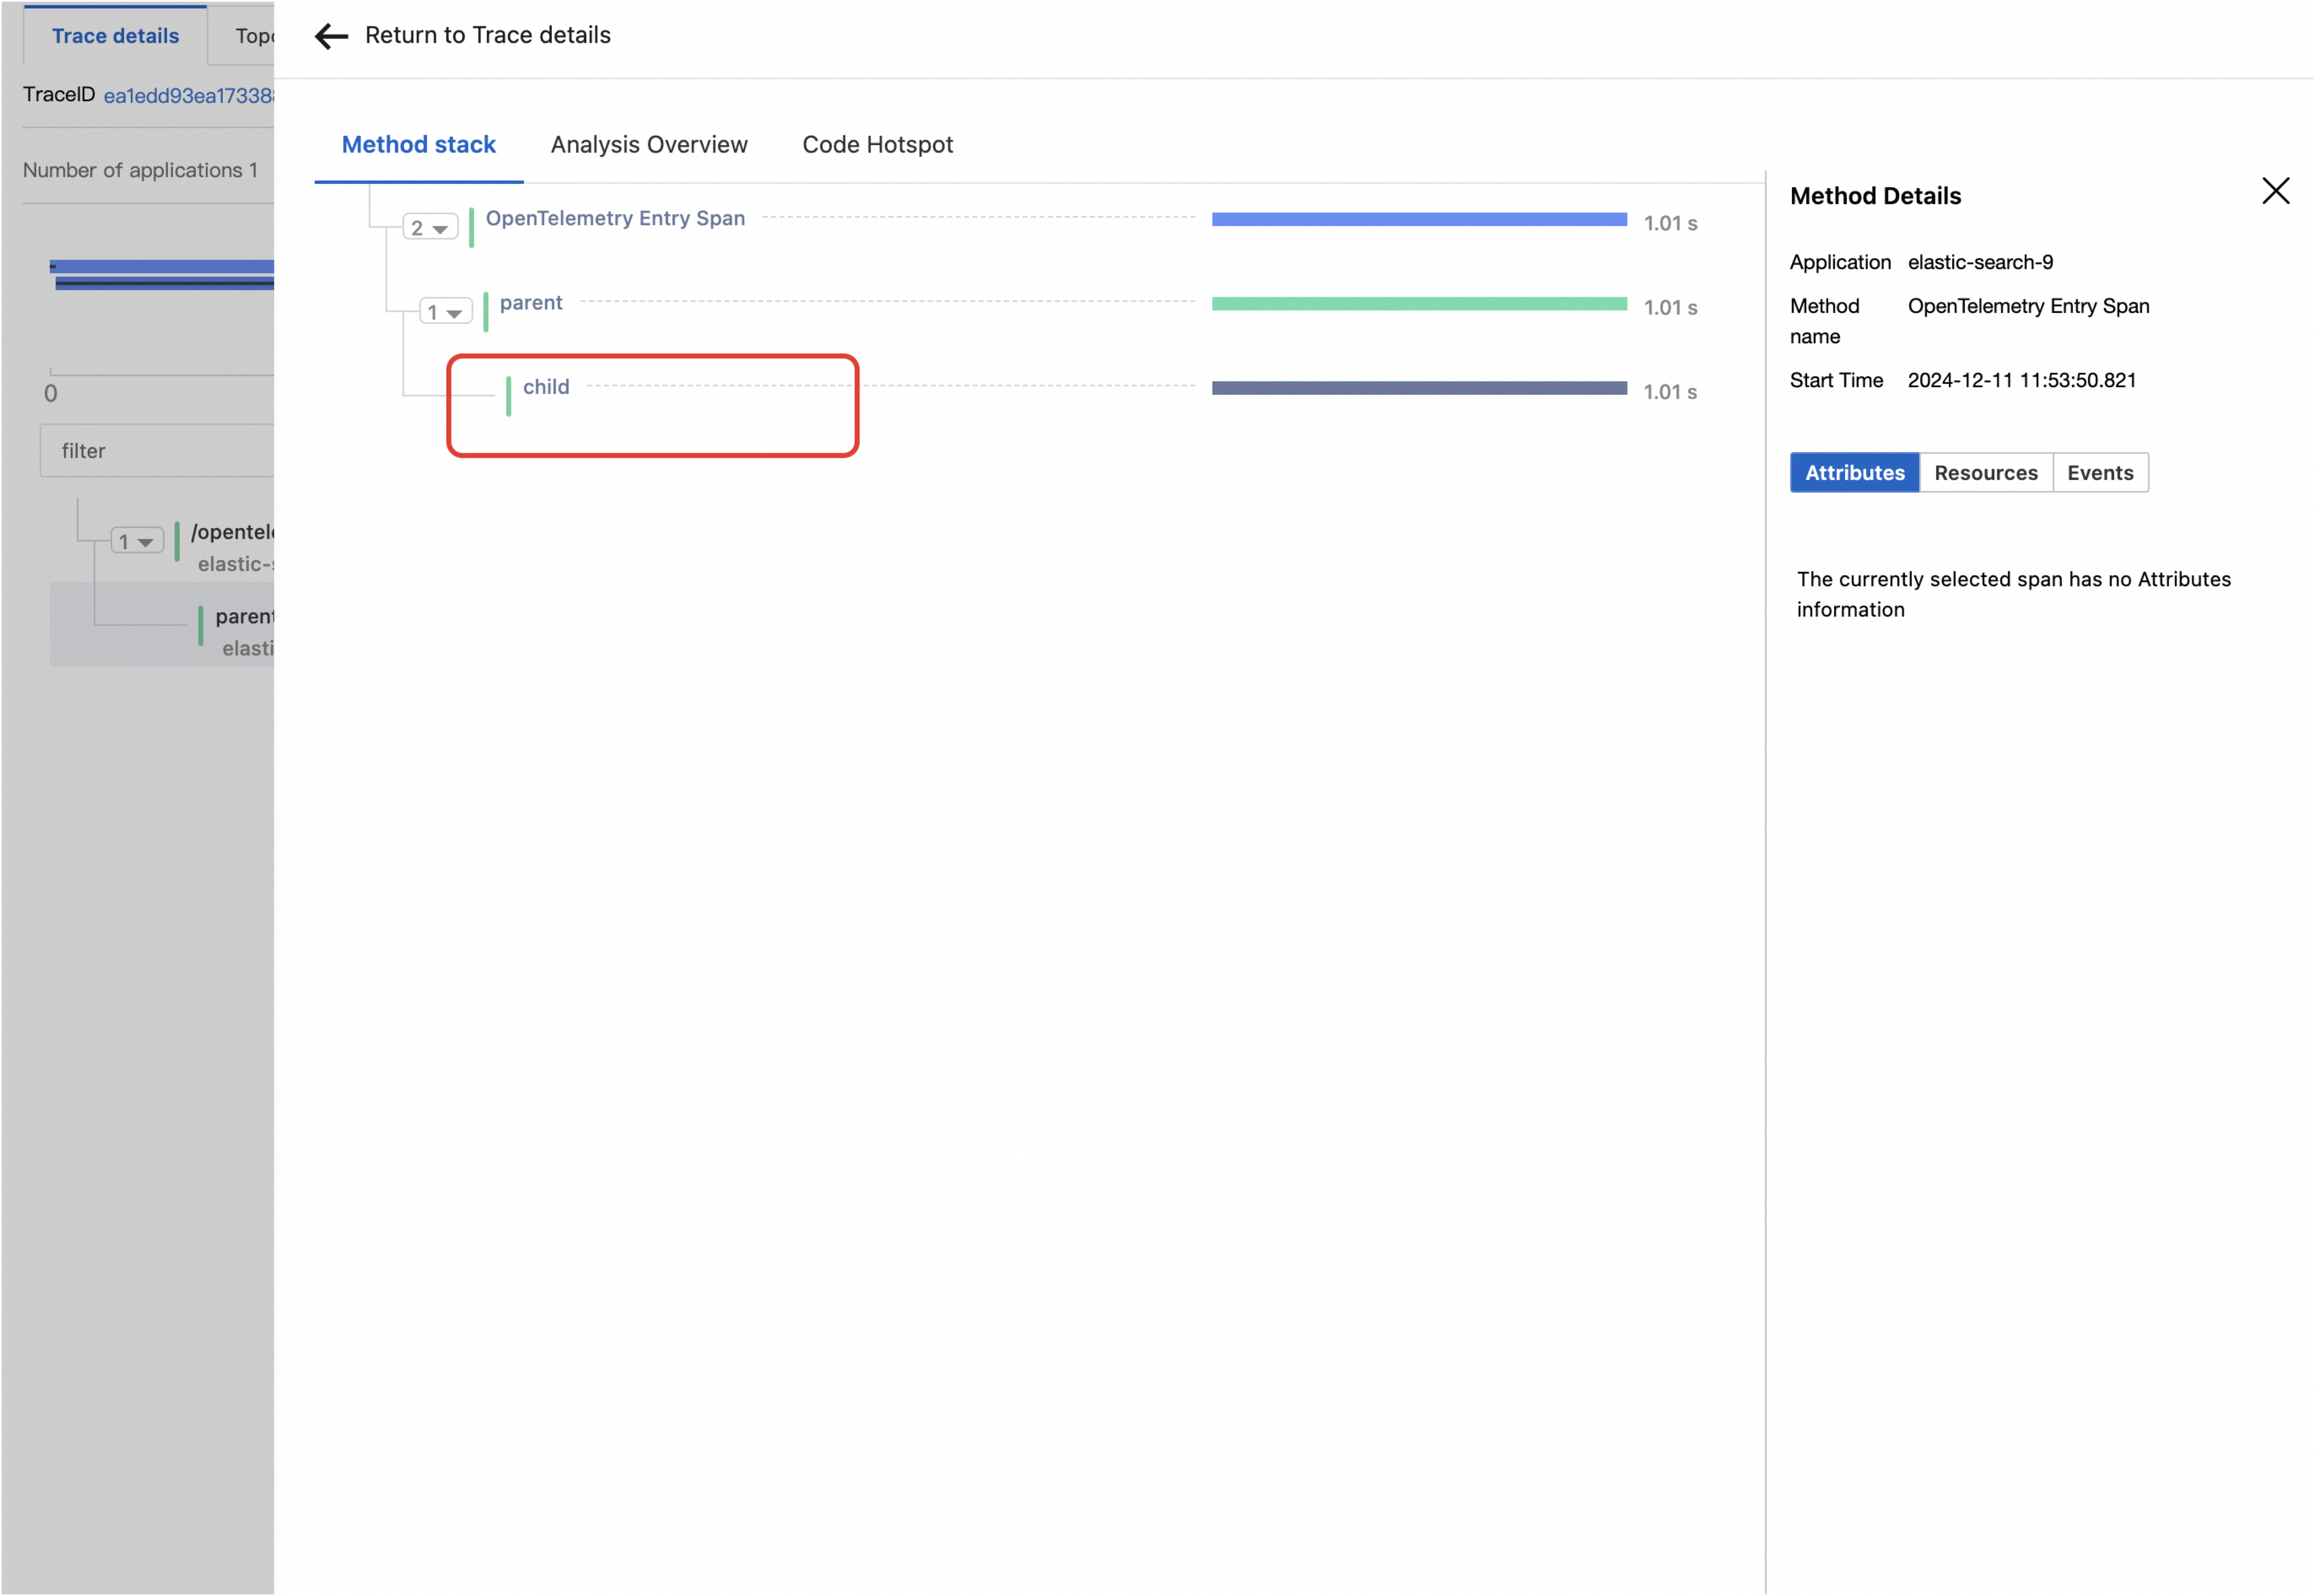
Step 2 and Step 3:
The Spans generated via the OpenTelemetry SDK (indicated by the red box) and the Spans generated by the instrumentation in Tomcat (indicated by the yellow box) are part of the same trace. Among these, the Span named
childexists as a method stack within the Span namedparent. Additionally, the Attributes associated with the Spans generated by the OpenTelemetry SDK have been successfully set (indicated by the blue box).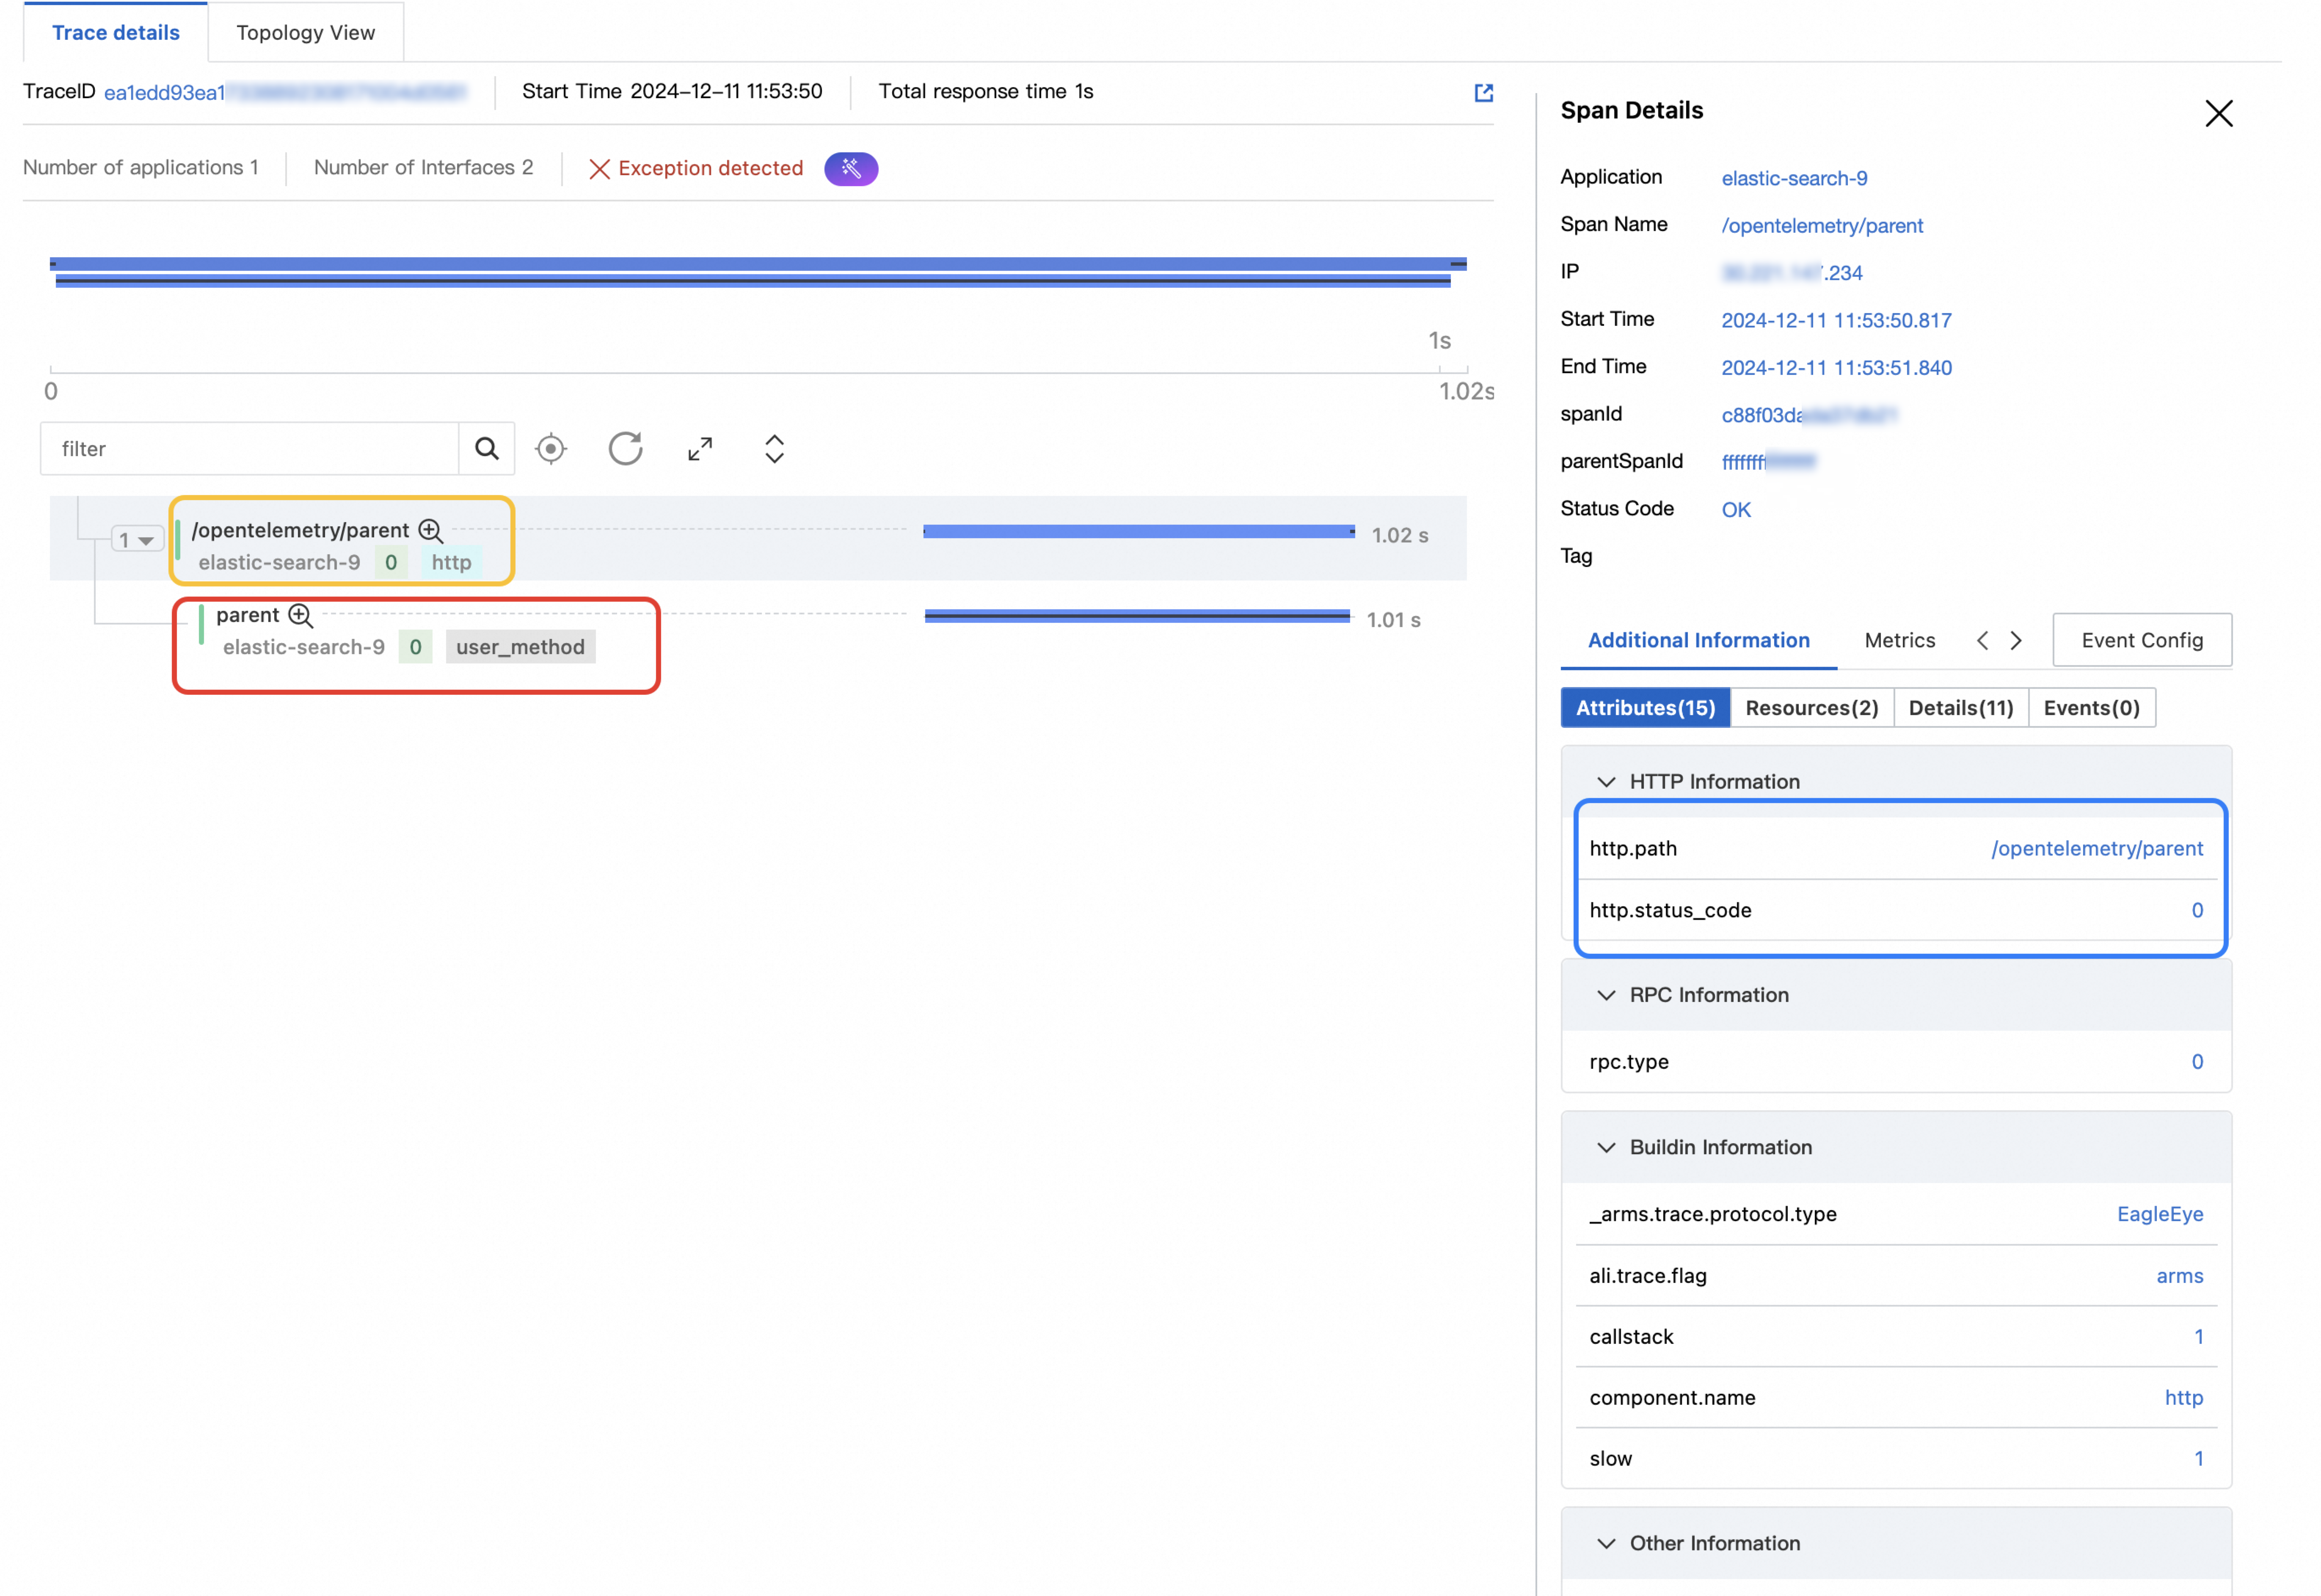
Related step
By associating a trace ID with application business logs, you can quickly access them to identify, analyze, and resolve any errors.