Application Real-Time Monitoring Service (ARMS) allows you to associate trace IDs with the logs of a Java application. This way, if an error occurs in the application, you can access the logs associated with the trace IDs to locate and troubleshoot the error.
Prerequisites
Application Monitoring Basic Edition does not support this feature.
The Application Real-Time Monitoring Service (ARMS) agent is upgraded to V2.6.1.2 or later. For more information, see Update the ARMS agent for Java applications.
Logs are collected by using Simple Log Service. For more information, see Data collection overview.
Background information
In ARMS, trace IDs can be associated with the logs of an application based on the Mapped Diagnostic Context (MDC) mechanism. Mainstream log frameworks such as Log4j, Log4j 2, and Logback are supported.
Procedure
Log on to the ARMS console. In the left-side navigation pane, choose .
Select a region in the top navigation bar and click the application.
NoteIcons in the Language column indicate the application's programming language:
 : Java
 : Go
: Go : Python
- (Hyphen): an application monitored in Managed Service for OpenTelemetry
In the top navigation bar, choose .
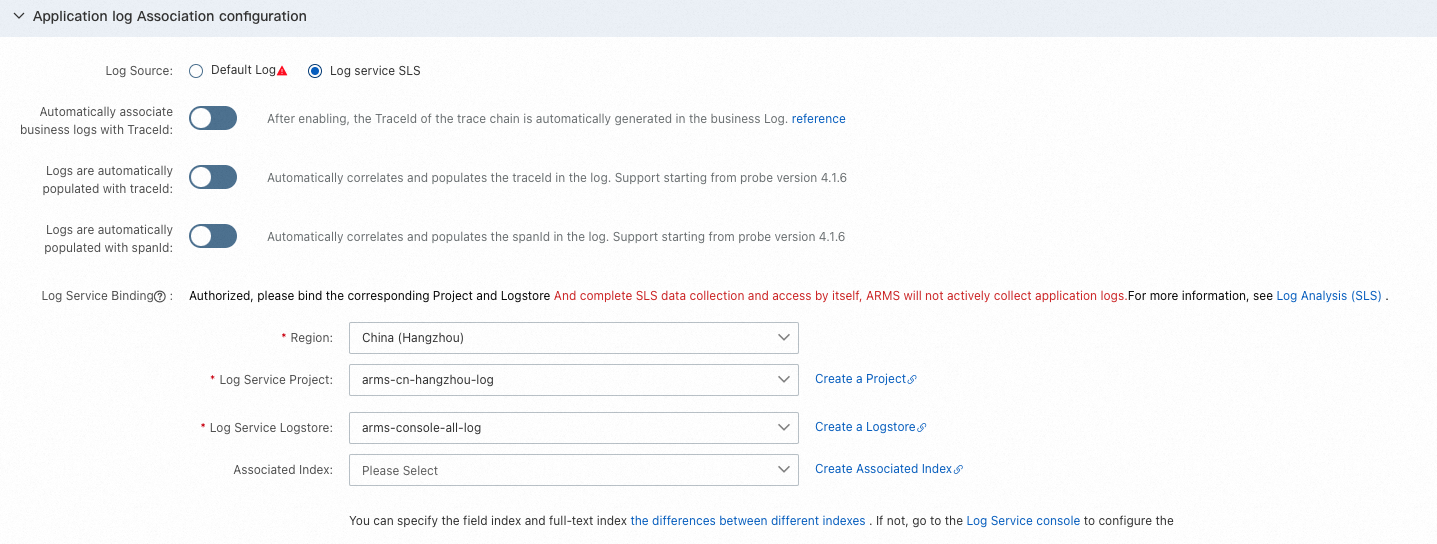
In the Application log Association configuration section of the Custom Configurations tab, set Log Source to Log service SLS. Turn on Automatically associate business logs with TraceId, select the region where your Simple Log Service is deployed, and bind a project and a Logstore.
You can also turn on Logs are automatically populated with traceId and Logs are automatically populated with spanId as required.
 Note
NoteIf you enable Link Business Logs with TraceId, trace IDs are automatically generated in the logs. In this case, ignore Step 5.
For information about how to troubleshoot errors, see Identify business exceptions by analyzing traces and logs.
(Optional) Manually associate the trace ID.
Add
%X{EagleEye-TraceID}to thePatternproperty of the log layout. If you use the SkyWalking protocol, add%X{Skywalking-TraceID}instead.You can also associate a span ID by adding
%X{span_id}.ImportantAssociation of span IDs is supported only by the ARMS agent V4.x and later.
For information about how to obtain
{EagleEye-TraceID}in the code, see ARMS SDKs.
The following examples show how to modify the configuration files of Log4j, Log4j2, and Logback frameworks:
Modify the Log4j configuration file log4j.properties:
log4j.appender.warn.layout=org.apache.log4j.PatternLayout
log4j.appender.warn.layout.ConversionPattern=%-d{yyyy-MM-dd HH:mm:ss}-[%p]-(%C:%L) - traceId:%X{EagleEye-TraceID} - spanId:%X{span_id} - %m%n
Modify the Log4j2 configuration file log4j2.xml:
PatternLayout
<console name="Console" target="SYSTEM_OUT">
    <ThresholdFilter level="INFO" onMatch="ACCEPT" onMismatch="DENY"/>
    <PatternLayout pattern="[%d{HH:mm:ss:SSS}] [%p] - %l - traceId:%X{EagleEye-TraceID} - spanId:%X{span_id} - %m%n"/>
</console>
JsonLayout
<JsonLayout   complete="false" compact="true" eventEol="true"
              properties="false" locationInfo="true"
              includeStacktrace="true" stacktraceAsString="true"
              objectMessageAsJsonObject="true" >
    <KeyValuePair key="EagleEye-TraceID" value="${ctx:EagleEye-TraceID}" />
    <KeyValuePair key="span_id" value="${ctx:span_id}" />
</JsonLayout>
Modify the Logback configuration file logback.xml:
PatternLayout
<encoder class="ch.qos.logback.classic.encoder.PatternLayoutEncoder">
    <pattern>%d{yyyy-MM-dd HH:mm:ss.SSS} [%thread] %-5level %logger{50} - traceId:%X{EagleEye-TraceID} - spanId:%X{span_id} - %msg%n</pattern>
</encoder>
JsonLayout
<encoder class="net.logstash.logback.encoder.LoggingEventCompositeJsonEncoder">
	<providers>
		<timestamp/>
		<threadName/>
		<logLevel/>
		<loggerName/>
		<message/>
		<callerData/>
		<stackTrace/>
		<pattern>
			<pattern>
				{
				"EagleEye-TraceID": "%X{EagleEye-TraceID}",
                                "span_id": "%X{span_id}"
				}
			</pattern>
		</pattern>
	</providers>
</encoder>
Restart the application.
If trace IDs are displayed in the application logs, the logs are associated with the trace IDs, as shown in the following figure.

(Optional) Configure log collection and upload application logs to the project and Logstore.
By default, the ARMS agent for Java does not collect application logs.