When a microservices application throws a business exception, a single error log or a metric spike rarely tells you the full story. You need to correlate metrics, traces, and logs to move from "something is wrong" to "here is the root cause." Application Real-Time Monitoring Service (ARMS) links these three signals in a single console so you can drill down from an anomaly to the exact error in minutes.
This document walks through two troubleshooting workflows:
Start from metrics -- Spot an anomaly in an application metric chart, then drill into the traces and logs from that time window.
Start from an endpoint -- Find a failing interface call, then inspect its trace and correlated business logs.
Both workflows require your business logs to be linked to trace IDs. Complete the setup in Link business logs to trace IDs before you begin troubleshooting.
How metrics, traces, and logs connect
ARMS connects the three pillars of observability so you can move between them without switching tools:
| Signal | What ARMS captures | Role in troubleshooting |
|---|---|---|
| Metrics | Application-level indicators: Application Service Request, Application Service Average Response Time, Application Dependent Service Request | A spike or drop in a metric chart tells you *when* and *where* something went wrong. |
| Traces | Distributed traces that record every interface call and response across services | A trace shows the full call chain and pinpoints the exact span that failed. |
| Logs | Business logs generated by your application code | Logs provide the application-level detail -- error messages, stack traces, business context -- that explains *why* something failed. |
Prerequisites
Before you begin, make sure that you have:
Simple Log Service (SLS) activated
An SLS project
An SLS Logstore
Link business logs to trace IDs
Before ARMS can display business logs alongside traces, configure the log-trace association in your application settings.
Log on to the ARMS console. In the left-side navigation pane, choose Application Monitoring > Applications.
On the Applications page, select a region in the top navigation bar and click the application name.
If the
 icon appears in the Language column, the application is connected to Application Monitoring. If a hyphen (-) appears, the application is connected to Managed Service for OpenTelemetry.
In the left-side navigation pane, click Application Settings. On the page that appears, click the Custom Configuration tab.
In the Log Collect Configuration section, configure the following settings:
Set the log source to Associated Log.
Turn on Link Business Logs with TraceId.
Select the region where your Simple Log Service resources are deployed.
Select the project and Logstore that you created in the prerequisites.
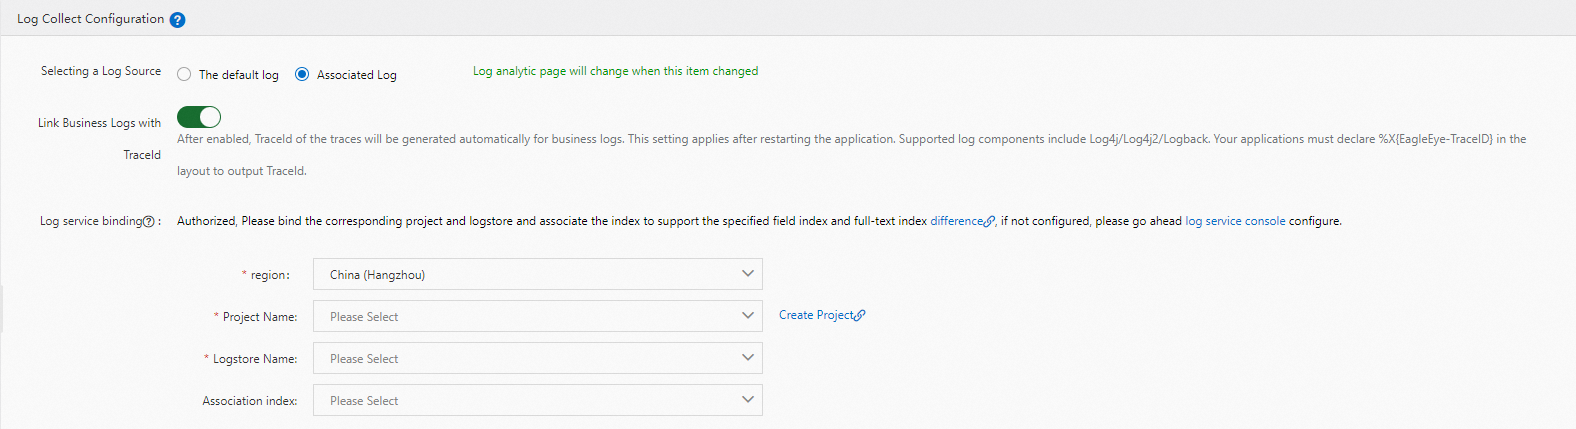
Click Save.
Troubleshoot from application metrics
Use this workflow when a metric chart shows an anomaly -- for example, a sudden spike in average response time -- and you want to trace it back to the root cause.
Log on to the ARMS console. In the left-side navigation pane, choose Application Monitoring > Applications.
On the Applications page, select a region in the top navigation bar and click the application name.
If the
icon appears in the Language column, the application is connected to Application Monitoring. If a hyphen (-) appears, the application is connected to Managed Service for OpenTelemetry.In the left-side navigation pane, click Application Overview. Click the Overview tab and select a time range in the upper-right corner. The Overview tab displays three application metrics: Application Service Request, Application Service Average Response Time, and Application Dependent Service Request.
In the chart of the metric that shows an anomaly, select the time range where the fluctuation occurred. The following example uses the Application Service Average Response Time chart.
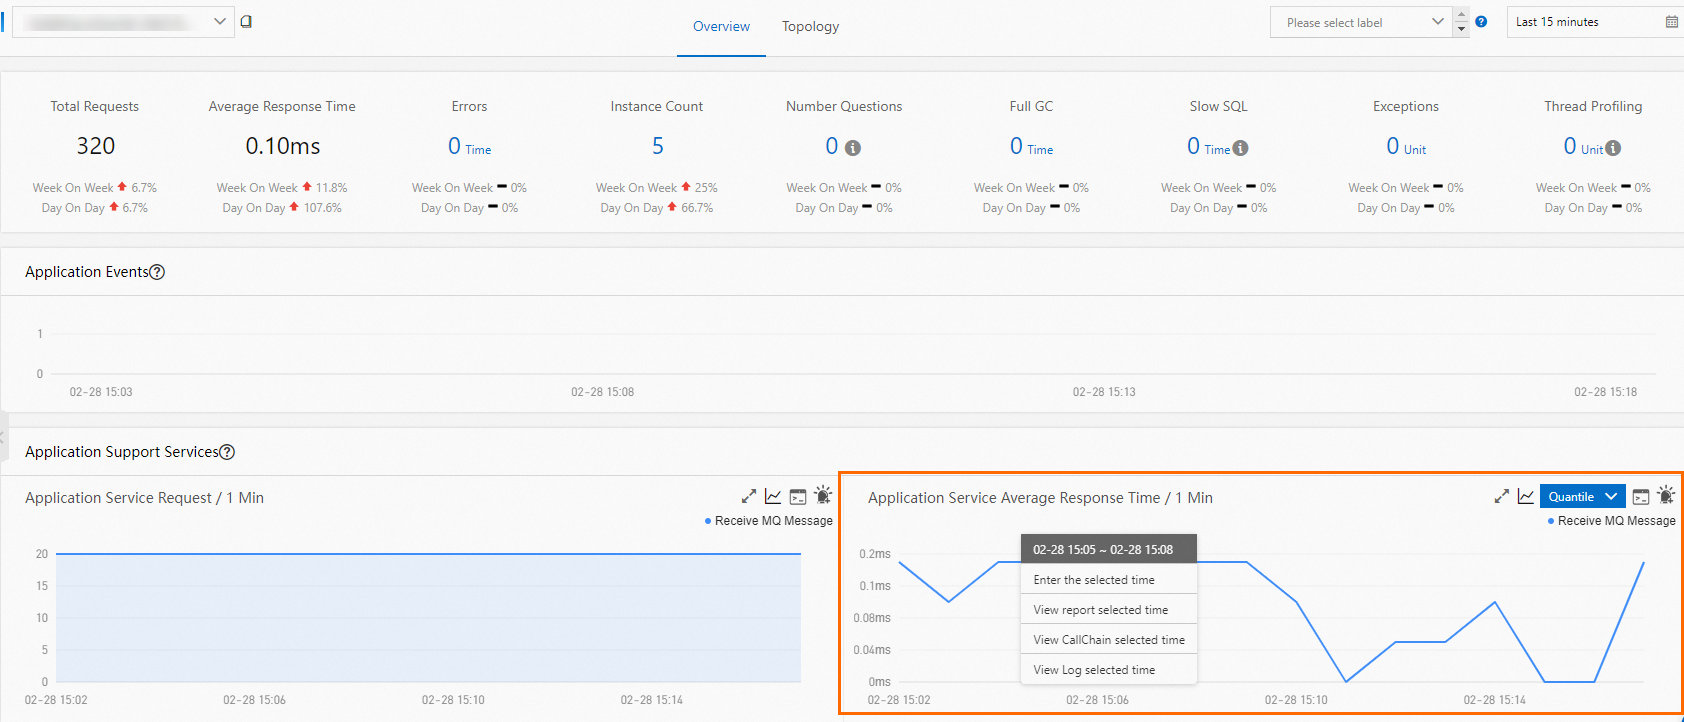
Inspect the traces generated during that time range:
Click View CallChain selected time.
In the panel that appears, find traces with an error status (indicated by the
 icon) and click the trace ID in the TraceId column. To jump directly to the business logs for a specific trace, click View Logs in the Actions column instead.
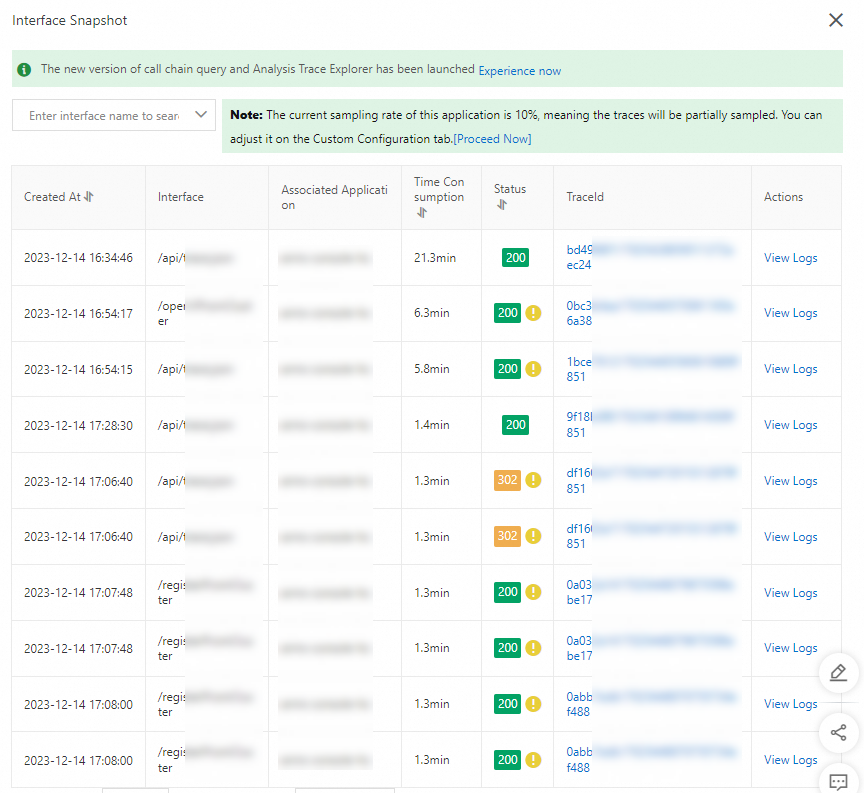
On the Traces tab, click the
 icon in the Details column.
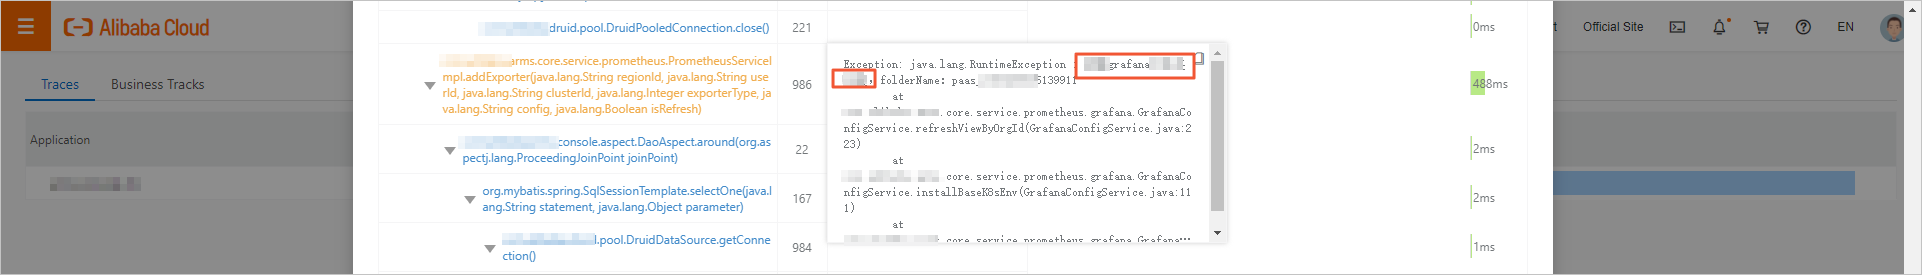
In the Details panel, click the Method Stack tab. Hover over the error message to view the exception details.
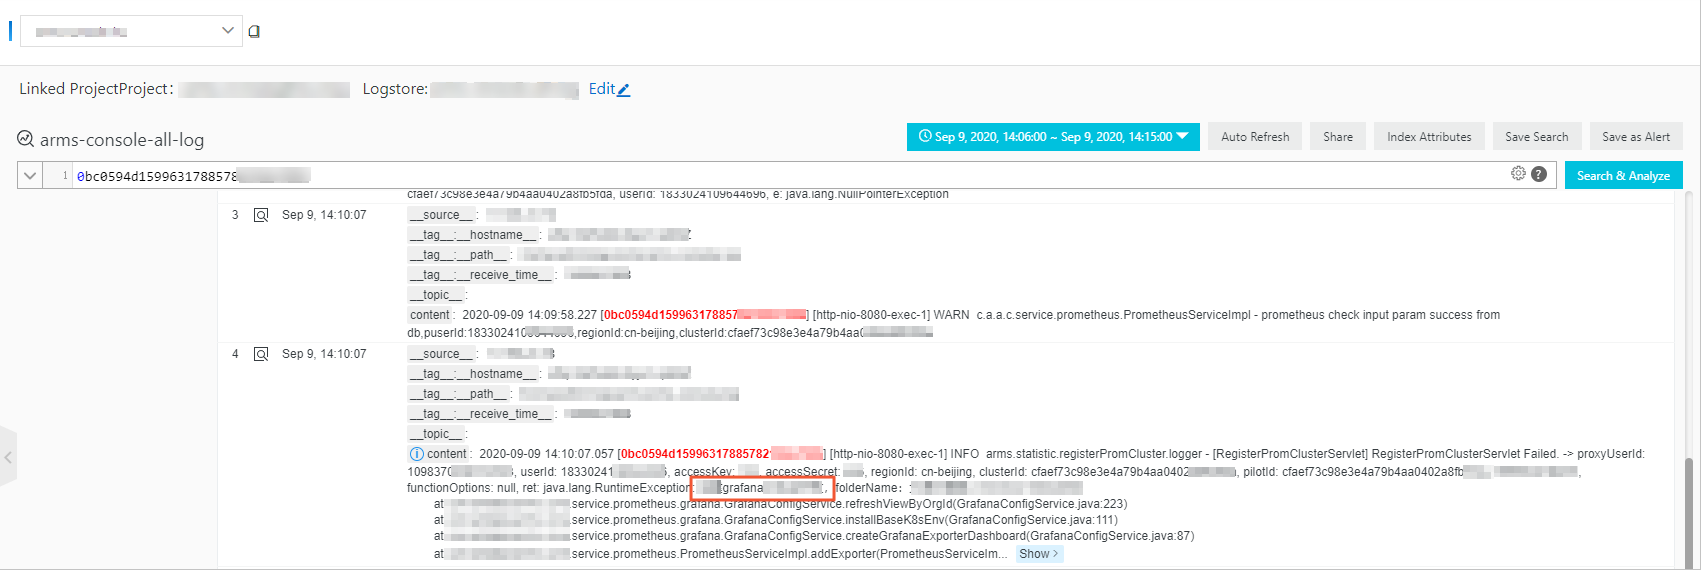
Inspect the business logs generated during the same time range:
Click View Log selected time.
On the log analysis page, locate the error message and identify the root cause of the business exception.
Troubleshoot from interface calls
Use this workflow when you already know which endpoint is failing and want to inspect its traces and logs directly.
Log on to the ARMS console. In the left-side navigation pane, choose Application Monitoring > Applications.
On the Applications page, select a region in the top navigation bar and click the application name.
If the
icon appears in the Language column, the application is connected to Application Monitoring. If a hyphen (-) appears, the application is connected to Managed Service for OpenTelemetry.In the left-side navigation pane, click Interface Invocation.
In the interface list, click the interface to inspect. Then click the Interface Snapshot tab.
Find traces with an error status (indicated by the
icon).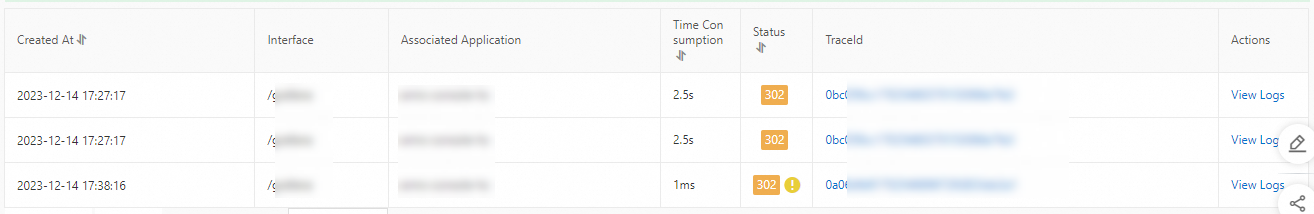
Inspect the trace details:
Click the trace ID in the TraceId column.
On the Traces tab, click the
icon in the Details column.In the Details panel, click the Method Stack tab. Hover over the error message to view the exception details.
Inspect the correlated business logs:
Click View Logs in the Actions column.
On the log analysis page, locate the error message and identify the root cause of the business exception.
Related topics
Create and manage alert rules in Application Monitoring -- Set up alert rules to detect metric anomalies automatically so you can start troubleshooting before users report issues.