ApsaraMQ for RocketMQ integrates with CloudMonitor to provide free, ready-to-use monitoring and alerting. Configure alert rules to detect usage spikes, performance degradation, and messaging exceptions before they cause production incidents.
Each ApsaraMQ for RocketMQ instance edition has a Service Level Agreement (SLA) that defines specification limits such as messaging transactions per second (TPS) and storage capacity. For details, see Limits on instance specifications. Monitoring covers three areas:
Instance usage -- API call volume and bandwidth relative to your specification limits. If usage exceeds the limit, ApsaraMQ for RocketMQ throttles the instance, causing message send and receive failures. Alerts give you time to upgrade before throttling occurs.
Messaging performance -- Per-topic send TPS, per-group receive TPS, message accumulation, and consumption delay. These metrics reveal business-level throughput trends and detect backlogs early.
Messaging exceptions -- Dead-letter message generation and throttling events. These metrics surface consumption logic errors and capacity shortfalls.
Recommended alert rules
The following table lists recommended alerts based on production best practices. For all available metrics, see Metric details and Metrics.
These are baseline recommendations. You can configure additional alerts at finer granularity based on your requirements. For more information, see Monitoring and alerting.
| Category | Metric | When to configure | Who to notify |
|---|---|---|---|
| Resource usage | Send API call count per instance | Immediately after instance creation | Resource O&M engineers |
| Resource usage | Receive API call count per instance | Immediately after instance creation | Resource O&M engineers |
| Resource usage | Internet outbound bandwidth | After enabling Internet access on a non-serverless instance | Resource O&M engineers |
| Messaging performance | Message sending TPS per topic | After business launch | Resource O&M engineers, Business developers |
| Messaging performance | Message receiving TPS per consumer group | After business launch | Resource O&M engineers, Business developers |
| Messaging performance | Message accumulation per consumer group | After business launch | Resource O&M engineers, Business developers |
| Messaging performance | Consumption delay time per consumer group | After business launch | Resource O&M engineers, Business developers |
| Messaging exceptions | Dead-letter message generation | After business launch | Resource O&M engineers, Business developers |
| Messaging exceptions | Throttling event count | Instance-level: after creation. Topic/group-level: after business launch | Resource O&M engineers, Business developers |
Resource usage is an instance-wide metric and is not determined by a single topic or consumer group. Consider the overall instance usage when you set thresholds.
Create an alert rule
Log on to the ApsaraMQ for RocketMQ console. In the left-side navigation pane, click Instances.
In the top navigation bar, select a region, such as China (Hangzhou). On the Instances page, click the name of the instance that you want to manage.
In the left-side navigation pane, click Monitoring and Alerts. In the upper-left corner, click Create Alert Rule.
The following sections cover each recommended alert in detail, including threshold guidance and response steps.
Send and receive API call alerts
Each ApsaraMQ for RocketMQ 5.0 instance has a peak messaging TPS limit. If send or receive API calls exceed this limit, the instance is throttled and messages fail. For TPS limits by edition, see Limits on instance specifications.
Configure these alerts after the instance is created and the send-to-receive TPS ratio is set. To adjust the ratio:
On the Instance Details page, click the Basic Information tab.
In the upper-right corner, click Edit. In the Modify Messaging Request Ratio section of the Modify Configurations panel, adjust the ratio.
Send API call count

Threshold: Set to 70% of the peak send TPS. For example, if the peak is 5,000 TPS, set the threshold to 3,500.
Professional Edition and Enterprise Platinum Edition instances support elastic TPS. If enabled, set the threshold to 70% of the sum of the base peak TPS and the elastic peak TPS.
Serverless instances support adaptive elasticity. If enabled, set the threshold to 70% of the elastic peak TPS.
View both values on the Instance Details page.
When this alert fires:
On the Instance Details page, click the Dashboard tab.
In the Current Limiting Related Indicators section, check the Production TPS Max value curve in Production TPS water level to identify when the threshold was reached.
In the Instance Overview section, check the Rate of messages sent by the producer to the server (bars/minute) chart. Identify the topic with abnormal TPS at the time of the alert and determine whether the traffic change is expected.
If the change is unexpected, contact your users for further analysis.
If the change is expected, the instance specification is insufficient. Upgrade the instance. For more information, see Upgrade or downgrade instance configurations.
Receive API call count

Threshold: Set to 70% of the peak receive TPS. For example, if the peak is 5,000 TPS, set the threshold to 3,500.
Professional Edition and Enterprise Platinum Edition instances support elastic TPS. If enabled, set the threshold to 70% of the sum of the base peak TPS and the elastic peak TPS.
Serverless instances support adaptive elasticity. If enabled, set the threshold to 70% of the elastic peak TPS.
View both values on the Instance Details page.
When this alert fires:
On the Instance Details page, click the Dashboard tab.
In the Current Limiting Related Indicators section, check the Consumption TPS Max value curve in Consumption TPS water level to identify when the threshold was reached.
In the Instance Overview section, check the Rate of messages delivered by the server to the consumer (per minute) chart. Identify the consumer group with abnormal TPS at the time of the alert and determine whether the traffic change is expected.
If the change is unexpected, contact your users for further analysis.
If the change is expected, the instance specification is insufficient. Upgrade the instance. For more information, see Upgrade or downgrade instance configurations.
Per-topic and per-group TPS alerts
ApsaraMQ for RocketMQ provides per-topic and per-consumer-group TPS metrics for business-level throughput monitoring. Without these alerts, traffic drops to zero or unexpected spikes go undetected.
Configure these alerts after your business traffic stabilizes.
Messages sent per minute (by topic)

Threshold: Set based on your steady-state traffic volume after business stabilization.
When this alert fires:
On the Topics page, click the name of the topic configured in the alert rule.
On the Topic Details page, click the Dashboard tab.
Check the Production curve in Message volume (pieces/minute). Determine whether the traffic change is expected based on your business model.
Messages received per minute (by consumer group)

Threshold: Set based on your steady-state traffic volume after business stabilization.
When this alert fires:
On the Groups page, click the ID of the consumer group configured in the alert rule.
On the Group Details page, click the Dashboard tab.
Check the Production rate (bars/min) curve in Trends in message production and consumption rates. Determine whether the traffic change is expected based on your business model.
Internet outbound bandwidth alert
ApsaraMQ for RocketMQ 5.0 instances support Internet access. Outbound bandwidth is capped at your instance specification limit. If usage exceeds the cap, clients experience packet loss, timeouts, or invocation failures.
Configure this alert after you create a non-serverless instance and enable Internet access.
Serverless instances support elastic bandwidth. You do not need to configure Internet outbound bandwidth alerts for serverless instances.

Threshold: Set to 70% of your specification limit. Because the traffic collection tool captures only 50% of actual bandwidth, the effective threshold is 35% of the specification limit.
For example, if your bandwidth limit is 1 MB/s:
Convert to bits/s:
1 MB/s = 1 x 10^6 / 8 bits/s = 125,000 bits/sApply the effective threshold:
125,000 x 0.7 x 0.5 = 43,750 bits/s
View your Internet bandwidth in the Running Information section of the Basic Information tab on the Instance Details page.
When this alert fires:
On the Instance Details page, click the Dashboard tab.
In the Billing Metrics Overview section, check the downlink bandwidth curve in public network downlink traffic bandwidth to identify when the threshold was reached. Make sure the unit matches the alert threshold unit.
In the Instance Overview section, check the Rate of messages sent by the producer to the server (bars/minute) and Rate of messages delivered by the server to the consumer (per minute) charts. Identify the topic or consumer group with abnormal traffic at the time of the alert and determine whether the change is expected.
If the change is unexpected, contact your users for further analysis.
If the change is expected, the instance specification is insufficient. Upgrade the instance. For more information, see Upgrade or downgrade instance configurations.
Message accumulation alert
Message accumulation tracks the count of unconsumed messages in a consumer group. In real-time processing scenarios, a growing backlog can degrade downstream system performance.
Configure this alert after your business traffic stabilizes.
Fluctuation and errors may exist in the statistics about message accumulation. We recommend that you do not set the threshold below 100. If your business is sensitive to even small backlogs, use the consumption delay time alert instead. See the "Consumption delay time alert" section below.

Threshold: Set based on your actual business tolerance for accumulated messages.
When this alert fires:
On the Groups page, click the ID of the consumer group configured in the alert rule.
On the Group Details page, click the Dashboard tab.
Check the Accumulation amount curve in Accumulation related indicators. Analyze the accumulation trend and identify when it started.
Correlate the accumulation start time with business changes and application logs. For more information about how accumulated messages are consumed, see Consumer types.
Based on the root cause, either scale out your consumer application or fix the consumption logic defect.
Consumption delay time alert
Consumption delay time measures how long the oldest unconsumed message in a consumer group has been waiting. It complements the count-based message accumulation metric: accumulation tells you *how many* messages are waiting, while delay time tells you *how long* they have been waiting.
Configure this alert after your business traffic stabilizes.
Consumption delay time is cumulative and sensitive to business changes. When this alert fires, determine whether a small number of messages or all messages are delayed, as the root cause and response differ.

Threshold: Set based on your actual business tolerance for message delay.
When this alert fires:
On the Groups page, click the ID of the consumer group configured in the alert rule.
On the Group Details page, click the Dashboard tab.
Check the Accumulation amount curve in Accumulation related indicators. Analyze the accumulation trend and identify when it started.
Correlate the accumulation start time with business changes and application logs. For more information about how accumulated messages are consumed, see Consumer types.
Based on the root cause, either scale out your consumer application or fix the consumption logic defect.
Throttling event alert
Throttling events indicate that instance traffic has exceeded the specification limit. Frequent throttling means the instance is consistently under-provisioned.
Configure instance-level throttling alerts after the instance is created. Configure topic-level and consumer-group-level throttling alerts after your business traffic stabilizes.
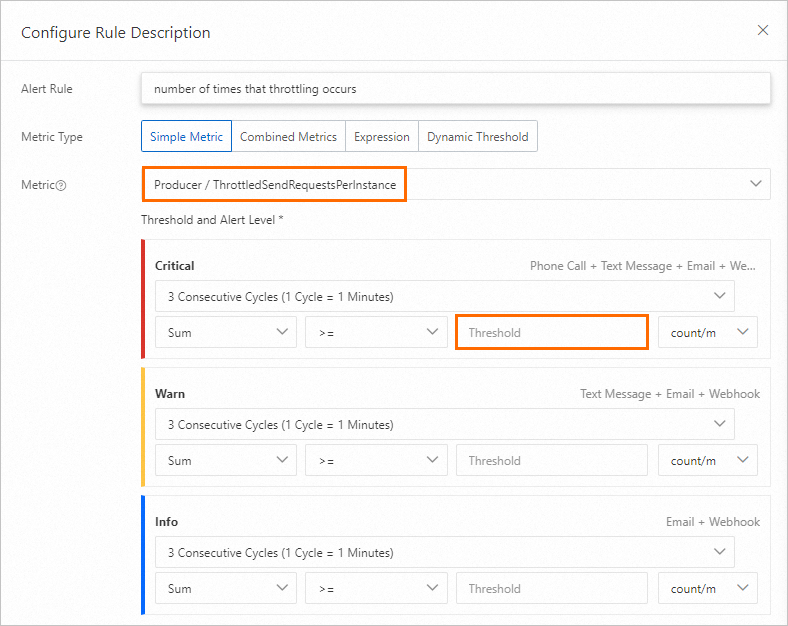
Threshold: Set based on your actual business tolerance for throttling frequency.
When this alert fires:
On the Instance Details page, click the Dashboard tab.
In the Current Limiting Related Indicators section, check the Restricted Request Distribution (Production) chart. Identify when throttling occurred and find any patterns.
In the Instance Overview section, check the Rate of messages sent by the producer to the server (bars/minute) chart. Identify the topic with abnormal traffic at the time of throttling and determine whether the traffic increase is expected.
If the increase is expected, upgrade the instance. If not, troubleshoot the root cause of the traffic spike.