ApsaraMQ for RocketMQ provides a dashboard feature that leverages the metric storage and display capabilities of Alibaba Cloud ARMS Prometheus Service and Grafana. This feature provides comprehensive and multi-dimensional metric monitoring and data collection to help you quickly understand the status of your business. This topic describes the common scenarios, background information, metric details, billing, and query methods for the dashboard feature.
Scenarios
Scenario 1: Online message consumption is abnormal, and messages are not processed promptly. You need to receive alerts and quickly locate the problem.
Scenario 2: The status of some online orders is abnormal. You need to check whether messages are sent correctly through the corresponding message link.
Scenario 3: You need to analyze message traffic trends, distribution characteristics, or message volume for business trend analysis and planning.
Scenario 4: You need to view and analyze the dependency topology of upstream and downstream applications for architecture upgrades or optimization.
Business background
In the message sending and receiving flow of ApsaraMQ for RocketMQ, factors such as the message backlog in queues, buffering status, and the time taken for each message processing stage directly reflect the current service processing performance and server-side operational status. Therefore, the key metrics for ApsaraMQ for RocketMQ are primarily related to the following scenarios.
Message accumulation scenario
The following figure shows the status of messages in a queue of a specified topic.
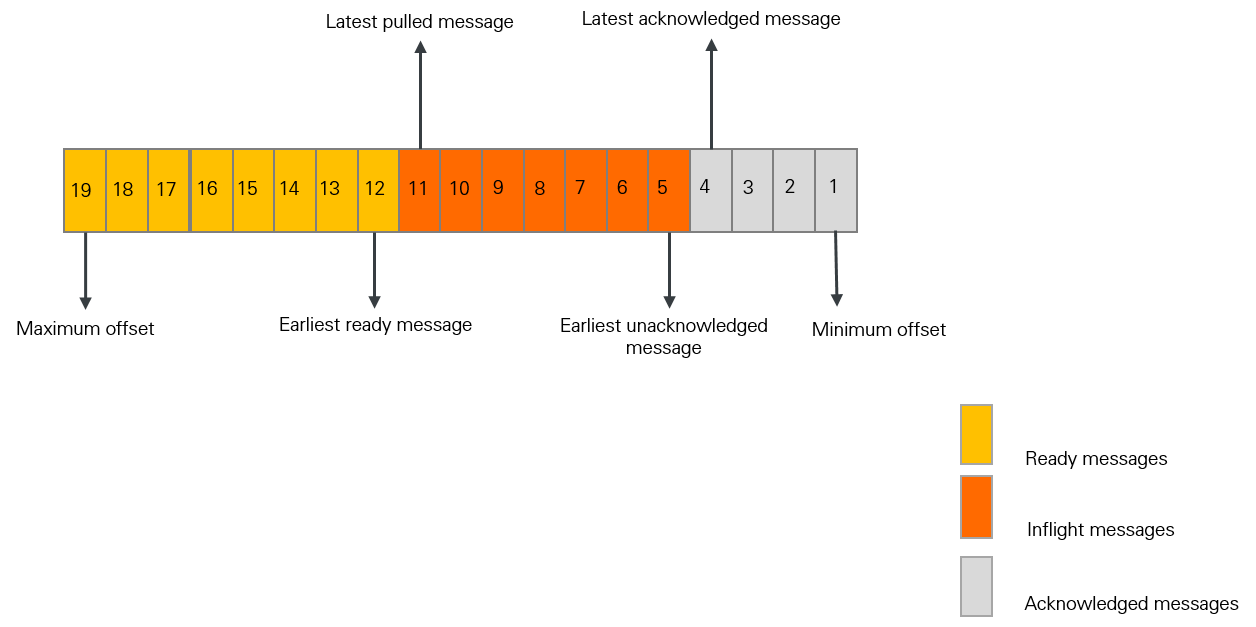
ApsaraMQ for RocketMQ collects statistics on the number of messages and the time taken at different processing stages. These metrics directly reflect the message processing rate and backlog in the queue. By observing these metrics, you can determine whether your service consumption is abnormal. The following section describes the meaning of these metrics and the formulas that are used to calculate them:
Category | Metric | Definition | Calculation formula |
Message count metrics | Inflight messages | A message that is being processed by a consumer client, but the client has not yet returned the consumption result. | Offset of the latest pulled message - Offset of the latest submitted message |
Ready messages | A message that is ready on the ApsaraMQ for RocketMQ server. The message is visible to consumers and available for consumption. | Maximum message offset - Offset of the latest pulled message | |
Consumer lag | The total number of unprocessed messages. | Inflight message count + Ready message count | |
Message duration metrics | Ready time of the ready message |
| Not applicable |
Ready message queue time | The age of the earliest ready message. This value indicates how promptly consumers pull messages. | Current time minus the ready time of the earliest ready message | |
Consumer lag time | The time elapsed since the oldest message awaiting a response became ready. This value indicates how promptly the consumer processes messages. | Current time - Ready time of the oldest message awaiting a response |
PushConsumer consumption scenario
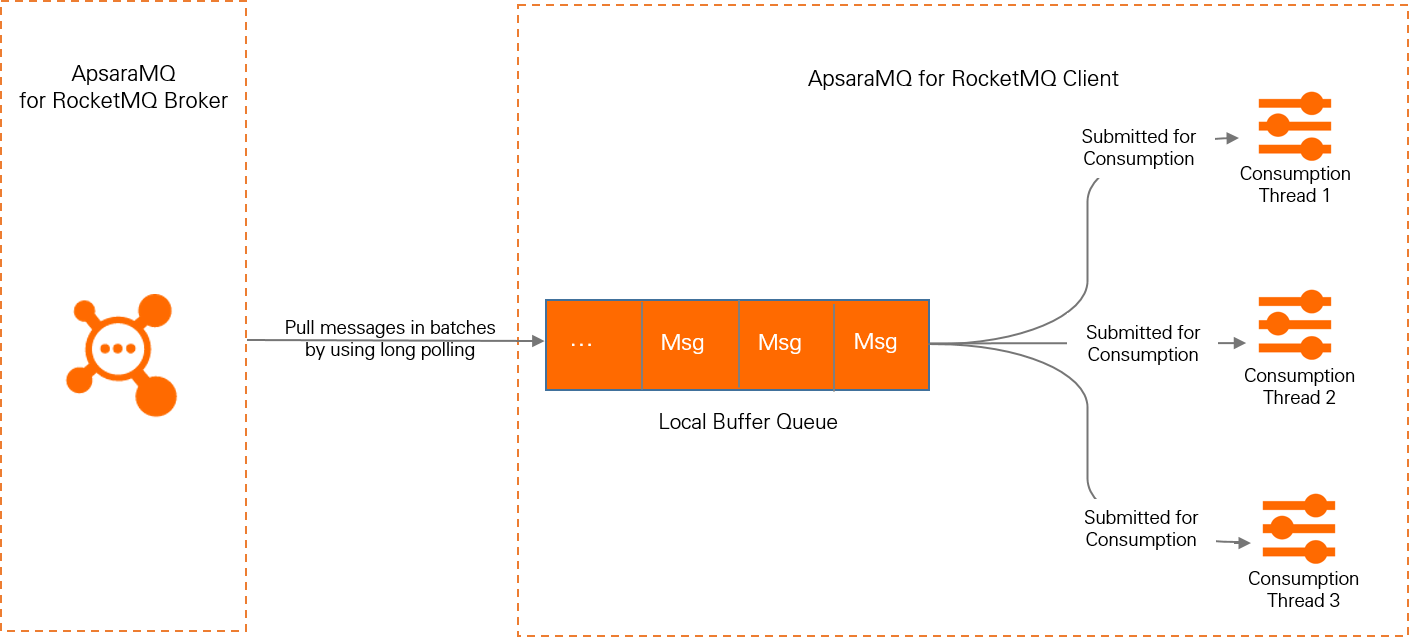
For PushConsumer, real-time message processing is based on the typical Reactor thread model of the SDK. The SDK has a built-in long polling thread, which pulls messages and stores the messages to a queue. Then, the messages are delivered from the queue to individual message consumption threads. The message listener behaves based on the message consumption logic. The following figure shows the message consumption process of PushConsumer consumers.
For more information, see PushConsumer.
In the PushConsumer consumption scenario, the metrics related to the local cache queue are as follows:
Number of messages in the local cache queue: The total number of messages stored in the local cache queue.
Size of messages in the local cache queue: The total size of all messages stored in the local cache queue.
Message wait time: The duration a message is stored in the local cache queue before consumption.
Metric details
The values of metrics related to messaging transactions per second (TPS), messaging API calls, or message volume are calculated based on a normal message with a size of 4 KB. Multipliers are applied for messages that are larger than the base size or that use advanced features. For more information about the calculation rules, see Calculation Specifications.
The fields in the metrics are described as follows:
Field | Value |
Metric type |
|
label |
|
Server-side metrics
Metric type | Metric name | Unit | Metric description | Label |
Gauge | rocketmq_instance_requests_max | count/s | The maximum transactions per second (TPS) for messages sent and received by the instance. This value excludes throttled requests. The value is the maximum of 60 samples taken once per second over a 1 minute period. |
|
Gauge | rocketmq_instance_requests_in_max | counts/second | The maximum transactions per second (TPS) for messages sent from the instance. This value excludes throttled requests. The value is the maximum of 60 samples taken once per second over a 1 minute period. |
|
Gauge | rocketmq_instance_requests_out_max | counts/s | The maximum transactions per second (TPS) for message consumption on the instance. This value excludes throttled requests. The value is the maximum of 60 samples taken once per second over a 1 minute period. |
|
Gauge | rocketmq_topic_requests_max | counts/s | The maximum number of transactions per second (TPS) for messages sent from an instance to a topic. Throttled requests are not included. The value is the maximum of 60 samples taken once per second over a 1 minute period. |
|
Gauge | rocketmq_group_requests_max | count/s | The maximum transactions per second (TPS) for message consumption by a consumer group in the instance. This value does not include throttled requests. The value is the maximum of 60 samples taken once per second over a 1 minute period. |
|
Gauge | rocketmq_instance_requests_in_threshold | counts/s | The rate limiting threshold for sending instance messages. |
|
Gauge | rocketmq_instance_requests_out_threshold | counts per second | The throttling threshold for instance message consumption. |
|
Gauge | rocketmq_throttled_requests_in | count | The number of throttled message sends. |
|
Gauge | rocketmq_throttled_requests_out | count | The number of times message consumption is throttled. |
|
Gauge | rocketmq_instance_elastic_requests_max | count/s | Maximum elastic transactions per second (TPS) for messages on the instance. |
|
Counter | rocketmq_requests_in_total | count | Number of calls to message sending APIs. |
|
Counter | rocketmq_requests_out_total | count | Number of API calls for message consumption. |
|
Counter | rocketmq_messages_in_total | message | The number of messages that the producer sends to the server. |
|
Counter | rocketmq_messages_out_total | Message | The number of messages that the service delivers to the consumer. This count includes messages that the consumer is processing, has successfully processed, or failed to process. |
|
Counter | rocketmq_throughput_in_total | byte | The throughput of messages that the producer sends to the service. |
|
Counter | rocketmq_throughput_out_total | byte | The throughput of messages delivered from the service to consumers. The message count includes messages that are being processed, have been successfully processed, and have failed. |
|
Counter | rocketmq_internet_throughput_out_total | byte | Downstream Internet traffic for sending and receiving messages. |
|
Histogram | rocketmq_message_size | byte | The size distribution of successfully sent messages. The size ranges are as follows:
|
|
Gauge | rocketmq_consumer_ready_messages | message | The number of ready messages. These are messages on the service that are ready for consumers to process. This metric shows the number of messages that consumers have not yet started processing. |
|
Gauge | rocketmq_consumer_inflight_messages | message | Number of inflight messages. The total number of messages that consumer clients are processing, but have not yet returned a consumption result for. |
|
Gauge | rocketmq_consumer_queueing_latency | ms | Ready message queuing time. The amount of time the oldest ready message has been waiting in the queue. This time indicates how promptly consumers pull messages. |
|
Gauge | rocketmq_consumer_lag_latency | ms | Consumer processing latency. The amount of time the oldest unconsumed message has been ready. This shows how quickly the consumer processes messages. |
|
Counter | rocketmq_send_to_dlq_messages | message | The number of messages that become dead letters per minute. A message becomes a dead letter when it is not delivered after the maximum number of redelivery attempts. Based on the group's dead-letter policy configuration, these messages are saved to a specified topic or discarded. |
|
Gauge | rocketmq_storage_size | byte | The size of the storage space used by the instance. This includes the size of all files. |
|
Producer metrics
Metric type | Metric name | Unit | Metric description | Label |
Histogram | rocketmq_send_cost_time | ms | The latency distribution for successful calls to the message sending API. The distribution intervals are as follows:
|
|
Consumer metrics
Metric type | Metric name | Unit | Metric description | Label |
Histogram | rocketmq_process_time | ms | The distribution of message processing time for a PushConsumer. This includes both successful and failed messages.
The distribution intervals are as follows:
|
|
Gauge | rocketmq_consumer_cached_messages | message | The number of messages in the PushConsumer's local buffer queue. |
|
Gauge | rocketmq_consumer_cached_bytes | byte | The total size of messages in the PushConsumer local buffer queue. |
|
Histogram | rocketmq_await_time | ms | The distribution of the time that messages wait in the local PushConsumer buffer queue.
The distribution intervals are as follows:
|
|
Billing
The dashboard metrics for ApsaraMQ for RocketMQ are considered basic metrics in Alibaba Cloud ARMS Prometheus Service. Basic metrics are free of charge. Therefore, the dashboard feature is free to use.
For more information, see Metric details and Pay-as-you-go.
Prerequisites
Create a service-linked role.
Role Name: AliyunServiceRoleForOns
Policy Name: AliyunServiceRolePolicyForOns
Permissions: Allows ApsaraMQ for RocketMQ to use this role to access your CloudMonitor and ARMS services to enable monitoring, alerting, and dashboard features.
For more information, see Service-linked Role.
View the dashboard
In ApsaraMQ for RocketMQ, you can view the dashboard from the following locations:
Dashboard page: You can view the metrics for all topics and groups in the instance.
Instance Details page: Displays producer overview information, billing-related metrics, and throttling-related metrics for the specified instance.
Topic Details page: Displays production-related metrics and producer client-related metrics for the specified topic.
Group Details page: Displays metrics about the message backlog and consumer clients for a specified group.
Log on to the ApsaraMQ for RocketMQ console. In the left-side navigation pane, click Instances.
In the top navigation bar, select a region, such as China (Hangzhou). On the Instances page, click the name of the instance that you want to manage.
Use one of the following methods to view the dashboard.
Instance Details page: On the Instance Details page, click the Dashboard tab.
Dashboard page: In the navigation pane on the left, click Dashboard.
Topic Details page: In the navigation pane on the left, click Topics. In the topic list, click the target topic name. On the Topic Details page, click the Dashboard tab.
Group Details page: In the navigation pane on the left, click Groups. In the group list, click the name of the target group. Then, on the Group Details page, click the Dashboard tab.
Dashboard FAQ
How do I get dashboard metric data?
Use your Alibaba Cloud account to log on to the ARMS console.
In the navigation pane on the left, click Integration Center.
On the Integration Center page, enter
RocketMQin the search text box and click the search icon.In the search results, select the Alibaba Cloud service that you want to integrate, such as Alibaba Cloud RocketMQ (5.0) Service. For more information about the integration steps, see Step 1: Integrate monitoring data of an Alibaba Cloud service.
After the provisioning is successful, click Provisioning in the navigation pane on the left.
On the Provisioning page, click the Cloud Service Region Environment tab.
In the Cloud Service Region Environment list, click the target environment name to open the Cloud Service Environment Details page.
On the Component Management tab, in the Basic Information area, click the cloud service region next to Prometheus Instance.
On the Settings tab, you can obtain different data access methods.
How do I integrate dashboard metric data into a self-managed Grafana?
All metrics data for ApsaraMQ for RocketMQ is stored in your Managed Service for Prometheus. Follow the steps in How do I obtain dashboard metric data? to connect to the Alibaba Cloud service and retrieve the environment name and HTTP API address. You can then use the API to integrate the dashboard metrics data of ApsaraMQ for RocketMQ into your self-managed Grafana. For more information, see Integrate Prometheus data into Grafana or a self-managed application using an HTTP API address.
How do I understand the TPS Max value of an instance?
TPS Max value: The statistical period is 1 minute. A sample is taken every second, and the result is the maximum of these 60 sample values.
Here is an example:
Assume that an instance produces 60 messages in 1 minute. All messages are normal messages, and each is 4 KB in size. The production rate of the instance is 60 messages per minute.
If these 60 messages are sent in the first second, the TPS of the instance for each second in that minute is 60, 0, 0, ..., 0.
Instance TPS Max value = 60 TPS.
If 40 of these 60 messages are sent in the first second and 20 are sent in the second second, the TPS of the instance for each second in that minute is 40, 20, 0, 0, ..., 0.
Instance TPS Max value = 40 TPS.