Service level objectives (SLOs) let you set measurable availability targets for your applications and receive alerts when error budget burns too fast. By defining SLOs in Service Mesh (ASM), you track the ratio of failed requests to total requests over a rolling time window and get notified at different severity levels before users notice degradation.
Key concepts
| Term | Definition |
|---|---|
| Service level indicator (SLI) | A metric that measures service reliability. In ASM, the default SLI tracks the ratio of failed requests (5xx and 429 responses) to total requests. |
| Service level objective (SLO) | A target percentage for an SLI over a rolling time window, such as 99% availability over 30 days. |
| Error budget | The acceptable amount of unreliability derived from an SLO target. A 99% SLO allows a 1% error budget. |
| Burn rate | How fast the error budget is consumed. A burn rate of 1 means the budget will be exhausted exactly at the end of the time window. Higher values trigger alerts. |
For a full explanation of SLO concepts in ASM, see SLO overview.
Prerequisites
Before you begin, make sure you have:
An ASM instance of v1.15.3 or later with a The cluster is added to the ASM instance.
Step 1: Deploy the sample application
This tutorial uses the HTTPBin application as an example. If you already have an application deployed in your mesh, skip to Step 3.
Create a file named
httpbin.yamlwith the following content:Connect to the ACK cluster with kubectl and deploy the application: For instructions on connecting with kubectl, see Obtain the kubeconfig file of a cluster and use kubectl to connect to the cluster.
kubectl apply -f httpbin.yaml
Step 2: Create a virtual service and an Istio gateway
Create a file named
httpbin-gateway.yamlwith the following content:Connect to the ASM instance with kubectl and deploy the gateway and virtual service: For instructions on connecting to the ASM control plane, see Use kubectl on the control plane to access Istio resources.
kubectl apply -f httpbin-gateway.yamlVerify the deployment by opening
http://<ingress-gateway-ip>in your browser. If the HTTPBin page loads, the application is running. To find your ingress gateway IP, see Use Istio resources to route traffic to different versions of a service.
Step 3: Create an SLO
This example creates an SLO for the HTTPBin service in the default namespace with the following settings:
| Parameter | Value | Description |
|---|---|---|
| Duration | 30 days | Rolling time window for the SLO |
| Plugin type | availability | SLI based on request success rate |
| Objective | 99% | Target availability percentage |
| Alert levels | Page, Ticket | Page for urgent issues, Ticket for non-urgent |
Log on to the ASM console. In the left-side navigation pane, choose Service Mesh > Mesh Management.
On the Mesh Management page, click the name of your ASM instance. In the left-side navigation pane, choose Observability Management Center > SLO Configuration.
Select the default namespace from the Namespace drop-down list. In the httpbin service row, click Create in the Actions column.
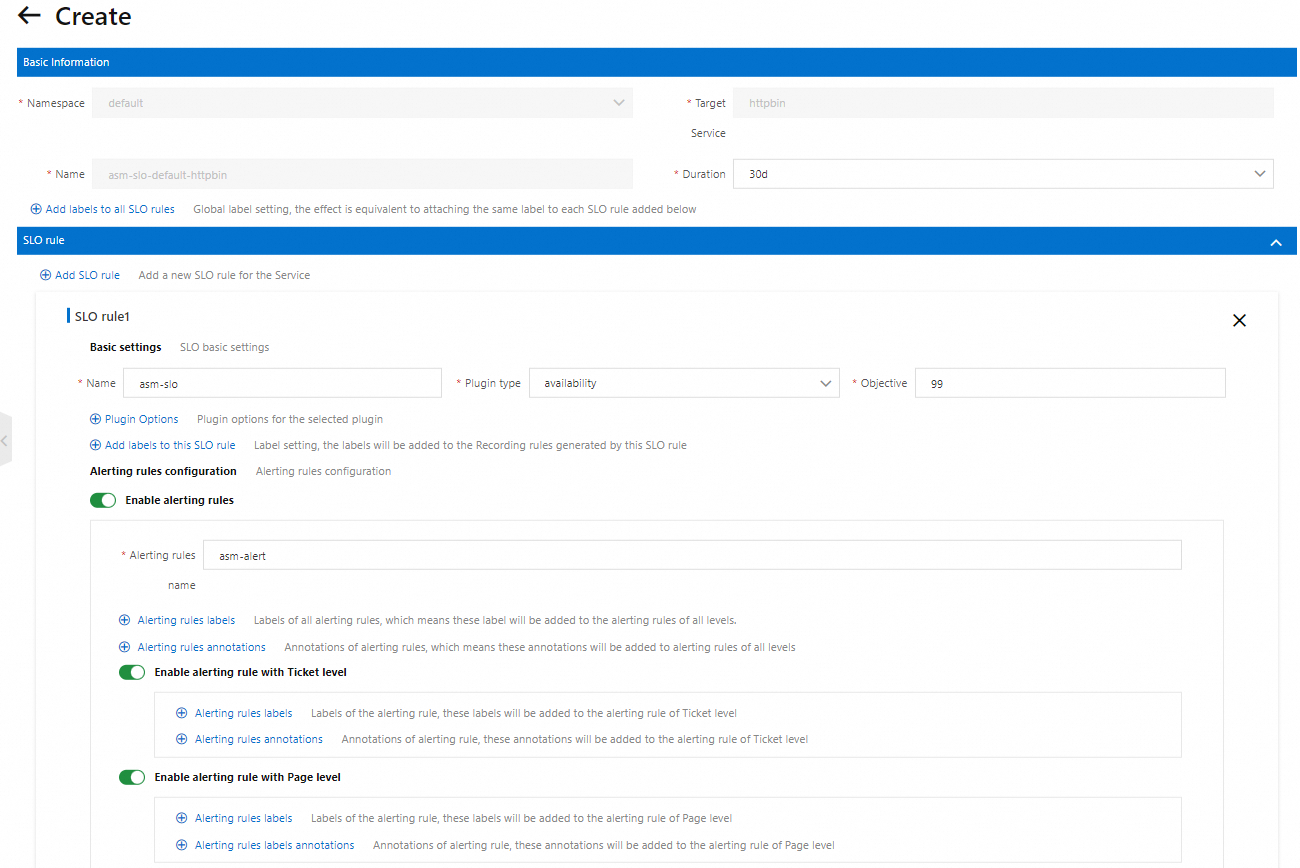
In the Basic Information section, set Duration to 30d.
Click the SLO rule tab and configure the following settings:
Set Name to
asm-slo.Set Plugin type to availability.
Set Objective to
99.Turn on Enable alerting rules and set Alerting rules name to
asm-alert.Turn on Enable alerting rule with Ticket level.
Turn on Enable alerting rule with Page level.
(Optional) Click Preview at the bottom of the page to review the configuration. Confirm that the settings are correct and click Submit.
Click Create at the bottom of the page.
For a detailed explanation of each field, see Description of SLO CRD fields.
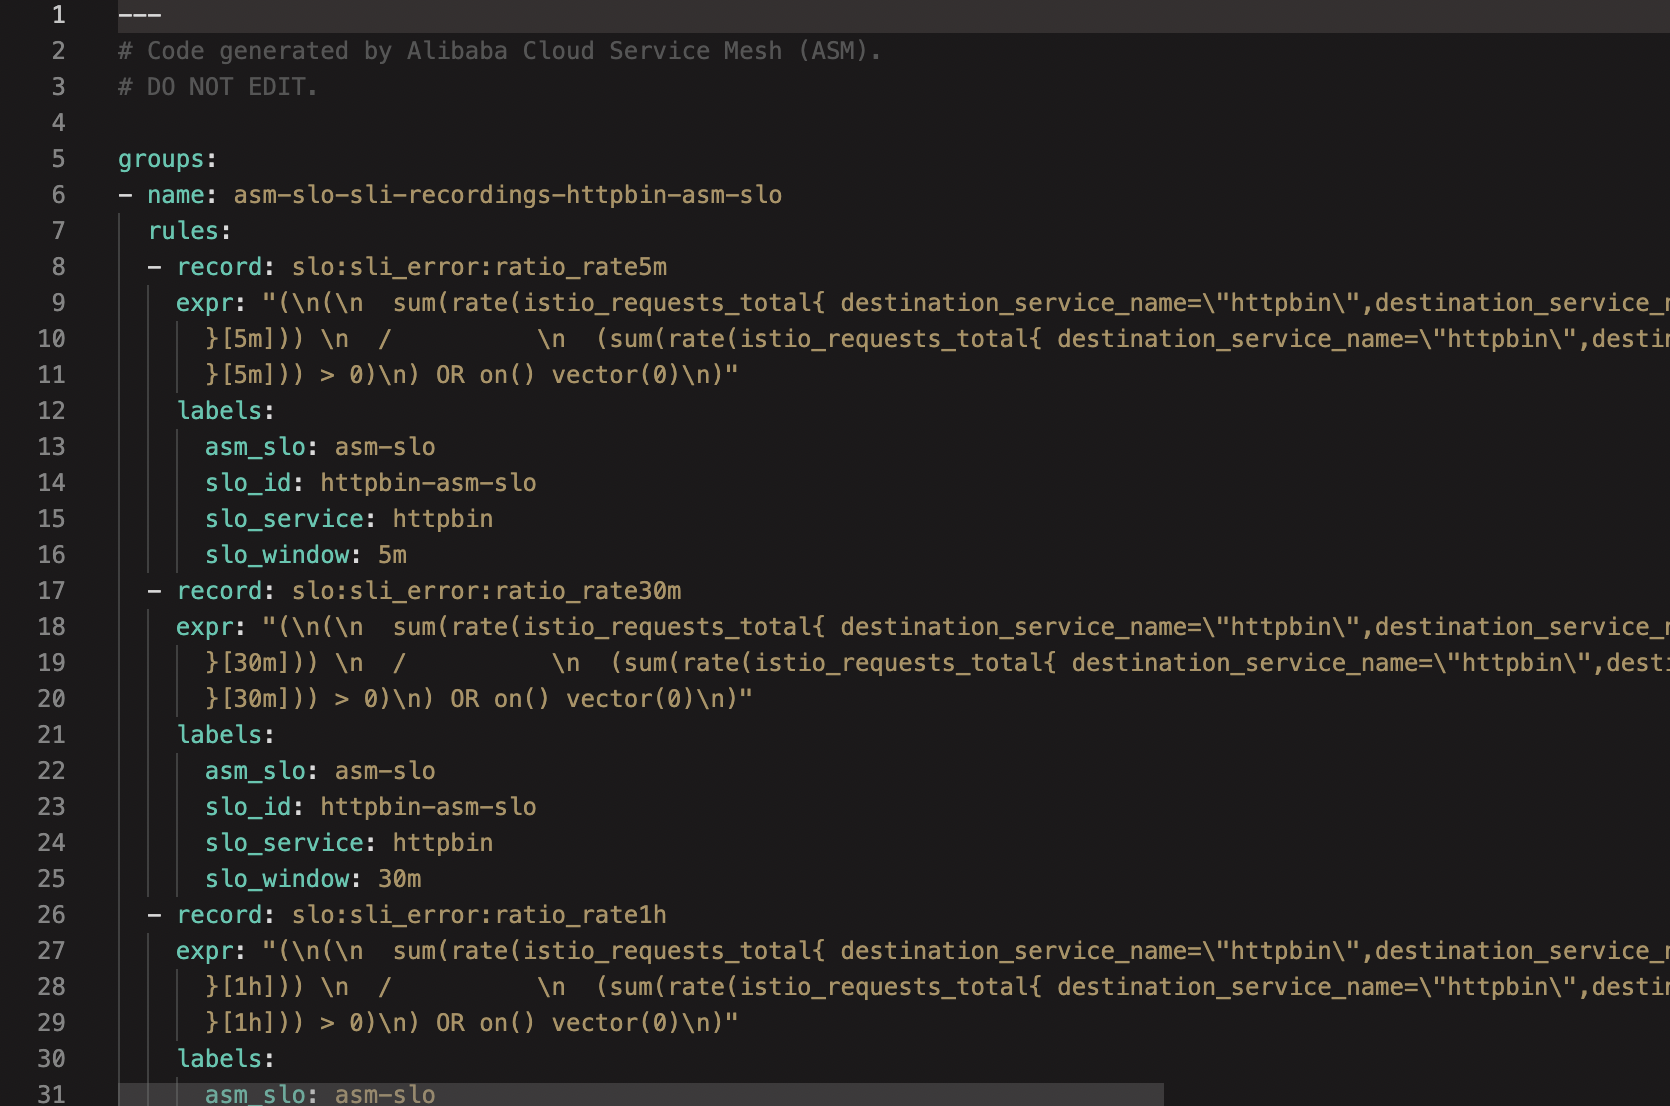
Step 4: View the generated Prometheus rules
After you create the SLO, ASM automatically generates Prometheus recording and alerting rules. These rules define how SLI metrics are calculated across multiple time windows and when alerts fire based on error budget burn rate.
To view the rules, find the httpbin service on the SLO Configuration page and click View Prometheus rules in the Actions column.
Generated rule groups
The generated Prometheus rules fall into three groups:
| Rule group | Purpose |
|---|---|
SLI recordings (asm-slo-sli-recordings-httpbin-asm-slo) | Calculates error ratios across sliding windows (5m, 30m, 1h, 2h, 6h, 1d, 3d, and 30d) using the istio_requests_total metric. Errors include 5xx and 429 response codes. |
Meta recordings (asm-slo-meta-recordings-httpbin-asm-slo) | Stores SLO metadata: objective (0.99), error budget (0.01), time period (30 days), current burn rate, period burn rate, and remaining error budget. |
Alerts (asm-slo-alerts-httpbin-asm-slo) | Defines multi-window, multi-burn-rate alerts at two severity levels. |
Alert thresholds
ASM uses a multi-window, multi-burn-rate approach to detect error budget consumption at different speeds:
| Severity | Short window | Long window | Burn rate factor | Budget consumed |
|---|---|---|---|---|
| Page | 5m > 14.4x | 1h > 14.4x | 14.4 | 2% in 1 hour |
| Page | 30m > 6x | 6h > 6x | 6 | 5% in 6 hours |
| Ticket | 2h > 3x | 1d > 3x | 3 | 10% in 1 day |
| Ticket | 6h > 1x | 3d > 1x | 1 | 10% in 3 days |
A Page-level alert fires when error budget burns fast enough to exhaust within hours, requiring immediate attention. A Ticket-level alert fires for slower burns that need action but are less urgent.
What to do next
Import the generated Prometheus rules into your Prometheus system and visualize SLO metrics in Grafana: