Grafana is an open source data visualization platform on which you can easily view a variety of monitoring metrics on dashboards. This topic describes how to use Grafana to view metrics related to service level objectives (SLOs).
Prerequisites
Procedure
The following steps show you how to import dashboard data and view SLO-related metrics in the Grafana console:
- Run the following commands to install the Grafana application in the Container Service for Kubernetes (ACK) cluster:
# Add the repository information. helm repo add grafana https://grafana.github.io/helm-charts helm repo update # Install the Grafana application. helm install -n monitoring asm-grafana grafana/grafana - Run the following command to obtain the password for logging on to the Grafana console:
kubectl get secret --namespace monitoring asm-grafana -o jsonpath="{.data.admin-password}" | base64 --decode ; echo - Run the following command to forward all traffic from a local port to the asm-grafana service:
kubectl --namespace monitoring port-forward svc/asm-grafana 3000:80 - Click https://localhost:9093 to log on to the Grafana console.
- In the left-side navigation pane, click the
 icon. On the Configuration page, click the Data sources tab. Then, click Add data source.
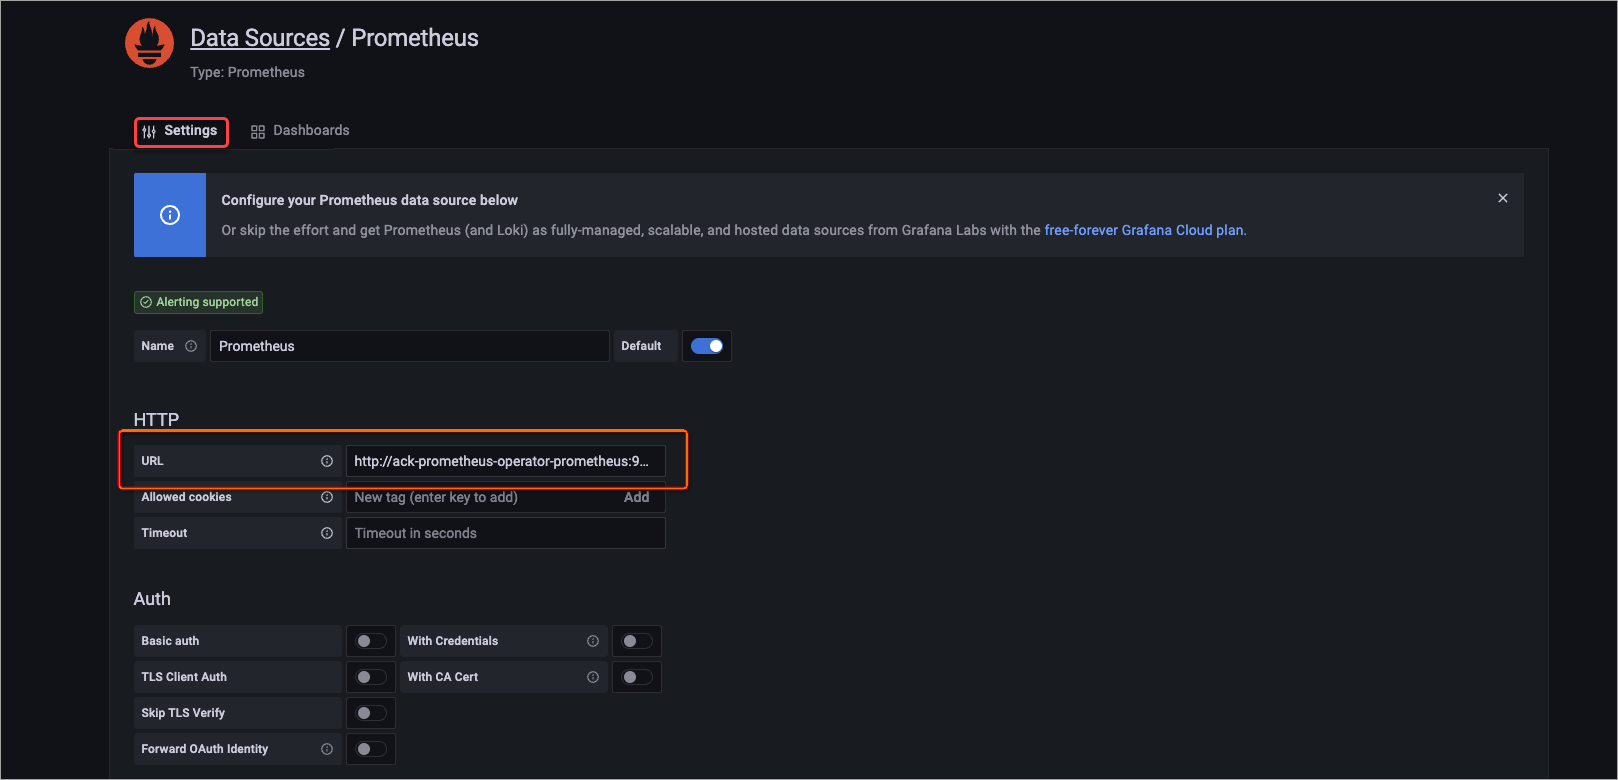
 - On the page that appears, click the Settings tab. In the HTTP section, set the URL parameter to http://ack-prometheus-operator-prometheus:9090, keep the default settings of other parameters, and then click Save.

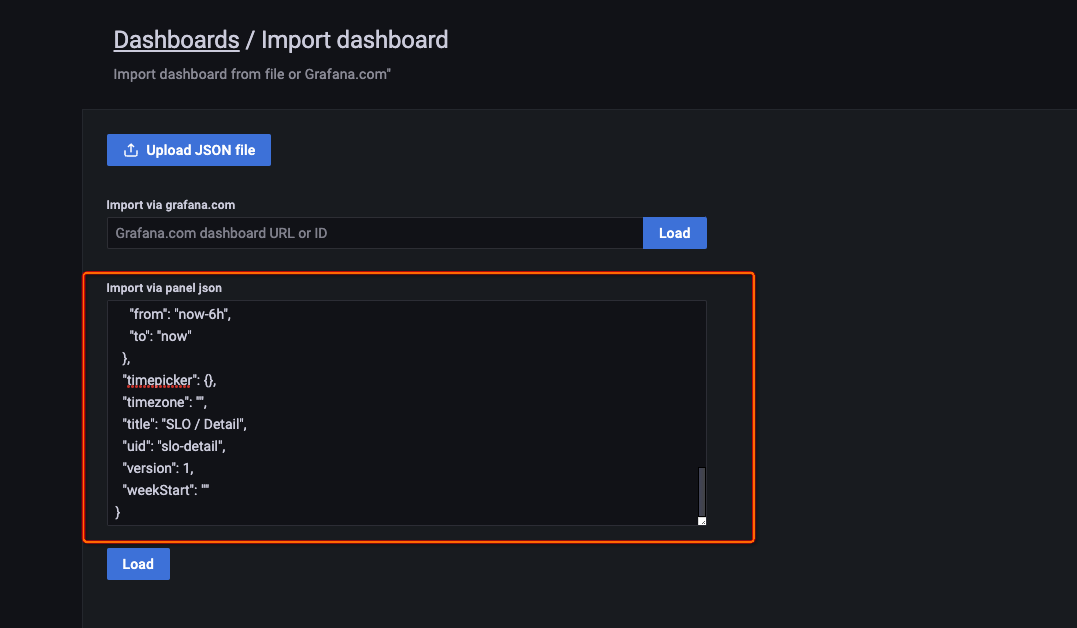
- In the left-side navigation pane, choose , paste the content of the dashboard template into the Import via panel json text box, and then click Load.
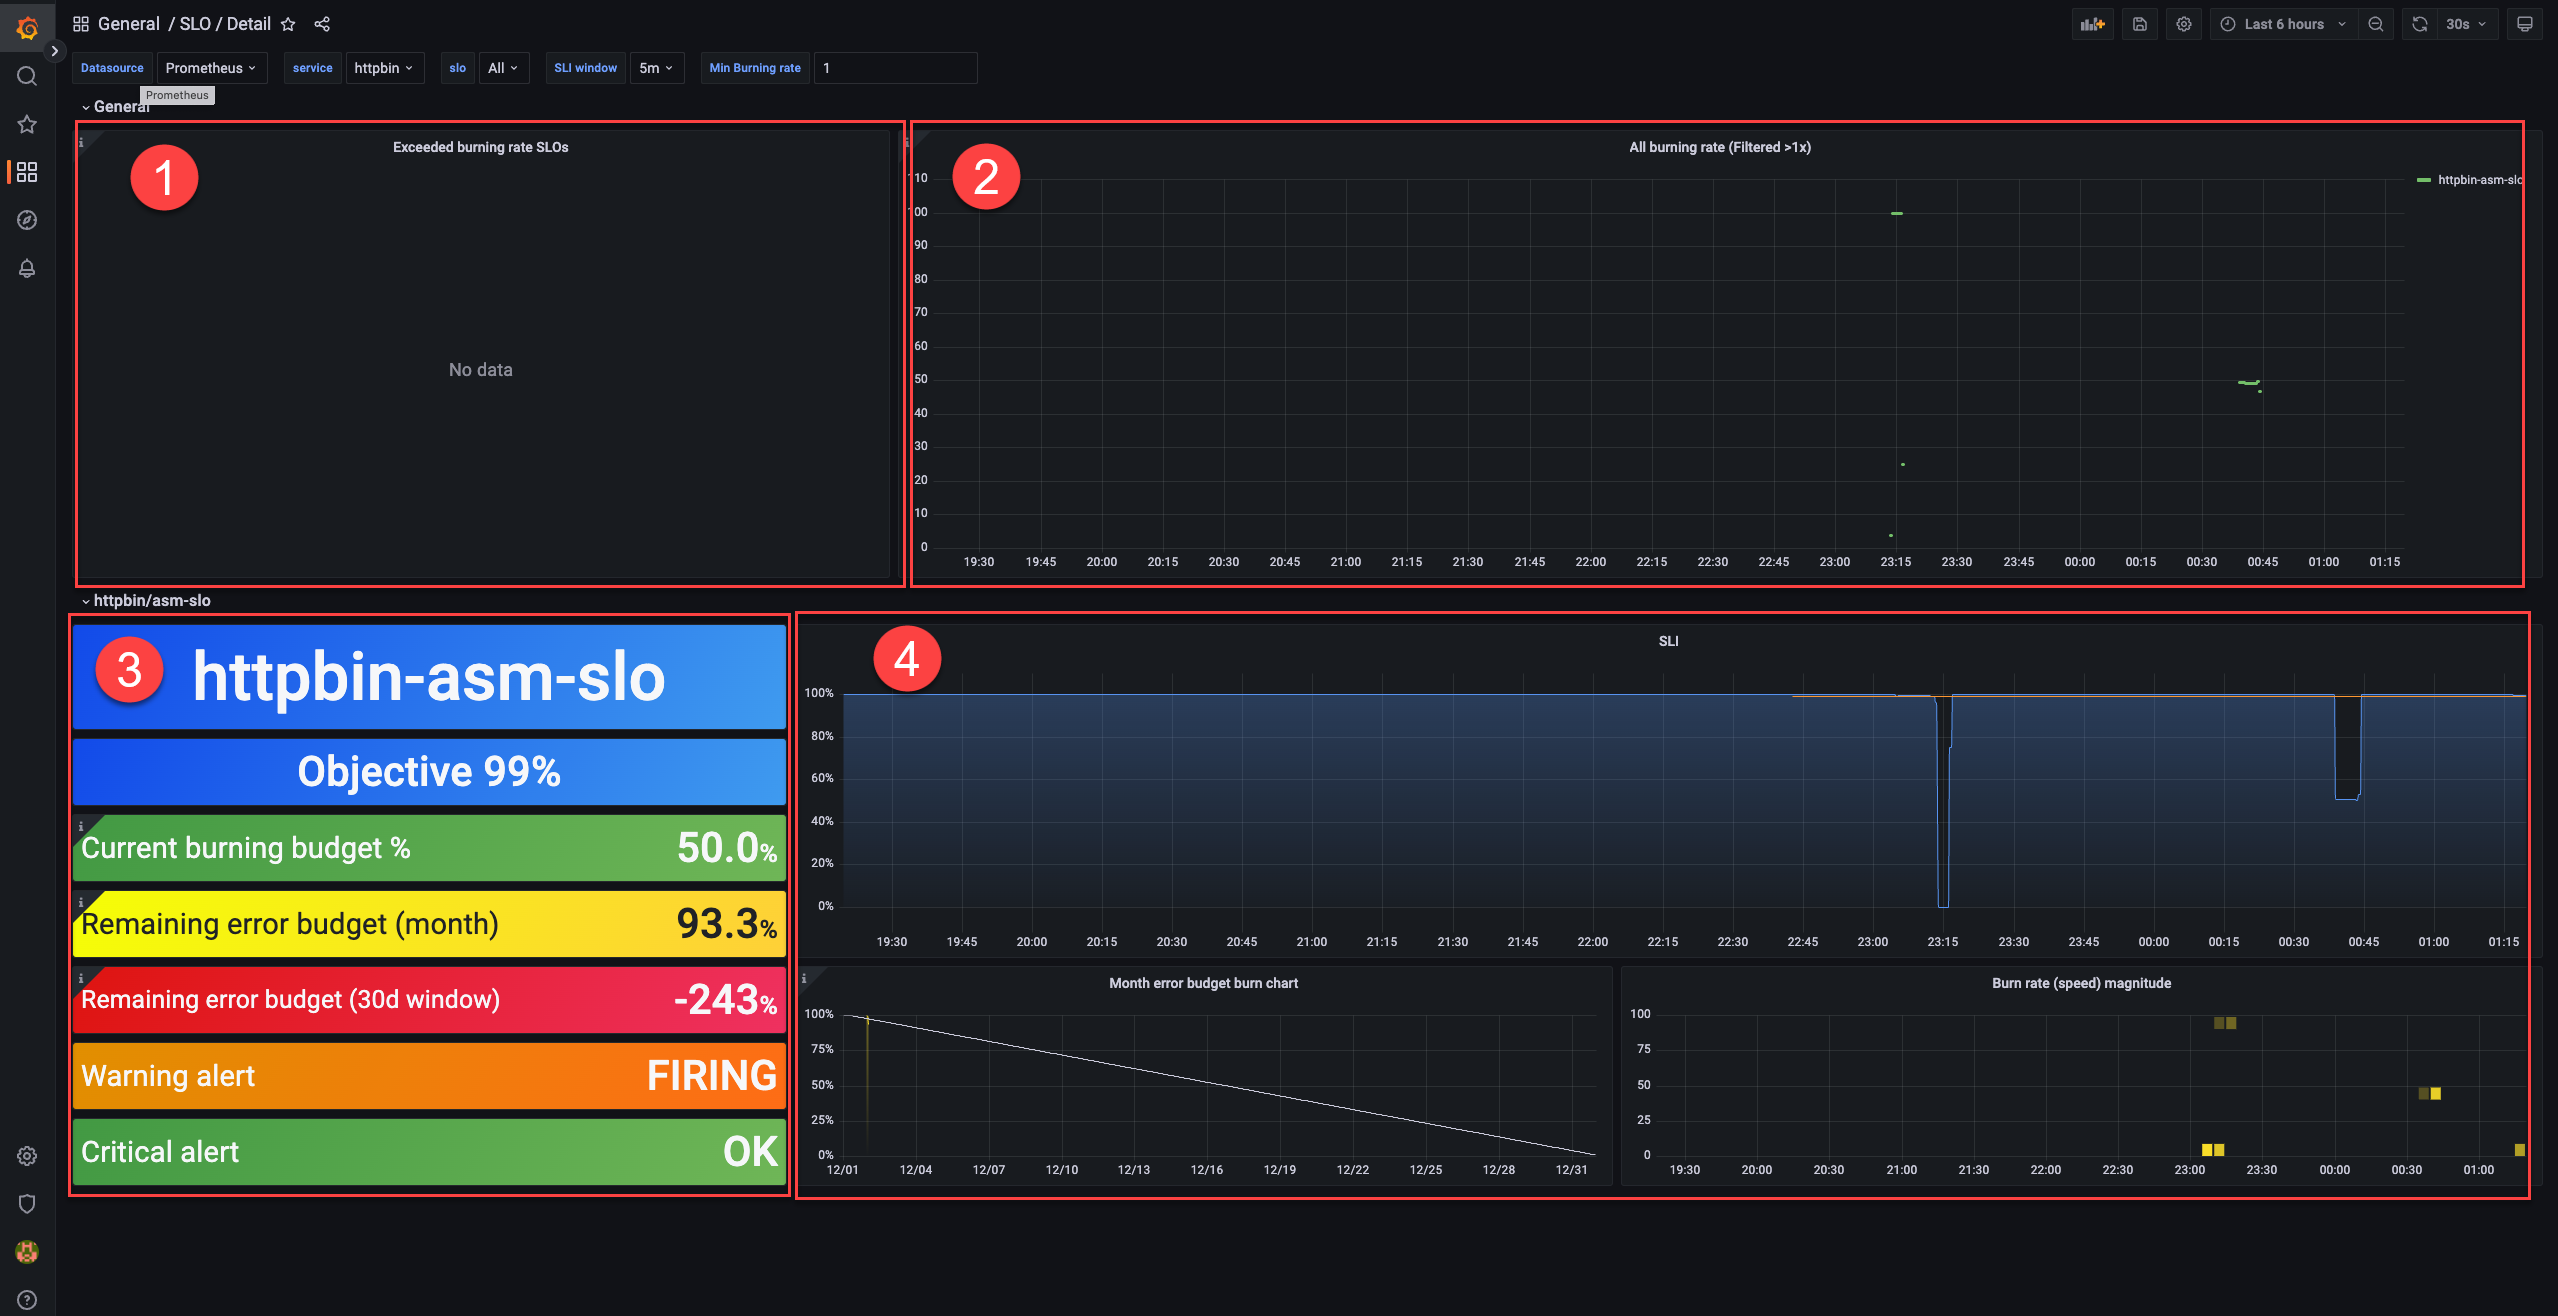
 The following figure shows the display effect. For more information about SLO-related concepts, see SLO overview.
- In area ①, you can view the SLOs whose error budgets are being consumed.
- In area ②, you can view the SLOs whose burn rates exceed 1.
- In area ③, you can view the configurations of an SLO.
Metric Description Objective The objective. In this example, the objective is 99%. Current burning budget % The current burn rate. In this example, the value is 50%. Error rate = (1 - 99%) x 50% = 0.5% Remaining error budget (month) The remaining error budget for the calendar month. In this example, the value is 93.3%. Remaining error budget (30d window) The remaining error budget for the 30-day rolling window. In this example, the value is -243%. A negative remaining error budget means that the service does not achieve the SLO in the rolling window. Whether the service ultimately achieves the SLO is determined by the remaining error budget on the last day of the compliance period.
Warning alert Indicates whether a warning-level alert is triggered. In this example, the value is FIRING, which indicates that a warning-level alert is triggered. Critical alert Indicates whether a critical-level alert is triggered. In this example, the value is OK, which indicates that no critical-level alert is triggered. Note The remaining error budget is calculated based on the ratio of the periods of time when errors occur to the periods of time when no errors occur. The difference between the two remaining error budgets is large because they are calculated based on the average metric values in time windows of different sizes. The time window for the metric Remaining error budget (month) is one hour and that for the metric Remaining error budget (30d window) is five minutes. The time window for the metric Remaining error budget (30d window) is divided into more time segments. In normal cases, the periods of time when errors occur and those when no errors occur proportionally increase regardless of time window segments. However, in this example, most test requests are error requests and no requests are initiated in other periods of time. The periods of time when no requests are initiated are not taken into account for the calculation. Therefore, only the periods of time when errors occur increase. In normal cases, the two remaining error budgets have similar values. - In area ④, you can view how the monthly error budget and the burn rate of an SLI change.